kbischo@gwdg.de 11institutetext: Universitäts-Sternwarte, Geismarlandstraße 11, 37083 Göttingen, Germany 22institutetext: Max–Planck–Institut für extraterrestrische Physik, Giessenbachstraße, 85740 Garching, Germany
Properties of new X-ray selected AGN ††thanks: Visiting Astronomer, German-Spanish Astronomical Centre, Calar Alto, operated by the Max-Planck-Institute for Astronomy, Heidelberg, jointly with the Spanish National Commission for Astronomy. ††thanks: based partially on observations collected at the European Southern Observatory, La Silla, Chile.
Abstract
We present the results of a program to identify so far unknown active nuclei (AGN) in galaxies. Candidate galactic nuclei have been selected for optical spectroscopy from a cross-correlation of the ROSAT all sky survey (RASS) bright source catalog with optical galaxy catalogs. A high X-ray flux has been used as pointer to galaxies with a high probability to contain active nuclei. Only galaxies have been accepted for the program for which no activity was noted in NED. For many of the galaxies no radial velocity has been reported before. The optical spectra obtained in our first two runs demonstrate that the galaxies cover a redshift range of 0.014 to 0.13 and that most of them host active nuclei. For 50% to 75% of the candidates the X-ray emission is caused by the AGN. In addition several of the remaining candidates host Seyfert 2/LINER nuclei that, however, most certainly are not the source of the X-ray emission. For a detailed analysis of the first data see Pietsch et al. (1998); in this paper we present results from the second optical observing run.
1 Sample definition
Our sample is based on a cross-correlation of the X-ray sources of the ROSAT all-sky survey (RASS) bright source catalogue (Voges et al. 1996) with the galaxies of the Catalogue of Principal Galaxies PGC (Paturel et al. 1989). With a conservative correlation radius (maximum allowed distance between X-ray and optical position) of 100 arcsec the cross-correlation resulted in a list of 1124 galaxies. The RASS bright source catalog count rate threshold of 0.05 cts/s (corresponding to a luminosity of erg sec-1 for a distance of 10 Mpc – most of our galaxies are at greater distances) assures that all selected galaxies are clearly over-luminous in X-rays with respect to comparable normal galaxies (cf. Fabbiano et al. 1992).
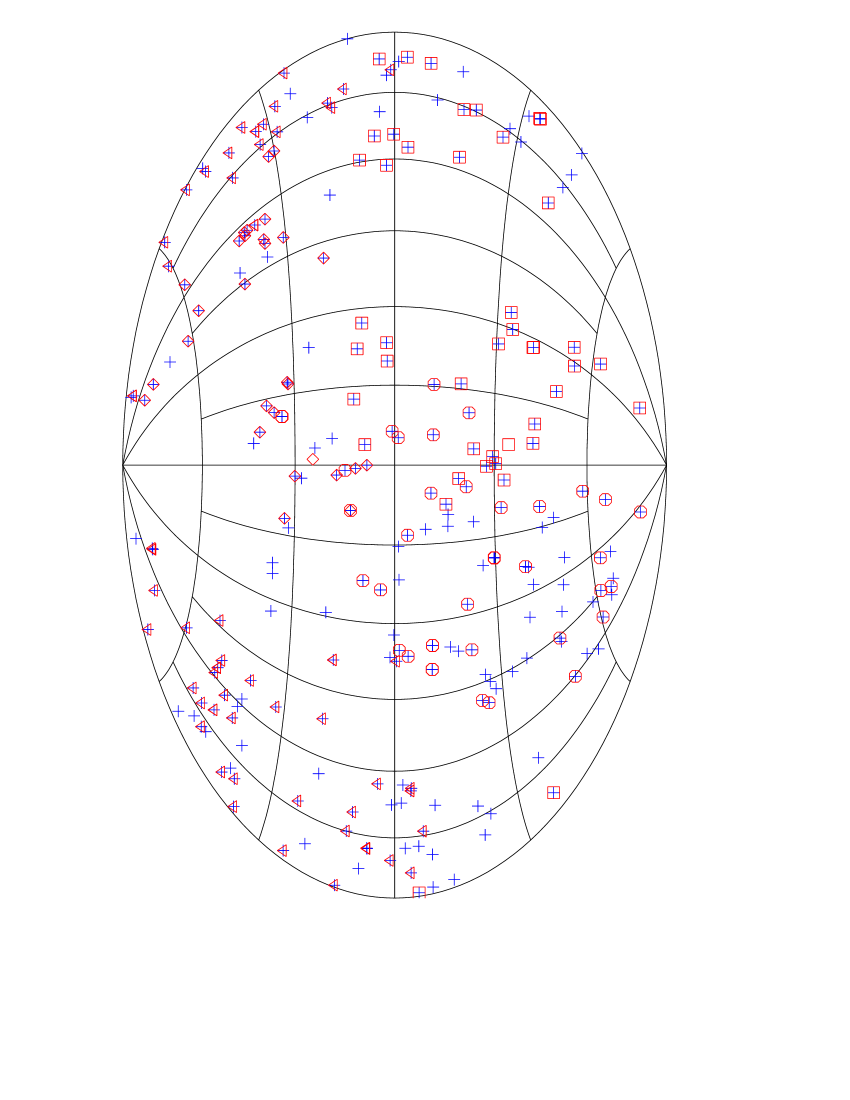
To exclude known objects, for which we would expect high X-ray fluxes (AGNs, known clusters of galaxies, nearby galaxies) and other candidates for the X-ray identification (stars, white dwarfs) we checked corresponding data bases and catalogs. About 300 of the galaxies in our sample were known AGNs and for more than 250 the X-ray emission was most likely due to hot cluster gas. Finally we excluded objects with clearly extended X-ray emission which are candidates for unknown cluster emission. Our final sample contains 230 galaxies (Fig. 1).
| Name | RA(2000.0) | Dec(2000.0) | cz(abs) | cz(em) | AGN type | Comment |
|---|---|---|---|---|---|---|
| (h m s) | (d m s ) | (km s-1) | (km s-1) | |||
| UGC 32 | 00 04 58.5 | 11 42 03 | 22260 150 | 22350 15 | Sy1.9 | |
| NGC 57 | 00 15 30.9 | 17 19 43 | 5580 150 | non active | ||
| NGC 70 | 00 18 22.4 | 30 04 46 | 7080 150 | 7080 15 | Sy2/LINER | Arp113, group |
| NGC 71 | 00 18 23.8 | 30 03 48 | 6750 150 | 6630 15 | Sy2/LINER | Arp113, group |
| KUG 0128+328 | 01 31 23.8 | 33 08 36 | 21090 60 | Sy1 | ||
| MCG +05-34-053 | 14 29 11.6 | 30 04 38 | 4470 60 | SB | ||
| CGCG 163-074 | 14 32 09.0 | 31 35 03 | 16620 15 | Sy1.5 | ||
| VIIZW 608 W | 15 32 09.7 | 58 54 19 | 19380 150 | 19200 30 | Sy2/LINER | group of 3, in cl. |
| VIIZW 608 E | 15 32 16.2 | 58 54 03 | 20640 150 | non active | group of 3, in cl. | |
| KUG 1618+410 | 16 19 51.2 | 40 58 47 | 11370 15 | NLS1 | ||
| KUG 1618+402 | 16 20 12.9 | 40 09 06 | 8550 15 | Sy1 | ||
| CGCG 196-064 | 16 26 36.4 | 35 02 42 | 10350 150 | 10260 60 | Sy1.5 | |
| NGC 6159 | 16 27 25.2 | 42 40 47 | 9480 150 | Sy2/LINER | ||
| NGC 6160 | 16 27 41.1 | 40 55 37 | 9630 150 | non active | ||
| MCG +06-37-023 | 17 03 27.8 | 36 04 19 | 18840 150 | Sy2/LINER | ||
| MCG +06-38-005 | 17 12 28.5 | 35 53 03 | 8040 30 | Sy1.5 | asym. Balmer profiles | |
| MCG +13-12-022 | 17 18 16.6 | 78 01 07 | 17010 150 | non active | cl? | |
| MCG +05-41-010 | 17 22 15.4 | 30 42 40 | 13980 150 | non active | Gpair, NE comp. | |
| NGC 6370 | 17 23 25.1 | 56 58 30 | 8310 150 | Sy2/LINER | cl? | |
| NGC 6414 | 17 30 37.1 | 74 22 32 | 12600 150 | non active | cl | |
| MCG +07-37-018 | 18 02 40.4 | 42 47 45 | 15180 150 | non active | Gpair, north.comp. | |
| 18 02 39.5 | 42 47 16 | 14070 15 | SB | Gpair, south.comp. | ||
| MCG +10-26-015 | 18 06 35.7 | 61 35 38 | 8100 150 | non active | cl? | |
| MCG +03-47-002 | 18 27 14.7 | 19 56 19 | 12180 15 | Sy1 | ||
| CGCG 493-002 | 21 38 33.5 | 32 05 06 | 7380 15 | Sy1.5 | ||
| CGCG 493-004 | 21 41 53.5 | 31 51 28 | 13050 30 | NLS1 | cl?, very weak [OIII] | |
| UGC 11950 | 22 12 31.8 | 38 40 56 | 6150 150 | Sy2/LINER | ||
| UGC 12040 | 22 27 05.8 | 36 21 42 | 6390 150 | 6270 30 | Sy1.9 | |
| UGC 12282 | 22 58 55.4 | 40 55 54 | 5220 150 | 5130 15 | Sy1.9 | |
| UGC 12804 | 23 54 36.6 | 24 33 22 | 10230 150 | non active | cl? | |
| cl = in cluster |
2 Optical observations
In order to cover the entire sky we performed four runs of optical observations. In November 1996 and July 1997 we used the 2.2m ESO/MPG telescope at La Silla observatory with EFOSC2 spectrograph. The data taken in November 1996 are already published (Pietsch et al. 1998). In August 1997 and March 1998 we carried out observations with the 2.2m telescope at Calar Alto observatory with CAFOS spectrograph. This paper deals with the data of August 1997. We used a 2048 2048 SITe#1d CCD with a pixelsize of 24. This setup led to a dispersion of 2 Å per pixel, a spectral coverage of 4200-8200 Å, and a spectral resolution of 8 Å.
A publication of the data of July 1997 and March 1998 is in preparation (Bischoff et al. 1999).
3 Results
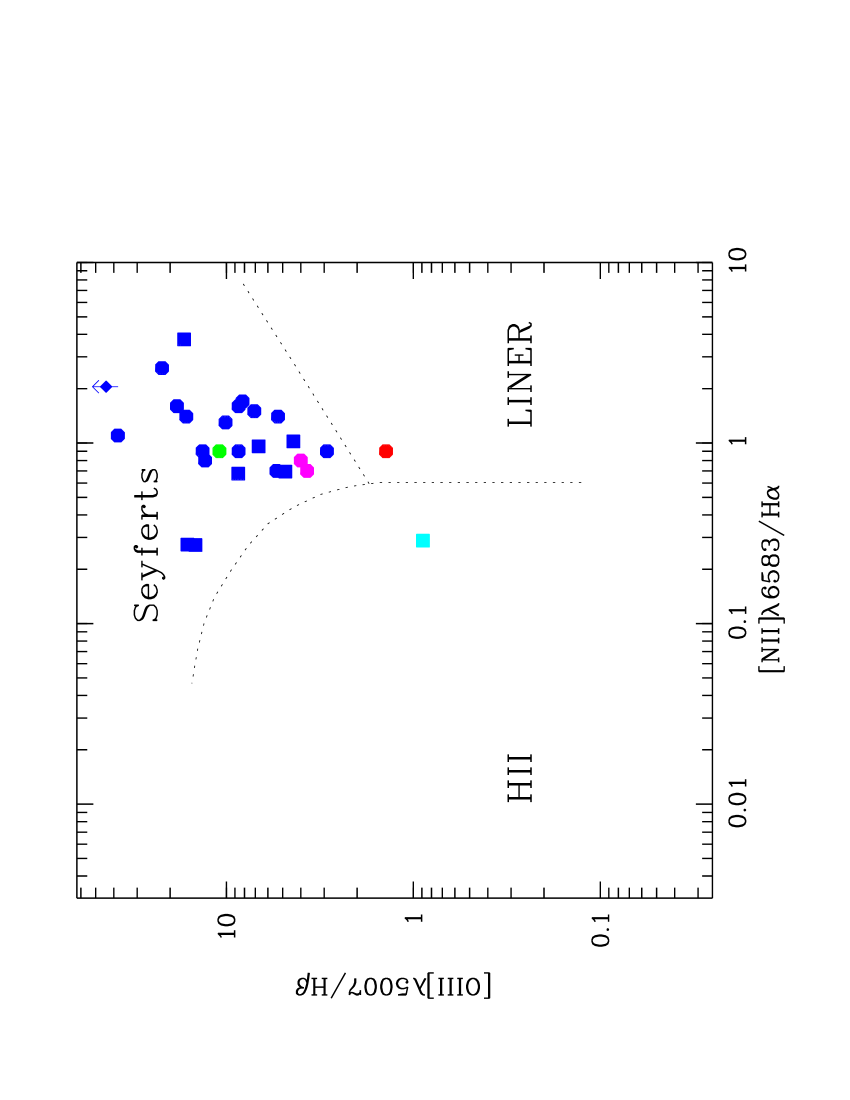
From the spectral fits we classified our objects as AGN using diagnostic diagrams (Fig. 2) following Baldwin et al. (1981). We also determined the AGN type. Following the Osterbrock (1989) definition we classified the AGN in Seyfert types according to the relative strength of narrow to broad components of the H and H emission lines. Seyfert 2 galaxies show only narrow Balmer lines. Narrow line Seyfert 1 galaxies (NLS1) are a peculiar group of Seyferts with intermediate Balmer line widths (cf. Goodrich 1989, Osterbrock & Pogge 1985). We define LINERs (Low Ionization Nuclear Emission-line Region) following Ho (1997). For some of our galaxies a separation between a Seyfert 2 or LINER nucleus is not possible because [O iii] and H are not detected. Table 1 lists the optical coordinates of our sample sources, redshifts measured from absorption and/or emission lines, and the determined AGN types.
| 96 Nov. | 97 Aug. | total | |
| frequency | |||
| Sy1 | 5 | 3 | 11% |
| Sy1.2 …1.9 | 16 | 7 | 33% |
| NLS1 | 1 | 2 | 4% |
| Sy2 | 2 | – | 3% |
| LINER | 3 | – | 4% |
| Sy2/LINER | 4 | 7 | 16% |
| BL Lac | 3 | – | 4% |
| QSO | 1 | – | 1% |
| Hii | – | 2 | 3% |
| non active | 3 | 9 | 16% |
To analyse the radio properties of our sources we looked for counterparts in recent radio surveys. The 1.4 GHz radio flux was taken from the NRAO VLA Sky Survey NVSS (Condon et al. 1998), the 4.85 GHz flux from the Parkes-MIT-NRAO PMN survey (Griffith et al. 1995).
Figure 3 (left panel) shows the ratio for objects with radio counterparts. Using the formalism of Kellermann et al. (1989) one can quantify the radio-quiet or radio-loud nature of our objects. The ratio of radio to optical flux density for most objects is below 10 and objects below such a value are considered as radio-quiet (of course, there is no strict dividing line between radio-quiet and radio-loud objects). The most intense radio emitters in our sample (RX J011232.8-320140 and NGC 1218) show a radio to optical flux ratio of about 275.
From the RASS count rate we calculated the X-ray flux assuming a power-law spectrum with fixed photon spectral index , which is the typical value found for extragalactic objects with ROSAT (cf. Hasinger et al. 1991, Walter & Fink 1993), and an absorbing column density fixed at the individual Galactic hydrogen value NHgal along the line of sight (Dickey & Lockman 1990). With this procedure we do not correct for absorption of the X-rays within the galaxy. Therefore, our X-ray fluxes derived with this method have to be understood as lower limits of the intrinsic fluxes if the X-rays are emitted from active nuclei within the galaxies.
The optical B magnitudes were taken from the NASA Extragalactic Database (NED)111The NASA/IPAC Extragalactic Database is operated by the Jet Propulsion Laboratory, California Institute of Technology, under contract with the National Aeronautics and Space Administration.. If no B magnitude was available in NED we took the magnitude from the PGC (Paturel et al. 1989). For VII Zw 608 E (eastern component) and the companion of MCG+07-37-018 the magnitudes were estimated from our acquisition images. The monochromatic flux at 4400Å and the total far-infrared (40-120m) fluxes were calculated as described in Pietsch et al. (1998). To compute absolute magnitudes and luminosities we adopted a Hubble constant and cosmological deceleration parameter of .
4 Discussion
Most of our sources turn out to harvest an active nucleus or even merging nuclei where at least one component is active. It is, however, not yet clear if these active nuclei really are the source of the X-rays.
We have several ways to attack this problem and can propose solutions for individual galaxies:
-
•
Information about source extension from the RASS catalog: If a source is extended the major part of the X-ray emission will not originate in the nucleus (8% of the sources).
-
•
Unresolved HRI detection of a source centered on the nucleus strongly argues for a nuclear origin of the X-rays (24% of the sources).
-
•
Time variability in the X-ray flux rules out emission from extended gas clouds and strongly argues for an AGN (24% of the sources).
-
•
Comparision of measured X-ray luminosity with those expected from the AGN / morphology type of the galaxy or for the galaxy surroundings (group or cluster environment) can give hints on the origin of the X-rays. In some cases this would argue for an origin of the X-ray emission in the surrounding group or cluster (16% of the sources); Hot gas in the early type host galaxy could explain the X-ray emission for others (13% of the sources).
-
•
Line fitting analysis of prominent optical emission lines: The location of our objects in the diagnostic diagrams of Osterbrock (1989) clearly demonstrates their AGN nature (cf. Fig. 2) (47% of the sources).
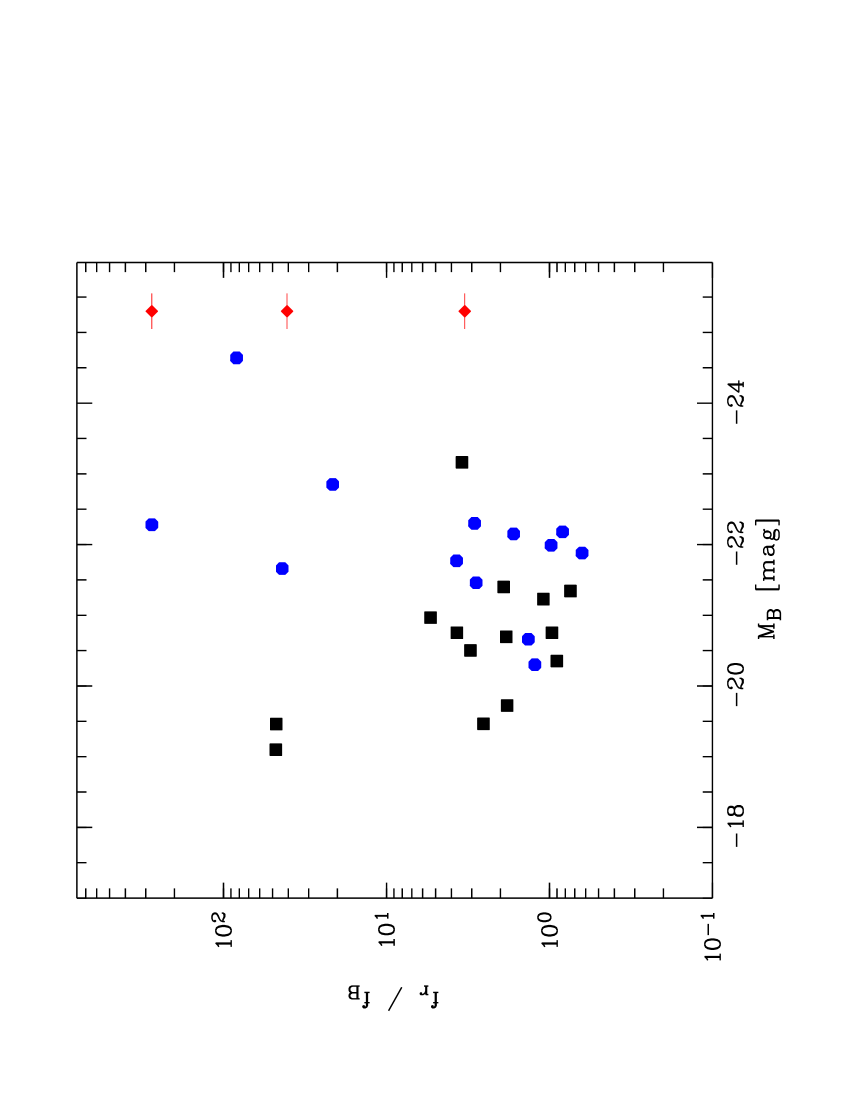
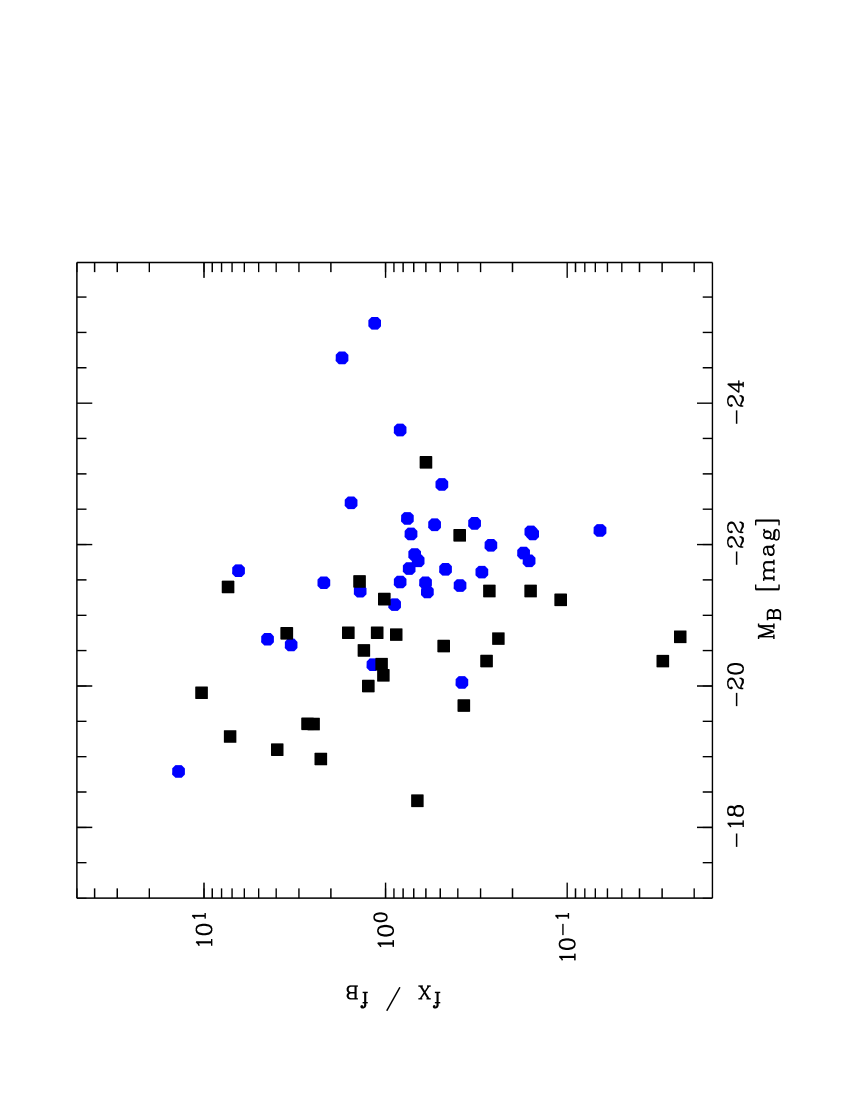
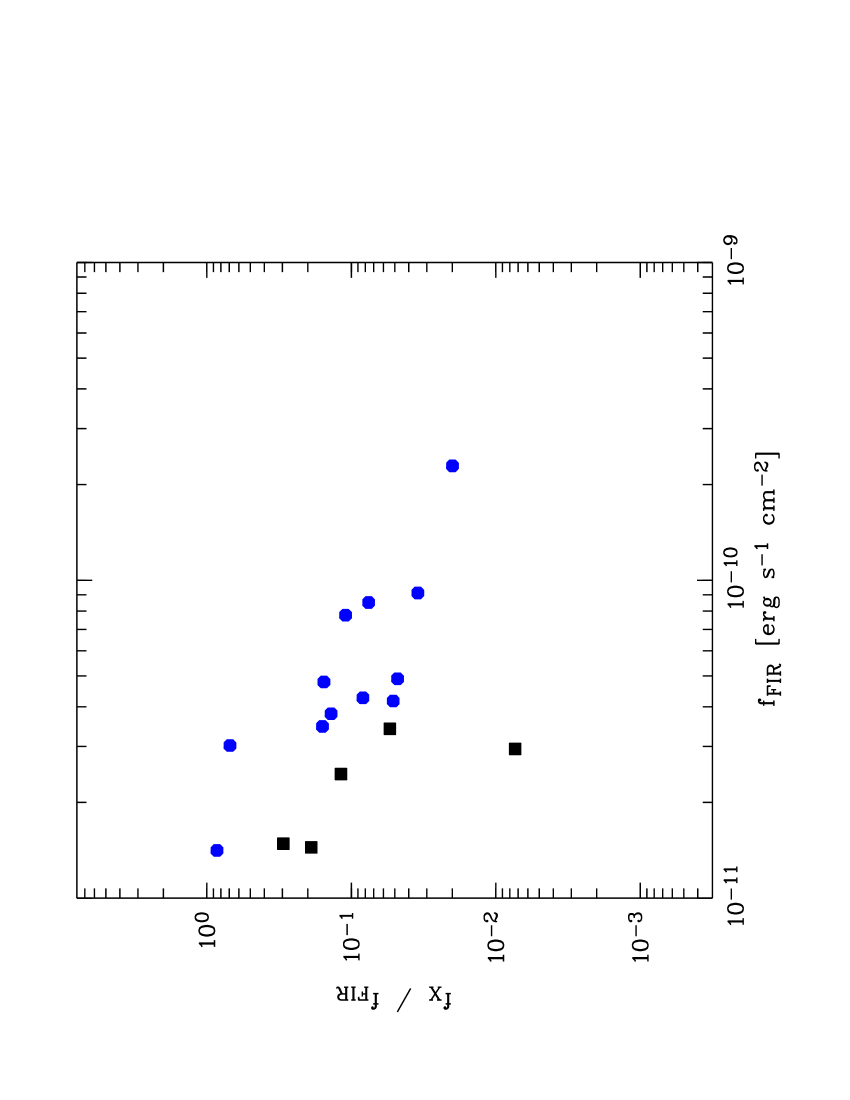
The flux ratios are an additional indication of the AGN character of the objects. Using the nomograph shown in Fig. 1 of Maccacaro et al. (1988), one sees that the combined X-ray flux and optical MB of our objects agree well with those expected from AGN (Fig. 3, middle panel). The right panel gives the ratio of the X-ray to far-infrared (40-120 ) flux. All of the objects show flux ratios above a value of 0.01. As shown in Fig. 5 of Boller et al. (1998) most AGN exhibit flux ratios above that value. Theoretical models addressing the X-ray and far-infrared emission of galaxies in different states of nuclear activity suggest that flux ratios above about 0.01 require AGN activity, whereas values below about 0.01 can be explained by starburst activity (Bertoldi & Boller, in preparation).
The results of our optical follow up observing runs have demonstrated that our selection strategy from the RASS bright source catalog – PGC correlations is rather efficient in detecting new active galactic nuclei. From all observations we expect the detection of about 100 new members of the nearby AGN population. The detailed analysis of the entire data and the discussion of its implications will be published in a following paper.
Acknowledgements.
The ROSAT project is supported by the German Bundesministerium für Bildung, Wissenschaft, Forschung und Technologie (BMBF/DLR) and the Max-Planck-Gesellschaft (MPG). This work has been partially supported by Deutsches Zentrum für Luft- und Raumfahrt e.V. (DLR) grant 50 OR 9408 9.References
- [1]
- [2]
- [3] Baldwin J.A., Phillips M.M, Terlevich R., 1981, PASP 93, 5
- [4] Bertoldi F., Boller Th., 1998, in preparation
- [5] Bischoff K., Pietsch W., Kollatschny W., 1999, in preparation
- [6] Boller Th., Bertoldi F., Dennefeld M., Voges W., 1998, A&AS 129, 87
- [7] Condon J.J., Cotton W.D., Greisen E.W., et al., 1998, AJ 115, 1693
- [8] Dickey J.M., Lockman F.J., 1990, ARA&A 28, 215
- [9] Fabbiano G., Kim G.-W., Trinchieri G., 1992, ApJS 80, 531
- [10] Griffith M.R., Wright A.E., Burke B.F., Ekers R.D., 1995, ApJS 97, 347
- [11] Goodrich R.W., 1989, ApJ 342, 224
- [12] Hasinger G., Trümper J., Schmidt M., 1991, A&A 246, L2
- [13] Ho L., 1997, ASP Conf. Ser. 103, 105
- [14] Kellermann K.I., Sramek R., Schmidt M., Shaffer D.B., Green R., 1989, AJ 98, 1195
- [15] Maccacaro T., Gioia I.M., Wolter A., Zamorani G., Stocke J.T., 1988, ApJ 326, 680
- [16] Osterbrock D.E., 1989, Astrophysics of Gaseous Nebulae and Active Galactic Nuclei (University Science Books)
- [17] Osterbrock D.E., Pogge R.W., 1985, ApJ 297, 166
- [18] Paturel G., Fouque P., Bottinelli L., Gouguenheim L., 1989, A&AS 80, 299
- [19] Pietsch W., Vogler A., Kahabka P., Jain A., Klein U., 1994, A&A 284, 386
- [20] Pietsch W., Bischoff K., Boller T., Döbereiner S., Kollatschny W., Zimmermann H.-U., 1998, A&A 333, 48
- [21] Voges W., Aschenbach B., Boller T., et al., 1996, IAU Circ. 6420
- [22] Walter R., Fink H.H., 1993, A&A 274, 105