Profile variations in AGN spectra
Abstract
We present results of optical long-term variability campaigns (10 – 20 years) of the two Seyfert galaxies NGC 7603 and Mrk 110. The variations of the continuum, of the individual broad line intensities and of their line profiles are investigated in detail and compared to line profile variations in NGC 5548 and NGC 4593. Individual emission line profiles vary differently from line to line and from outburst to outburst indicating a complex and structured broad emission line region.
Universitäts-Sternwarte, Geismarlandstr. 11, D-37083 Göttingen, Germany
1. Introduction
Many Seyfert 1 galaxies are known to be variable in the continuum and in the broad emission line fluxes on time scales of weeks to years. They might be variable on even shorter time scales. The continuum and line intensity variations can give us information on the radius of the broad line region (BLR) and their internal kinematics.
We will present some results on line and continuum variations in the Seyfert galaxies NGC 7603 and Mrk 110. These results will be compared to earlier variability campaigns of NGC 5548 (AGN Watch: Peterson et al., 1991; Kollatschny & Dietrich 1996) and NGC 4593 (LAG campaign: Robinson 1994; Kollatschny & Dietrich 1997).
We are interested to study the variations of as many broad emission lines per galaxy as possible to look for individual differences in their amplitudes and lags with respect to continuum variations and to look for internal profile changes.
2. Observations
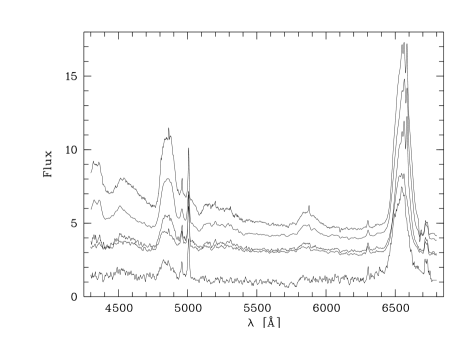
We obtained optical spectra of NGC 7603 over a long period from 1979 until 1996 with typical sampling intervals of one year. NGC 7603 is a bright Seyfert 1 galaxy () with broad line profiles (FWHM(H)=6500 km s-1). Most of our spectra covering the whole optical spectral range (see Figure 1) were taken at Calar Alto Observatory and at McDonald Observatory.
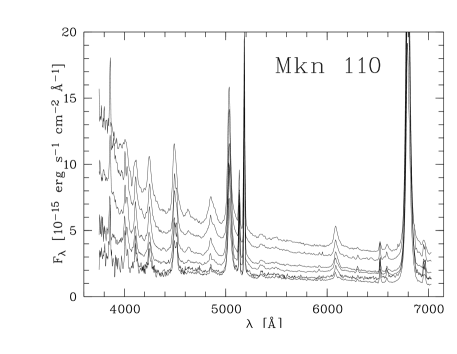
Spectra of Mrk 110 (=-20.6) have been taken at the same observatories from 1987 until 1995 at 24 epochs. The emission line profiles of Mrk 110 are quite narrow (FWHM(H)=1800 km s-1) similar to the so called Narrow Line Seyfert Galaxies.
NGC 5548 has been monitored in the optical by many observers with different telescopes from December 1988 until October 1989 during the first year of the AGN Watch (Peterson et al. 1991, Kollatschny & Dietrich 1996). High quality H, H, H, He i, and He ii spectra have been obtained at 30 to 70 epochs.
H and H spectra of NGC 4593 were taken at La Palma with the WH and IN telescopes from January until June 1990 at 23 epochs as part of the LAG campaign.
3. Results and Discussion
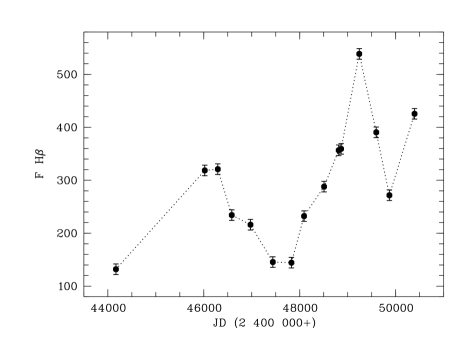
Some of our optical spectra of NGC 7603, normalized to the narrow forbidden lines, are shown in Figure 1. They represent five different epochs at low, intermediate and high stages. Our observed H light curve is plotted for the period 1979 until 1996 in Figure 2. Strong variations in the emission line intensities and profiles are clearly to be seen. The broad Fe ii multiplets at 4400–4700 Å and 5080–5400 Å show variations of the same order. Our light curve of NGC 7603 was not sampled with high frequency. Therefore, the cross correlation analysis (CCF) of the emission line intensities with the continuum light curve gives only a coarse estimate of the radius of the BLR of the order of 50 light days.
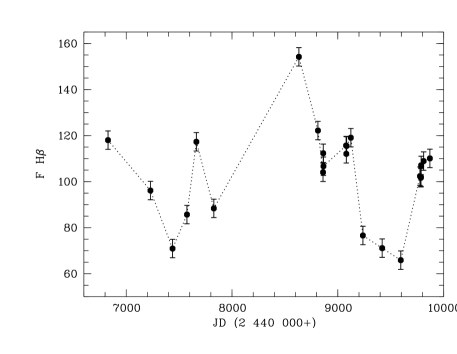
Normalized spectra of Mrk 110 are plotted in Figure 3. The H light curve over the period from 1987 until 1995 is given in Figure 4. The highly excited He ii 4686 line in Mrk 110 shows the largest amplitude in the light curve, the broadest line profile and the strongest profile changes. Indication of strong variability in the He ii line has already been mentioned by Peterson (1988). Our CCF analysis reveals that the broad He ii line originates close to the central ionizing source (in only 6 light-days distance) in comparison to the Balmer lines (40–70 light-days).
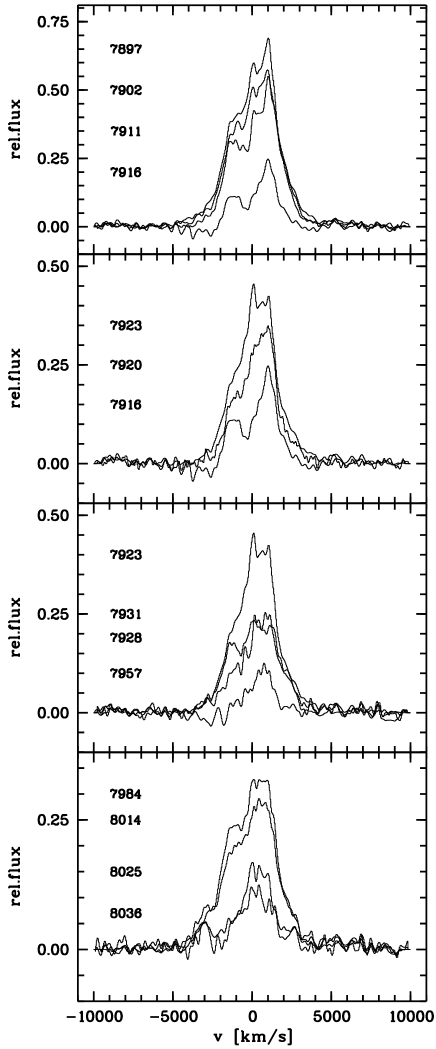
Detailed analyses of line profile variations in NGC 5548 and NGC 4593 have been published earlier by us (Kollatschny & Dietrich 1996, 1997). Individual H difference profiles with respect to our minimum state of NGC 4593 are plotted in Figure 5. There are variations on time scales of days only. The red and blue wings vary differently. Individual segments in the profiles appear and disappear on short time scales.
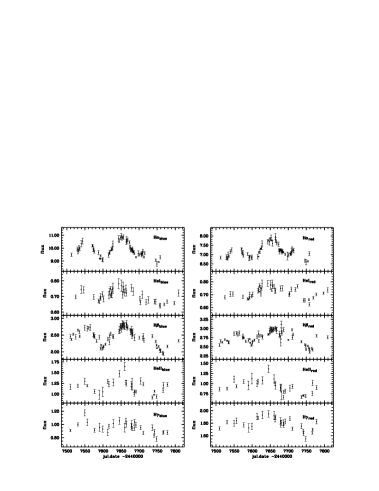
Light curves of the blue and red line wings of different emission lines in NGC 5548 are given in Figure 6. They differ with respect to each other and from line to line.
The observational results of the BLR are very complex. But one can make some general statements. The higher ionized line have broader line profiles, show larger variability amplitudes and origin closer to the central ionizing source in comparison to the lower ionized lines. However, the Fe ii lines in NGC 7603 show strong variations, too.
There are line profile variations on time scales of days. The emission line cores and wings vary differently. Line asymmetries are different from line to line and from outburst to outburst. There is a trend that the line profiles become more symmetric with increasing line flux. The cross correlation functions of the light curves of individual line segments with the continuum light curves showed that in some cases the outer line wings respond faster. But the response is different from line to line during the same outburst. Strong radial motions can be excluded to be dominant in the BLR. The BLR seems to be clumpy and to consist of a limited number of clouds or cloud complexes only. These clouds or the ionizing source might have a bidimensional structure.
Acknowledgments.
This work has been supported by Deutsche Agentur für Raumfahrtangelegenheiten (DARA) grant 50 OR 9408 9 and DFG grant Ko857/13.
References
Kollatschny, W. & Dietrich, M. 1996, A&A, 314, 43
Kollatschny, W. & Dietrich, M. 1997, A&A, 323, 5
Peterson, B. M. 1988, PASP, 100, 18
Peterson, B. M., et al. 1991, ApJ, 368, 119
Robinson, A. 1994, in ASP Conf. Ser. 69, “Reverberation Mapping of the Broad-Line Region in Active Galactic Nuclei”, ed. P. M. Gondhalekar, K. Horne, & B. M. Peterson (San Fransisco: ASP), 147
Discussion
Bill Welsh: Have you compared the r.m.s. and mean line profiles, especially with respect to the maximum width of the line (FWZI)?
Wolfram Kollatschny: In many cases (e.g. NGC 7603) the widths of the mean and r.m.s. profiles are identical. However, in other cases (He lines in NGC 5548) the widths are completely different.
Bill Welsh: Over such long time scales (20 years), do you still expect the NLR lines (e.g. [O iii]) to remain constant and therefore usable for internal self–calibration of the fluxes?
Wolfram Kollatschny: We verified on narrow band [O iii] images that the NLR is a point source. But we can not exclude that the NLR might be variable on the order of a few percent over a time scale of 20 years.
Brian Espey: For NGC 7603 you showed that there are substantial Fe ii intensity variations. What proportion of the H variability is due to variations in the underlying Fe ii multiplet strengths?
Wolfram Kollatschny: ¿From Figure 1 one can estimate that the blending due to Fe ii multiplets corresponds to 10–30 percent of the H intensity.