The Comptonized X-ray source X 1724308 in the globular cluster Terzan 2
Abstract
We report on the BeppoSAX observation of the X-ray source X 1724308 in the globular cluster Terzan 2. The broadband spectrum can be described as the superposition of a power–law with photon spectral index and a thermal component with typical temperature 1 keV. X 1724308 is detected in the PDS up to 150 keV with a S/N ratio 3, notwithstanding a sharp exponential cutoff with keV. The broadband spectrum can be best interpreted as due to the Comptonization of a Wien photon distribution with 1 keV by a spherically-symmetric hot plasma with electron temperature keV and optical depth . A comparison with the fainter and steeper state, which was observed by EXOSAT, suggests a correlation between the temperature of the Comptonizing electron distribution (or the plasma optical depth) and the X-ray intensity. The X–ray thermal component could originate from a boundary layer between the accretion disk and the compact object, or from the accretion disk itself.
Key Words.:
X-rays: stars – globular clusters: individual: Terzan 2 – stars: individual: X 1724308– stars: neutron – binaries: close – accretion: accretion discs1 Introduction
The globular cluster Terzan 2 has been known to contain a luminous X-ray source since the late 1970s. An X-ray burst from a region including the cluster was observed by OSO-8 (Swank et al. 1977), and the same mission detected persistent emission from a location consistent with the cluster. Uhuru (Forman et al. 1978) and Einstein High Resolution Imager (HRI, Grindlay et al. 1980) observations placed this source in the core of the cluster. The source is known either as X 1724308 (Parmar et al. 1989; hereafter P89) or 1E 1724305. It has a rather hard (photon index 2) power–law spectrum, with a 1–20 keV flux which varies by about a factor of 4 ( erg s-1 cm-2). Einstein data suggest that in a higher flux state ( erg cm-2 s-1) the source softens and the X-ray spectrum is better described by a 6 keV bremsstrahlung (Barret et al. 1998, in preparation).
Terzan 2 is a relatively dim globular cluster, with an estimated distance of 10 kpc and visual extinction , according to Djorgovski (1993). The scatter on the values reported in the literature for these quantities is however rather high ( and , respectively; see Ortolani et al. 1997 and references therein). The power–law intensity profile of its surface brightness and the relatively low core star density argue for a complex dynamical history (Djorgovski et al. 1986).
Terzan 2 is one of the two globular clusters from which X-ray emission was detected at energies 40 keV by Sigma (Barret et al. 1991). The Sigma source (GRS 1724308) was observed several times between 1991 and 1994 and appears to be variable (Goldwurm et al. 1994). The 1991 detections (at a total 6.8 confidence level) are consistent with a simple power–law spectrum with and a 38–200 keV flux of photons cm-2 s-1, corresponding to a poorly determined 1–20 keV flux of between 1.5 and erg cm-2 s-1. ROSAT HRI observations by Mereghetti et al. (1995) did not reveal any other X-ray sources within 35 from the cluster core, supporting the identification of GRS 1724308 with X 1724308. The existence of a population a low-luminosity (i.e.: a few erg s-1) sources in Terzan 2, similar to those discovered in the cores of 47 Tuc (Hasinger et al. 1994) or Cen (Johnston et al. 1994) cannot be excluded. The X–ray flux of these sources would be 3 orders of magnitude lower than that of X 1724308 and their existence therefore would not affect any of the conclusions in this paper.
Recent RXTE observations of X 1724308 (Olive et al. 1998) suggest that its timing properties are typical of an “atoll” source. The Power Spectrum Density (PSD) can be well modeled with the sum of two “shot noise” components, with shot decay timescales of 16 and 680 ms. A Quasi-Periodic Oscillation (QPO) feature at 0.8 Hz was also detected in the PSD. The claim of another QPO feature at Hz observed by the Medium Energy (ME) instrument on board EXOSAT (Belli et al. 1986) remains unconfirmed. The X-ray spectral hardness and the continuum properties of the PSD resemble those of some black hole candidates.
As part of the BeppoSAX Core Program, a number of X-ray luminous globular clusters are being observed. A discussion of the properties of the sample will be deferred to a forthcoming paper. Here, we report the results of the BeppoSAX observation of X 1724308 .
2 Observation and data Reduction
Results from all the co-aligned instruments on board BeppoSAX (Boella et al. 1997a) are presented: the Low-Energy Concentrator Spectrometer (LECS; 0.1–10 keV; Parmar et al. 1997), the Medium-Energy Concentrator Spectrometer (MECS; 1.3–10 keV; Boella et al. 1997b), the High Pressure Gas Scintillation proportional Counter (HPGSPC, 4–120 keV, Manzo et al. 1997) and the Phoswich Detection System (PDS; 15–300 keV; Frontera et al. 1997). The MECS consisted at the time of the X 1724308 observation of three identical grazing incidence telescopes with imaging gas scintillation proportional counters in their focal planes (now only two are operating). The LECS uses an identical concentrator system as the MECS, but utilizes an ultra-thin (1.25 m) entrance window and a driftless configuration to extend the low-energy response to 0.1 keV. The fields of view (FOV) of the LECS and MECS are circular with diameters of 37′ and 56′, respectively. The non-imaging PDS consists of four independent units arranged in pairs each having a separate collimator. Each collimator can be alternatively rocked on- and off-source to monitor the background counting rate. The hexagonal PDS FOV is 78′ full-width at half maximum. The HPGSPC was similarly operating in rocking mode, but only the “off-” position has been employed to monitor the background. Several pieces of evidence indicate that there are no significant contaminating sources present in the PDS FOV, both in the “on” and in the “off” positions: the “off” count rates are in good agreement with the long–term increasing trend of instrumental background studied by Guainazzi & Matteuzzi (1997); the “on” and “off” light curves show the same variability pattern (20% of count rates in the whole energy bandpass), which is due to the variation of the particle background around the orbit, thus excluding the presence of a strongly variable or transient unknown source and finally the PDS spectrum aligns very well with those from the other instruments (see Sect. 3). Similar arguments apply to the HPGSPC data.
The region of sky containing X 1724308 was observed by BeppoSAX between 1996 August 17 04:29:05 UT and August 18 05:05:11 UTC in an observation lasting 65 ks and spanning 12 orbital cycles. Good data were selected from intervals when the elevation angle above the Earth’s limb was and when the instrument configurations were nominal, using the SAXDAS 1.3.0 data analysis package (Lammers 1997; custom software has been used to reduce the HPGSPC data). Additionally, PDS data within 5 minutes after each South Atlantic Anomaly passage were excluded to avoid intervals were the gain was recovering to its nominal value following switch-on. This gives exposure times of 7.3 ks, 37.1 ks, 10.5 ks and 16.7 ks for the LECS, MECS, HPGSPC, and PDS, respectively. The standard PDS (HPGSPC) collimator rocking angle of 210′ (180′), and standard dwell time of 96 s for each on- and off-source position were used. The LECS was operated only during satellite night-time and was switched-off during the second half of the observation for technical reasons.
3 Data analysis
LECS and MECS data were extracted centered on the position of X 1724308 using radii of 8′ and 4′ respectively, corresponding to of the instrumental Point Spread Functions. Background subtraction in the imaging instruments was performed using standard files, but is not critical for such a bright source. Background subtraction in the HPGSPC and PDS was performed using data from the offset detectors. The background-subtracted count rates of X 1724308 are 3.2 s-1, 10.4 s-1, 11.2 s-1 and 6.1 s-1 in the LECS, MECS, HPGSPC, and PDS, respectively. Spectra have been rebinned so as to have at least 30 counts per energy channel and to sample the instrumental energy resolution with no more than 3 spectral channels, in order to ensure the applicability of fitting techniques. A systematic error of 1% has been added to each channel of the rebinned LECS and MECS spectra, to account for the residual systematic uncertainties in the detector calibration. Publicly available responses at 1997 September have been used, and spectral fits performed in the following energy ranges: 0.1–4 keV (LECS), 2.2–10.5 keV (MECS), 4–40 keV (HPGSPC), 15–200 keV (PDS). In the spectral fits, a normalization factor has been included to account for the well-known mismatch in the BeppoSAX instrument absolute flux calibration (Cusumano et al. 1998). The factors have been left completely free, except for the PDS to MECS one, which has been constrained to be in the 0.82-1.02 range (Cusumano et al. 1998). The values of the LECS to MECS and HPGSPC to MECS relative normalizations derived from the fit lie in the intervals 0.80–0.82 and 1.05–1.06, respectively. They are in good agreement with the values typically observed (0.7–1.0 and 0.8–1.05, respectively; cf. Grandi et al. 1997; Cusumano et al. 1998). Uncertainties are given at 90% confidence level for one interesting parameter, unless otherwise specified.
3.1 Timing analysis of the persistent emission
The source underwent a type I burst starting from 12825 s from the beginning of the observation, with an -folding time of s. In this paper we define the “persistent” emission excluding the data from the occurrence of the burst up to the end of the next orbit. The cut corresponds to 104 s of elapsed time. Fig. 1 shows light curves of the so defined persistent emission in the 1.5–10.5 keV (MECS), 0.1–1.5 keV (LECS)

and 13–200 keV (PDS) energy ranges. These energy ranges have been chosen in order to sample different spectral components (see Sect. 3.3). The of a constant fit for these light curves is 245 for 220 degrees of freedom (dof), 96.5/62 dof and 252/210 dof, respectively. At energies keV there is no evidence of variability, while the relatively high obtained from the light curves at energy 1.5 keV is mainly due to an intensity increase of about 15% between the pre–burst and the post–burst phases. However, we will in the following analyze the time–averaged spectra of all instruments. In Sect 3.4 we show that the induced systematic uncertainties are smaller that the statistical errors on the spectral parameters, even in the simplest parameterization.
3.2 The burst
A profile of the burst in the full MECS bandpass is shown in Fig. 2. The ratemeter CSELO (which registers

the total count rate above a low energy threshold) is used to preserve the continuity of the burst profile in the plot, since some of the event scientific packets at the peak of the burst were missing due to telemetry losses. The burst shows a typical exponential decay with e-folding time s. We have performed a spectral analysis of the burst in 7 contiguous time intervals (labeled as phases “A” to “G” in the following). The borders of the intervals are shown as dashed vertical lines in Fig. 2. The LECS and HPGSPC were switched off during most of the burst and PDS detection is generally too faint to allow time-resolved spectroscopy on these small time scales. Therefore, spectra of the MECS data only have been extracted, except for the phases “F” and “G”, when LECS data were available. The average persistent spectrum has been used as background. Since the persistent emission in the 2–10 keV band is constant on timescales 102 s within , time-resolved burst spectra were extracted under the condition that that 2–10 keV count rate was 20% of the persistent one. At lower count rates, the uncertainties on the true instantaneous level of the persistent emission make the determination of the spectral parameters meaningless. The spectra have been fitted with a simple blackbody emission, photoelectrically absorbed by a column density, , of neutral matter. All the parameters were allowed to vary, except the absorbing column density in the phase “C” spectral fit, which turned out to be unconstrained and was therefore fixed to the average of the best–fit values in phases “E” and “F” and “G”. Best–fit parameters and results are reported in Table 1.
| Phase | NH | kT | dof | ||||
|---|---|---|---|---|---|---|---|
| (s) | (s-1) | cm-2 | (keV) | (km) | ( erg s-1) | ||
| A | 2.8 | 4.6/9 | |||||
| B | 1.17 | 6.6/10 | |||||
| C | 0.79 | 1.2† | 5.5/8 | ||||
| D | 3.9 | 25/20 | |||||
| E | 31.7 | 41.2/40 | |||||
| F | 104.7 | 60.3/40 | |||||
| G | 401.9 | 65.9/65 |
†fixed
The blackbody temperature decreases along the burst profile, as typically observed in this kind of burst. The apparent blackbody radius (obtained assuming spherical geometry) is consistent with being the same in all phases within the statistical uncertainties, except for the first (“A”) and the latest (“F”) phases, for which the best-fit is km. While the value obtained in the former phase is likely to be strongly affected by the mixing of blackbodies with a rapidly changing distribution of temperatures during the sharp rise of the burst (and therefore probably unreliable), the latter could suggest a true decrease of the emitting region typical size with time; this suggestion is supported by the fact that the nominal best-fit value in phase “F” is indeed lower than between phases “B” to “E”. However, better statistical quality of the data is required to confirm such a conclusion. The weighted average of the is km ( km if only phases between “B” and “F” are considered). The peak flux is erg cm-2 s-1, corresponding to a luminosity erg s-1. The simple parameterization adopted yields an adequate fit for all spectra.
3.3 Spectral analysis of the persistent emission
We performed the spectral analysis of the persistent emission in several steps. First LECS/MECS and HPGSPC/PDS spectra were fitted separately with purely phenomenological models. The spectra of all detectors were then fitted simultaneously, assuming different physical scenarios.
A single component model with absorption provides a rather poor description of the LECS/MECS spectrum. Power–law, bremsstrahlung and blackbody spectral models were tried. All of these give large excesses above the extrapolations of the high-energy data at 1 keV (see Fig. 3).

A two–component model is needed to account for the observed spectrum (see Table 2).
| Model | NH | or kTbrems | Tbrems or Tbb or Ebreak | dof |
|---|---|---|---|---|
| ( cm-2) | (keV) | (keV) | ||
wa*po |
… | 303.4/76 | ||
wa*bknpo |
108.4/74 | |||
wa*(po+bb) |
89.5/74 | |||
wa*(po+brems) |
101.6/74 | |||
wa*brems |
… | 123.5/76 | ||
wa*(brems+bb) |
104.0/74 |
Formally, the best combination is a relatively flat () power-law + a blackbody with keV. Other combinations yield a null hypothesis likelihood .
X 1724308 is detected in the PDS up to keV. One–component models give similarly poor descriptions of the HPGSPC and PDS spectra (see Table 3).
| Model | kTbr | Ecutoff | dof | |
|---|---|---|---|---|
| (keV) | (keV) | |||
po |
… | … | 266.6/131 | |
brems |
… | … | 667.6/131 | |
cutoffpl |
… | 137.6/130 | ||
po+brems |
… | 171.7/129 |
There is strong evidence of a sharp roll over of the PDS spectrum above keV (see Fig. 4). The inclusion

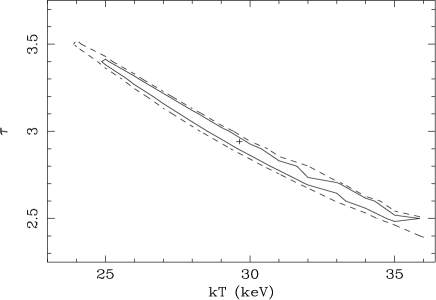
of a cutoff in the power–law model significantly improves the quality of the fit (, ), yielding best-fit parameters of and keV. There is evidence in the HPGSPC data that the spectral index undergoes a smooth increase with energy (see Fig. 5)

from at 5 keV to at 30 keV.
3.3.1 Comparing physical scenarios
Three spectral region can be phenomenologically recognized in the X 1724308 broad-band BeppoSAX spectrum: an intermediate-hard (i.e.: 1.5–50 keV) power–law “emission core”, with spectral index (probably gently steepening with energy); a sharp cutoff above keV and a soft excess at energies below keV.
The models proposed so far to explain the X-ray emission from low-mass X-ray binaries (LMXRB) can be categorized in two main classes. The first one (originally proposed by Mitsuda et al. 1984) postulates the superposition of a multicolor blackbody emission from the inner region of an accretion disk (typical effective temperature 1 keV) and of a simple blackbody originating on the surface of the neutron star (2 keV). Another class invokes unsaturated Comptonization of low-energy photons (White et al. 1985, 1986), possibly coupled with a blackbody (White et al. 1988). It has been recently suggested that these models characterize different luminosity states in LMXRB (see e.g. Tanaka 1995), the former prevailing for erg s-1. Actually, the double blackbody scenario is ruled out by the present data, at least in its simplest form. The fit with such a model yields a very poor (); the proposed model does not produce enough flux at high energy to account for the relative hardness of the observed spectrum.
We have tested the viability of the Comptonization scenario
with the xspec model compTT (Titarchuk 1994;
Hua & Titarchuk 1995; Titarchuk & Lyubarskij 1995),
which calculates self-consistently the spectrum produced
by the Comptonization of soft photons in a hot plasma. This model
contains as free parameters the temperature of the Comptonized
electrons Te, the plasma optical depth and the input
temperature of the soft photon (Wien) distribution TW.
Both a disk and a spherical geometry
for the Comptonizing plasma were tried. Again, a soft excess
remains around keV if compTT alone is applied. We
have tried to model this excess either with a single temperature
or with a multi temperature blackbody, for each of the two plasma geometries.
The soft excess cannot instead be modeled with a Gaussian line, even if
its intrinsic width is allowed to be broad.
The results are summarized in Table 4.
| # | Model | NH | kTe | y | kTW | RW | kTse | R | /dof | |
|---|---|---|---|---|---|---|---|---|---|---|
| (1022 cm-2) | (keV) | (keV) | (km) | (keV) | (km) | |||||
| 1 |
wa*(compTT(d))
|
0.4 | 350 | … | … | 518.6/203 | ||||
| 2 |
wa*(compTT(d)+bb)
|
0.3 | 7.9 | 199.1/201 | ||||||
| 3 |
wa*(compTT(d)+diskbb)
|
0.4 | 1.8 | † | 194.4/201 | |||||
| 4 |
wa*(compTT(s))
|
2.5 | 15 | … | … | 337.6/203 | ||||
| 5 |
wa*(compTT(s)+bb)
|
2.0 | 8.3 | 198.5/201 | ||||||
| 6 |
wa*(compTT(s)+diskbb)
|
2.3 | 2.1 | † | 194.9/201 |
†, where is the inclination angle and is the inner radius of the disk
The above scenarios cannot be discriminated on purely statistical grounds, since the values of are all very close to one. The Comptonized plasma is characterized by an electron temperature 25–35 keV (90% confidence level for two interesting parameters, see Fig. 6) and a geometry-independent parameters , which
expresses the probability of photon scattering through the exponential factor (Titarchuk 1994). The other fit parameters are slightly dependent on the assumed model used to describe the soft X-ray excess, typical values being N (1.1) cm-2, kT (2) keV, kT (1.5) keV and R (3) km, when it is described with a single- (multi-) temperature blackbody. The best-fit model #5 in Table 4 superposed to the observed spectra is shown in Fig. 7. It corresponds


to the following fluxes: erg cm-2 s-1 (2–10 keV), erg cm-2 s-1 (1–20 keV), erg cm-2 s-1 (38–200 keV), erg cm-2 s-1 (0.1–200 keV), the last one corresponding to an unabsorbed X-ray luminosity L erg s-1 for a distance of 10 kpc (Djorgovski 1993). Given such a continuum, the 90% upper limit on the equivalent width of a narrow line at 6.7 keV is 17 eV.
However, it must be noted that the broadband spectrum can be formally accounted by a suitable combination of three thermal models, as shown in Table 5. A bremsstrahlung with temperature T keV is required to fit the PDS hard tail, a 0.8–1 keV blackbody can account for the soft excess, while a keV
| # | Model | NH | kT1 | Rbb | kT2 | kT3 | /dof |
|---|---|---|---|---|---|---|---|
| ( cm-2) | (keV) | (km) | (keV) | (keV) | |||
| 7 | wa*(bb+bb+brems) |
212.3/201 | |||||
| 8 | wa*(bb+brems+brems) |
202.2/201 |
blackbody or a keV bremsstrahlung are needed to fill the gap between the two “extreme” spectral components. In both cases, the is as good as for the Comptonization models.
3.3.2 The soft X-ray variability
After the burst, the 0.1–1.5 keV flux increased by . LECS and MECS spectra corresponding to these intervals were extracted and analyzed with the same model (model #5 in Table 4 with kT keV and ), in order to investigate if there is any significant spectral variability associated with this flux change. The best–fit parameters are summarized in Table 6. The for the combined fit is acceptable
| Temporal phase | NH | kTW | kTbb | |
|---|---|---|---|---|
| (1022 cm-2) | (keV) | (keV) | () | |
| Before the burst | ||||
| After the burst |
(). All the best-fit parameters are mutually consistent between the two intervals. We conclude that the systematic uncertainties introduced by mixing models with different normalizations are well below the statistical uncertainties, given the quality of the current data.
4 Discussion
We report on the first X-ray broadband spectrum of the burster X1724-308 in the whole 0.1–100 keV domain. The source is detected with a S/N up to 150 keV, confirming the previous Sigma/GRANAT results (Barret et al. 1991). The superior combination of broadband coverage, sensitivity and energy resolution has however allowed an unprecedentedly detailed spectral deconvolution, albeit formally not unique. Qualitatively the spectrum can be described as the composition of a “core”, power–law emission, which undergoes a significant steepening at E keV, and a soft excess above the extrapolation of the higher energy X-ray spectrum. The 20–200 keV flux is erg cm-2 s-1. The corresponding luminosity at 10 kpc is erg s-1, which is typical of X-ray bursters (van Paradijs & van der Klis 1994; Barret et al. 1996).
Formally, the spectrum can be described by a suitable combination of three thermal models (models #7 and #8 in Table 5). The characterizing feature of these models is the need for a very high temperature thermal bremsstrahlung (T keV) to account for the highest energy PDS data points and cut-off roll over. The presence of such a component had already been invoked to explain the hard tail observed in several X-ray bursters (Churazov et al. 1995). The luminosity inferred by the BeppoSAX observation is L erg s-1, which implies an emission measure cm3; the optically thin requirement leads to a size of a single uniform emitting cloud cm. Such a large region is unlikely to be directly powered by the neutron star.
The high-energy tail rules out the “double-blackbody” model (multi-temperature disk + neutron star surface), which had originally proposed by Mitsuda et al. (1984) to explain the X-ray emission of LMXRB. If a transition from a thermal- to a Comptonization-dominated hard X-ray spectrum is present in X 1724308 (as generally believed for LMXRB), it occurs at luminosity a few erg s-1.
Models of the BeppoSAX spectrum of X 1724308 which involve a Comptonized component appear therefore more plausible. A plasma with kT27–30 keV and is required. A disk and a spherical geometry of the Comptonizing region fit the data comparably well. We note however, that somewhat higher values of the Comptonization parameter (2.0–2.3) are obtained for a spherical geometry. Similar Comptonized spectral components have been observed in a variety of neutron star LMXRBs, although in most cases the spectra are substantially softer and the inferred electron temperatures in the 2–4 keV range (White et al. 1988). In a few Atoll sources, however, X-ray spectra extending up to 100 keV or more have been revealed through Sigma/GRANAT (Mandrou et al. 1994) and BeppoSAX (Church et al. 1998b) observations. These spectra have a clear resemblance to the spectrum of X 1724308 discussed here, and require comparably high electron temperatures. It has also to be considered that hard tails extending to hundreds of keV are no longer believed to be exclusive to black hole candidates, at least when the LMXRB luminosity does not exceeds erg s-1 (Barret et al. 1994; van Paradijs & van der Klis 1994).
In the Beppo-SAX observation of X 1724308 an additional soft spectral component is needed to fit the low energy spectrum. However, the quality of the data does not allow different models for this component to be discriminated. We find that a multi-temperature blackbody disk model, or a simple blackbody spectrum provide acceptable fits.
In the case of a multi-temperature blackbody disk model, both the derived temperature (2 keV) and radius of the innermost disk region ( km) are close to those obtained for the “seed” Wien spectrum for the Comptonized component (see e.g. the model #6 in Table 5). An inclination angle of would be required for the inner radius of the disk to accommodate a neutron star. On the contrary the absence of a sizeable orbital modulation of the X-ray flux (absorption dips in particular) suggests a substantially lower inclination (P89; Olive et al. 1998).
If the soft thermal emission of Terzan 2 is interpreted in terms of a single temperature blackbody, the inferred linear size of the emitting region ( km) is in good agreement with a typical neutron star and with the size inferred from the analysis of the type I burst occurred during the BeppoSAX observation. It is worth emphasizing the (single) blackbody temperature of Terzan 2 (kT keV) is a factor of 2-3 lower than that derived from most other neutron LMXRBs (cf. White et al. 1988). In the single temperature blackbody scenario, the parameters also are close to those derived for the input spectrum to the Comptonized component, such that the neutron stellar surface might represent the source of “seed” photons. Alternatively, the analogy with the hard spectra of black hole candidates (where, of course, there is no star surface or boundary layer) suggest that even in disks around accreting neutron stars there is a hot Comptonizing plasma that coexists with a dense cold phase responsible for the generation of the “seed” photons (cf. Eardley & Lightman 1975; Galeev et al. 1979; Molendi & Maraschi 1990).
The two spectral decompositions discussed above differ a great deal in the physical interpretation of the two spectral components. In the former case the Comptonized hard component originates from the boundary layer close to the neutron star surface, whereas the soft component is produced by the sum of blackbody spectra emitted by the accretion disk. In the latter case the (single) blackbody spectrum likely arises from the boundary layer close to the neutron star surface, while the accretion disk gives rise to the Comptonized spectrum. Simple accretion disk theory predicts that, unless the neutron star is rotating very close to its break up velocity, the ratio of the accretion luminosity released in the disk to that released in the boundary layer should be equal to 1. Sunyaev & Shakura (1986) show that this ratio can be as low as if the accretion disk ends at the marginally stable orbit and this, in turn, is larger then the neutron star radius. Recent observations of fast quasi periodic oscillations, QPOs, in LMXRBs testify that the neutron stars contained in them rotate much slower than break up (periods in the 3 ms range), and that the inner radius of the accretion disk (as inferred from the frequency of the higher kHz QPO power spectrum peak) is often larger than the marginally stable orbit. This would further decrease the predicted ratio of disk and boundary layer luminosity. The 0.1–100 keV luminosities of the disk (multi-) blackbody component and the (boundary layer) Comptonized component inferred from the BeppoSAX spectrum of Terzan 2 are erg s-1 and erg s-1. The derived ratio of 0.55 is in agreement with the predictions above. However, observations of dips in several X-ray can be convincingly explained if the Comptonized component is extended (Church & Balucińska-Church 1995; Church et al. 1998a), almost at odds with the former interpretation.
In the latter interpretation the ratio of the luminosity of the Comptonized (disk) spectrum ( erg s-1) and the luminosity of the (boundary layer) single temperature blackbody ( erg s-1) is , i.e. much higher then expected. An anomalously high ratio of the two components has also been found in a number of other neutron star LMXRBs (see White et al. 1988). Obscuration by an inner accretion corona or a thickened disk could decrease the relative strength of the boundary layer contribution (Lamb 1986; van der Klis et al. 1987). In the standard Shakura-Sunyaev disk, the inner radiation pressure-dominated disk can be as thick as few tens of kilometers, and the effect of thermal and/or secular instabilities can further enlarge it (Shakura & Sunyaev 1973; Pringle 1981). Radiation from the boundary layer might be partly scattered out of the polar channel or attenuated through a not completely optically-thick disk. A “bloated-disk” geometry has already been proposed to explain the low frequency QPOs observed in several LMXRBs (e.g.: 4U1820-30, Stella et al. 1987), and would be in line with the likely low inclination of the system, as inferred from the lack of significant intensity eclipses. Alternatively, exchange of energy between the magnetosphere and the accretion disk via material torque from the accretion matter could reduce the luminosity available at the surface of a neutron star, spinning at a rate close to the inner disk Keplerian frequency (Priedhorsky 1986).
The optical reddening is (Djorgovski 1993). If we convert the visual absorption in an X-ray absorbing column density with N AV cm-2 (Predehl & Schmitt 1995), the corresponding column density is roughly consistent with the Galactic one along the line of sight to Terzan 2 (N cm-2, Dickey & Lockman 1990). However, the BeppoSAX observation requires a 20-75% excess absorption (depending on the spectral descriptions), in agreement with previous estimates, although rather poorly constrained and model dependent (P89; Mereghetti et al. 1995; Verbunt et al. 1995).
EXOSAT observed X 1724308 in a factor 5 fainter and in a much softer state than BeppoSAX. This is shown in Fig. 8, where the photon spectra observed by BeppoSAX
and EXOSAT are compared. The hardness difference can be parameterized as a between the observed power law photon indices. If the electron temperature remains the same, and therefore a 50% smaller (Hua & Titarchuk 1995) at the EXOSAT epoch is implied (we note however that in this regime the analytical approximations on which the Comptonization Monte-Carlo simulation by Titarchuk (1994) are no longer valid and therefore the condition that Te and determines univocally the spectral index is not fulfilled, Hua & Titarchuk 1995). Alternatively, a steeper spectrum could imply a lower kTe and therefore a spectral cut-off at lower energy. To check this possibility, we extracted from the public archive and re-analyzed the EXOSAT ME spectrum of P89. A simple absorbed power–law model gives a reasonable fit ( dof), with best-fit parameters as in P89. However, the inclusion of a cut-off results in a reduction in of 8 which is significant at 98.9% confidence. The best-fit parameters are then N cm-2 (very similar to the BeppoSAX value in model #6 here), and E keV. We caution that this cut-off energy is very close to the upper energy range of the ME detector. If the EXOSAT result is correct, then an explanation of the difference in the two spectra may be a factor lower electron temperature during the EXOSAT epoch. In such a scenario the energy of the electrons is physically linked with the high-energy intensity.
Acknowledgements.
The authors acknowledge useful suggestions from D. Barret. The referee’s comments have allowed us to enlarge and deepen the analytical and interpretative approach of this paper. The BeppoSAX satellite is a joint Italian–Dutch program. MG and TO acknowledge the receipt of an ESA Research Fellowship. LS acknowledges the receipt of an ASI grant.References
- (1) Barret D., Mereghetti S., Roques J.P., et al., 1991, ApJ 379, L21
- (2) Barret D., Vedrenne G., 1994, ApJSS 92, 505
- (3) Barret D., McClintock J.E., Grindlay J.E., 1996, ApJ 473, 963
- (4) Belli B.M., D’Antona F., Molteni D., Morini M., 1986, IAU Circ. 4174
- (5) Boella G., Perola G.C., Scarsi L., 1997a, A&AS 122, 299
- (6) Boella G., Chiappetti L., Conti G., et al., 1997b, A&AS 122, 372
- (7) Church M.J., Balucińska-Church M., 1995, A&A 300, 441
- (8) Church M.J., Balucińska-Church M., Dotani T., Asai K., 1998a, ApJ, in press (available at astroph/9805043)
- (9) Church M.J., Parmar A.N., Balucińska-Church M., et al., 1998b, A&A, in press (available at astroph/9806223)
- (10) Churazov E., Gilfanov M., Sunyaev R., 1995, ApJ 443, 341
- (11) Cusumano G., Mineo T., Guainazzi M., et al., 1998, A&A, submitted
- (12) Dickey J.M., Lockman F.J., 1990, ARA&A 28, 215
- (13) Djorgovski S., 1986, in “Instrumentation and Research Programmes for Small telescopes”, IAU Symp. no. 118, Hearnshaw J.B. & Cottrel P.L. eds (Dordrecht:Reidel), p.281
- (14) Djorgovski S., 1993, in “Structure and Dynamics of the Globular Clusters”, Djorgovski S. & Meylan C. eds. (S.Francisco:ASP), pag. 373
- (15) Eardley D.M., Lightman A.P., 1975, ApJ 200, 187
- (16) Forman W., Jones C., Cominsky L., et al., 1978, ApJS 38, 357
- (17) Frontera F., Costa E., Dal Fiume D., et al., 1997, A&AS 122, 357
- (18) Galeev A.A., Rosner R., Vaiana G.S., 1979, ApJ 229, 318
- (19) Goldwurm A., Cordier B., Paul J., et al., 1994, in the API Conference Proceedings n.304, “The Second Compton Symposium”, eds. Fichtel C.E., Gehrels N., Norris J.P. (New York:AIP), p.421
- (20) Grandi P., Guainazzi M., Mineo T., et al., 1997, A&A 325, 17
- (21) Grindlay J.E., Marshall H.L., Hertz P., 1980, ApJ 240, L21
- (22) Guainazzi M., Matteuzzi A., 1997, BeppoSAX SDC technical Report TR-011
- (23) Hasinger G., Johnston H.M., Verbunt F., 1994, A&A 288, 466
- (24) Hua X.-M., Titarchuk L., 1995, ApJ 449, 188
- (25) Johnston H.M., Verbunt F., Hasinger G., 1994, A&A 289, 763
- (26) Lammers U., 1997, The SAX/LECS Data Analysis System Software User Manual, ESA/SSD, SAX/LEDA/0010
- (27) Lamb F.K., 1986, in “The Evolution of X-Ray Binaries”, Trümper J., Lewin W.H.G. & Brinkmann W. eds. (Dordrecht:Reidel), pag. 151
- (28) Mandrou P., Roques J.P., Bouchet L., et al., 1994, ApJS 92, 343
- (29) Manzo G., Giarrusso S., Santangelo A., 1997, A&AS 122, 341
- (30) Mereghetti S., Barret D., Stella L. et al., 1995, A&A 302, 713
- (31) Mitsuda K., Inoue H., Koyama K., et al., 1984, PASJ 36, 741
- (32) Molendi S., Maraschi L., 1990, ApJ 353, 452
- (33) Olive J.F., Barret D., Boirin L., et al., 1998, A&A 333, 942
- (34) Ortolani S., Bica E., Barbuy B., 1997, A&A 326, 614
- (35) Parmar A.N., Martin D.D.E., Bavdaz M., et al., 1997, A&AS 122, 309
- (36) Parmar A.N., Stella L., Giommi P., 1989, A&A 222, 96 (P89)
- (37) Predehl P., Schmitt J.H.M.M., 1995, A&A 293, 889
- (38) Priedhorsky W, 1986, ApJ 306, L97
- (39) Pringle J.E., 1981, ARA&A 19, 137
- (40) Shakura N.I., Sunyaev R.A., 1973, A&A 24, 337
- (41) Titarchuk L., Lyubarskij Y., 1995, ApJ 450, 876
- (42) Verbunt F., Bunk W., Hasinger G., Johnston H.M., 1995, A&A 300, 732
- (43) van der Klis M., Stella L., White N., Jansen F., Parmar A.N., 1987, ApJ 316, 411
- (44) van Paradijs J., van der Klis M., 1994, A&A 281, 17
- (45) White N.E., Peacock A., Taylor B.G., 1985, ApJ 296, 475
- (46) White N.E., Peacock A., Hasinger G., et al., 1986, MNRAS 218, 129
- (47) White N.E., Stella L., Parmar A.N., 1988, ApJ 324, 363