Populations of WC and WN stars in Wolf-Rayet galaxies ††thanks: Based on observations obtained at the European Southern Observatory (ESO), Chile
Abstract
We report the detection of WC stars in five Wolf-Rayet (W-R) galaxies: He 2-10, NGC 3049, NGC 3125, NGC 5253 and Tol 89. The faint broad C iv 5808 line requires sufficiently high S/N ( 40) to be detected explaining the non-detection of this WC feature in previous observations. From the measurement of W-R emission lines (N iii 4640+C iii 4650, He ii 4686, and C iv 5808), we conclude that all W-R regions contain a mixed population of WNL, and early WC stars. The exception is the high-metallicity region NGC 3049 where late WC stars prevail.
A spatial offset between the multiple peaks of the nebular emission and the stellar light in He 2-10 and Tol 89 is observed. These nebular emission structures are likely due to the existence of bubbles and loops, owing to the injection of mechanical energy in the ISM through the W-R winds and/or supernovae. Due to age differences and likely smaller energy deposition the structures around the W-R regions are possibly smaller than the ones predominantly energized by SNe. The spatial distribution of W-R stars closely follows the stellar continuum with no significant distinction between WN and WC stars.
From the luminosity of the W-R signatures we have estimated the absolute number of W-R stars of the different subtypes. The WC/WN number ratios have typical values between 0.2 – 0.4, and show no clear trend with metallicity. For low-metallicity objects ( Z⊙), these values are larger than the observed WC/WN ratios in Local Group objects, but are compatible with expectations for star forming events with short duration if stellar evolution models with high mass loss are used.
We derive ages for the starburst regions in the range of 3 to 6 Myr and confirm that the burst duration must not exceed 2–4 Myr to account for the high population of W-R stars observed in starburst regions, even if emission line stars similar to those observed in R136 and NGC 3603 are common in starbursts. Within the uncertainties the majority of the observed quantities is reasonably reproduced by models with a Salpeter IMF. Although some W-R lines in few regions are stronger than predicted by the models no clear case requiring a significantly flatter IMF is found. IMF slopes much steeper than Salpeter may, however, not be compatible with our data.
Key Words.:
galaxies: individual: He 2-10; NGC 3049; NGC 3125; NGC 5253; Tol 89 – galaxies: starburst – galaxies: stellar content – Hii regions – stars: Wolf-Rayet1 Introduction
Starbursts play a major role in the global process of galaxy formation and evolution. However, despite two decades of intense research on starburst galaxies, our present knowledge of the intrinsic starburst properties is still rather poor and fundamental questions remain to be answered. For example, what is the duration of starbursts ? Which type of stellar population is formed during these events ? Is the proportion of massive stars higher in starbursts than in more “quiet” star-forming regions? Observationaly, answering these questions is not an easy task. In this respect the so-called “Wolf-Rayet (W-R) galaxies” may be the ideal laboratories since these objects harbour the most massive stars known, O stars and their descendents W-R stars, which allow to probe the upper part of the initial mass function (IMF) and the youngest stellar populations.
W-R galaxies are usually defined as “those galaxies in whose integrated spectra a broad emission feature at He ii 4686 attributed to W-R stars has been detected” Conti (1991). In practice, the detection of a broad emission feature at (the so-called “W-R bump”, which possibly includes additional emission lines, cf. below) attributed to W-R stars is often simply used.
Whereas the initial compilation of Conti Conti (1991) includes 37 galaxies, to date at least 100 such objects are known (see the compilation of Schaerer & Contini, 1998). W-R galaxies are found among emission-line galaxies. However, the class of W-R galaxies encompasses a wide range of properties and galaxy types. While most of them fall in the category of Hii galaxies, broad W-R emission lines have also been detected in more “exotic” objects like Luminous Infrared Galaxies (Armus et al., 1988), Seyfert 2 galaxies (e.g. Heckman et al., 1997) and giant cD galaxies, located in the centre of galaxy clusters with strong cooling flows Allen (1995).
The mere presence of W-R stars in these objects indicates recent ( Myr) star formation and the existence of massive stars ( M⊙, cf. Maeder & Conti, 1994); this provides already interesting information about star formation in these objects. Quantitative analysis of the He ii 4686 emission or the W-R bump show that star formation must have occurred over short timescales compared to the lifetime of massive stars Kunth & Sargent (1981); Arnault et al. (1989); Vacca & Conti (1992); Meynet (1995), and have allowed to derive the absolute number of W-R stars present in these regions (, e.g. Vacca & Conti 1992, hereafter VC92).
This blue W-R bump is often blended with nearby nebular emission lines of He, Fe, or Ar, and can show several broad stellar emission components (N iii 4640, C iii 4650, He ii 4686) difficult to separate in most low or medium-resolution spectra. Their origin can a priori be due to W-R stars of WN and/or WC subtypes, which has been a question of some earlier dispute (cf. Osterbrock & Cohen, 1982; Sargent & Filippenko, 1991; with Kunth & Schild, 1986; Conti, 1991).
The strongest emission line of WC stars is C iv 5808 which is very weak in WN stars. This “red W-R bump” has quite rarely been observed so far. Although Conti Conti (1991) claimed the absence of convincing evidence for carbon features in W-R galaxies (cf. also Kunth & Schild, 1986) there is no doubt about their existence anymore (e.g. NGC 4861: Dinerstein & Shields, 1986; NGC 4214: Sargent & Fillipenko, 1991, Kobulniky & Skillman, 1996; NGC 2363: Gonzalez-Delgado et al., 1994; Mrk 996: Thuan, Izotov & Lipovetsky, 1996; Mrk 475, Mrk 1450: Izotov et al., 1994; NGC 7714: Garcia-Vargas et al., 1997; I Zw 18: Izotov et al., 1997, Legrand et al., 1997b). Where the data is available, C iv 5808 is generally weaker than He ii 4686. In our recent compilation Schaerer & Contini (1998) we find 15 objects with a fairly well established detection of broad C iv 5808.
The presence of WC stars, although possibly less numerous than WN stars, is indeed expected both from observations of W-R populations in the Local Group (e.g. Massey & Johnson, 1998) and from stellar evolution models Maeder & Meynet (1994). The predictions are that, depending on the evolutionary model and metallicity, % of young starburst should show an important WC population (Meynet, 1995; Schaerer & Vacca, 1998; hereafter SV98). Most surprisingly the homogenenuous, fairly high signal-to-noise spectra from the sample of VC92 containing 12 regions with He ii 4686 detections (and 10 upper limits) revealed only one C iv 5808 detection (in He 2-10 A). If true, this would certainly contradict the predictions from synthesis models (Meynet, 1995; SV98) using high mass loss stellar evolution models, which otherwise compare well to observations in the Local Group Maeder & Meynet (1994).
To verify if this apparent discrepancy really holds we have initiated a search for WC stars in well-known W-R galaxies. We observed five objects (NGC 3049, He 2-10, NGC 3125, NGC 5253, Tol 89), three of them are in common with VC92. A first account of our observations of NGC 5253 was given in Schaerer et al. Schaerer et al. (1997).
In the present paper we report the successful discovery of both WN and WC stars in all of the objects, which supports our initial hypothesis of an observational bias (i.e. a too low signal-to-noise ratio around 5800 Å) against their detection in the VC92 sample, and (at least partly) relieves the aforementioned discrepancy. We then use both the WN and WC signatures to constrain the burst properties and stellar evolution models.
The paper is structured as follows. The observations and reductions are described in Sect. 2. A spatial analysis of the emission lines is shown in Sect. 3. We describe the properties of the W-R regions and their massive star content in Sect. 4. Constraints on the evolutionary tracks and the properties of the starburst regions (age, burst duration, IMF) are derived in Sect. 5 from a comparison with evolutionary synthesis models. Finally, our main results are summarised and discussed in Sect. 6.
| Galaxy | Coordinates (J2000) | Type | E(B-V) | Exposure time | P.A. | Scale | |||||
| [mag] | [mag] | [km s-1] | [Mpc] | [mag] | [min] | [°] | [pc/″] | ||||
| He 2-10 | 08h 36m 160 | 26°24′40″ | I0 Pec | 12.5 | 0.21 | 87310 | 8.8 | -17.3 | 80 (420) | 94 | 43 |
| NGC 3049 | 09h 54m 499 | 09°16′19″ | SB(rs)ab | 13.0 | 0.04 | 14944 | 18.3 | -18.3 | 80 (420) | 35 | 89 |
| NGC 3125 | 10h 06m 344 | 29°56′10″ | E? | 13.3 | 0.25 | 108047 | 11.5 | -17.0 | 100 (520) | 123 | 56 |
| NGC 5253 | 13h 39m 558 | 31°38′41″ | E/S0? | 11.1 | 0.05 | 4044 | 4.1 | -17.2 | 90 (420 + 10) | 24 | 19 |
| Tol 89 | 14h 01m 254 | 33°04′28″ | GHii in SBdm | 16.0 | 0.23 | 122611 | 14.7 | -14.8 | 120 (620) | 39 | 71 |
| Global parameters come from RC3 except for the heliocentric radial velocity () of He 2-10 which comes from Kobulnicky et al. Kobulnicky et al. (1995). The Galactic foreground extinction E(B-V) comes from Burstein & Heiles Burstein & Heiles (1984). The distance () is derived from the Galactic Standard of Rest (GSR) velocity, using a Hubble constant km s-1 Mpc-1, except for the distance of NGC 5253 taken from Saha et al. (1995). The absolute blue magnitude () is derived from the apparent magnitude () and the adopted distance (). The position angle (P.A.) of the slit is measured from North to East. The linear scale (in pc/″) is computed using the adopted distance adopted distance () | |||||||||||
2 Observations and data reduction
Long-slit spectra of galaxies were obtained on the nights of 1995 April 24 – 26 at the ESO 2.2m telescope. The data were acquired with the EFOSC2 spectrograph and a 1024 1024 Thomson CCD with a pixel size of 0.34″. We used grism 4 which gives a spectral coverage of 4400 – 6500 Å with a resolution of 5 Å. During the nights, we also observed the spectrophotometric standard stars HD 84937 and Kopff 27 in order to flux calibrate the spectra of the galaxies. Note that only the first night was photometric. Spectra of He-Ar calibration lamp were obtained immediately before and after the galaxy integrations in order to accurately calibrate the wavelength scale.
The slit was oriented in order to cover regions with previous detections of W-R stars and others bright optical regions in galaxies. The slit width was 1.6″ for the galaxy observations and 5″ for the standard stars. The total integration time for each galaxy is given in Table 1. We took multiple exposures of 1200 s in duration, short enough to avoid saturation of the bright nebular lines ( and [O iii]) and to recognize cosmic ray impacts. The seeing was relatively stable during the observations with a mean spatial resolution of about 1″, as measured by the La Silla seeing monitor. The spectra were acquired at low airmass ( 1.1, except for NGC 3049 observed with an airmass 1.3) and no correction for the loss of blue light due to atmospheric dispersion was made.
The spectra were reduced according to standard reduction procedures using the MIDAS package LONG. A bias level was subtracted from each frame using the overscan region of the CCD chip. A combination of flat field images from the twilight sky and a continuum quartz lamp were divided into each frame to correct for pixel to pixel variations along spatial and dispersion axes respectively. After wavelength calibration, transformation to equal wavelength intervals along the dispersion axis and flux calibration using standard stars observations, spectra from the same galaxy were combined to average frames and reject cosmic ray events. Care was taken to discriminate between cosmic rays and the high peaks of strong emission lines which might also be confused with cosmic ray events. Tracking with the autoguider was sufficiently good that no shifting or registration of the frames was required prior to the combine procedure. Emission-lines from the night sky were then subtracted using a linear fit to at least 50 “sky” pixels on either side of the galaxy.
3 Detailed spatial analysis
We first use our long-slit spectroscopic observations to compare, for each galaxy, the spatial distributions of nebular and W-R emission-line intensities and the stellar continuum emission. For this purpose, we extracted one-dimensional spectra along the slit by adding 3 pixels to match the seeing of our observations ( 1″). We choose one pixel of overlap between two adjacent spectra to maximize signal-to-noise ratio while still maintaining a good spatial resolution. Depending on the spatial extent we performed between 80 and 180 extractions per galaxy, such that the brightest emission-lines ( and [O iii] 5007) were strong enough to be measured with reliability.
We then measured, for each individual spectrum, the parameters (central wavelength, FWHM, flux and equivalent width) of the brightest nebular emission lines (He i 4471, , [O iii] 4959, [O iii] 5007, He i 5876 and [O i] 6300), the broad emission lines due to W-R stars (blue W-R bump: blend of N iii 4640 and C iii 4650, He ii 4686; red W-R bump: C iv 5808) together with the continuum flux under each emission line.
3.1 Variations of emission line and continuum intensities
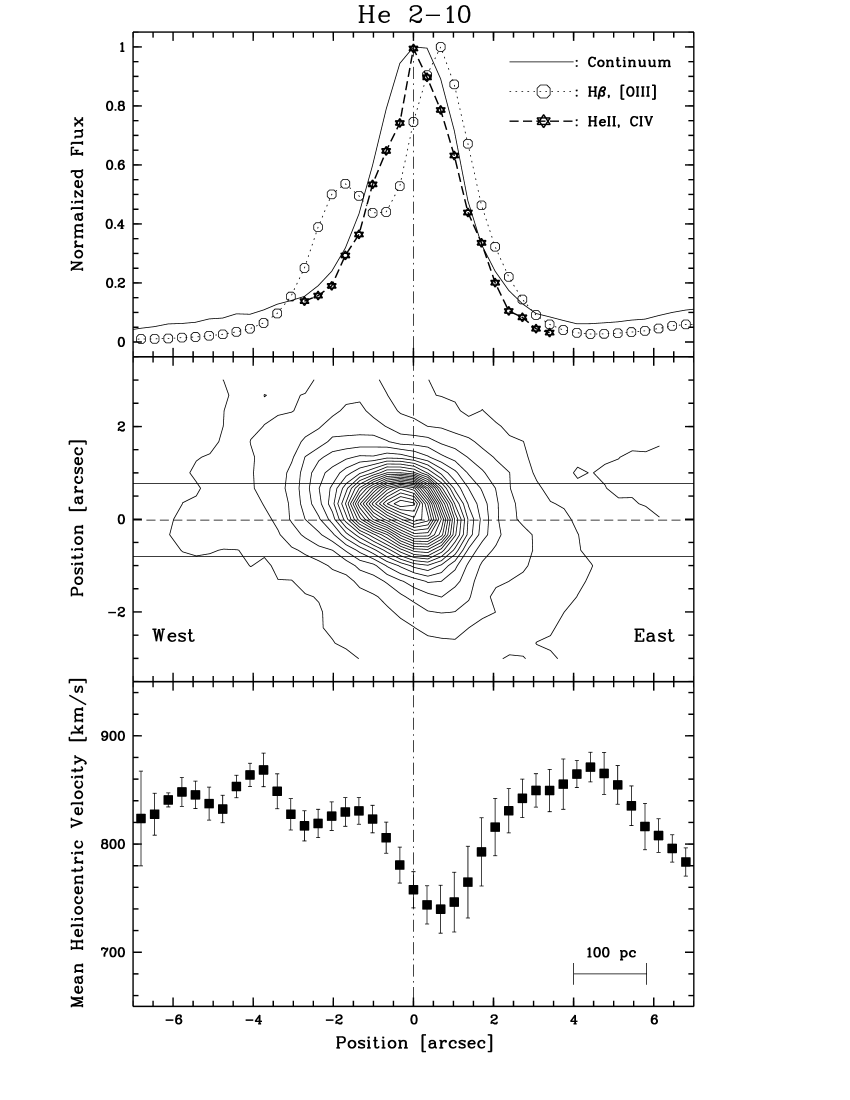
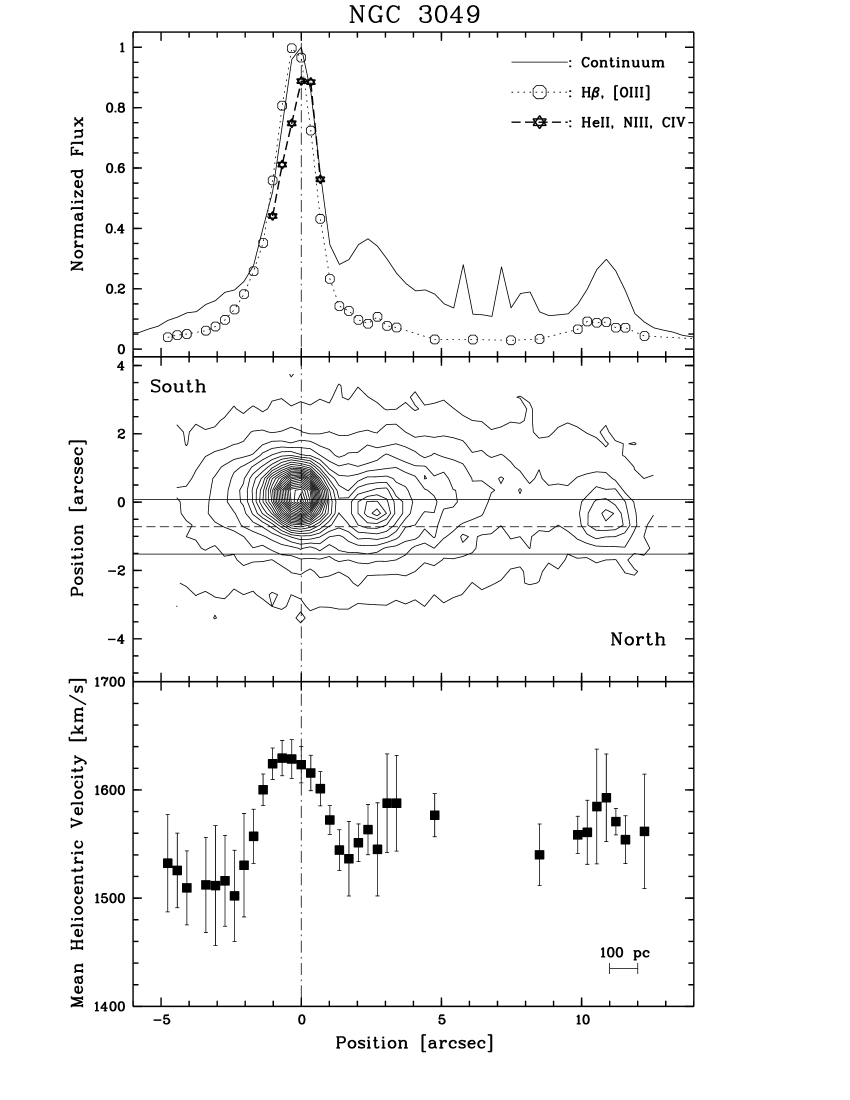
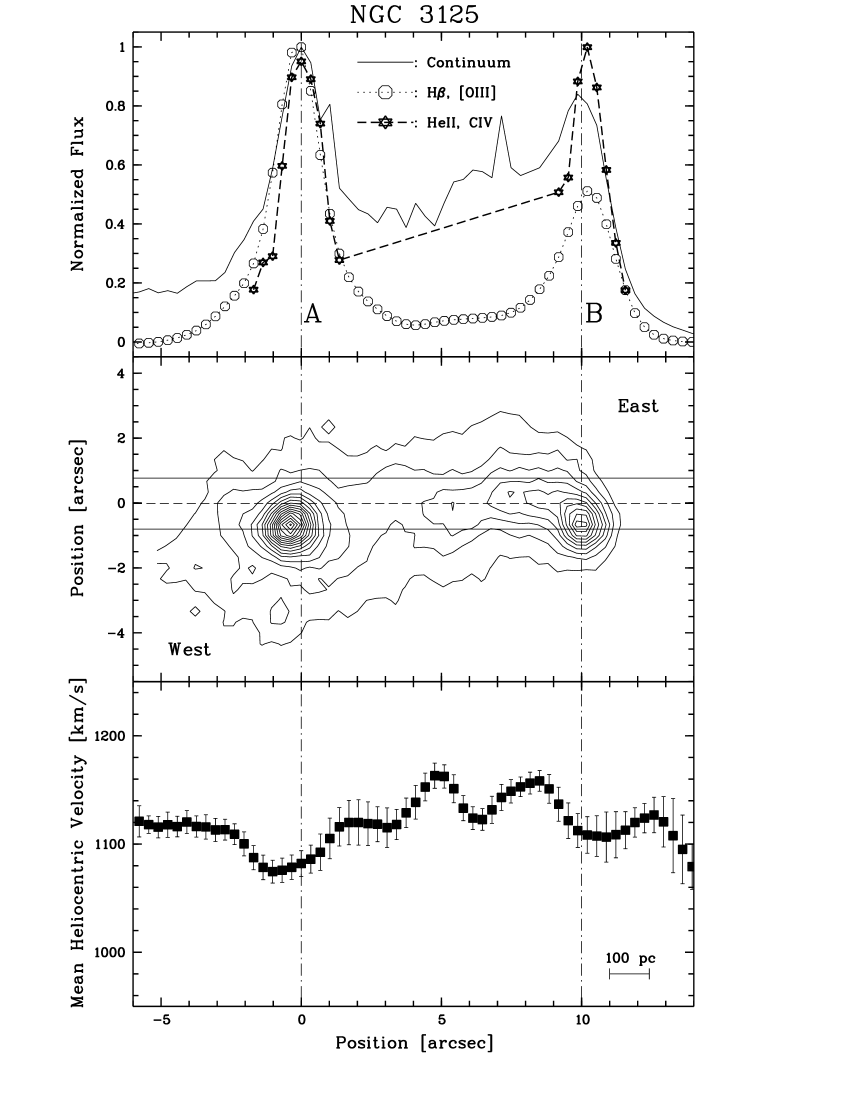
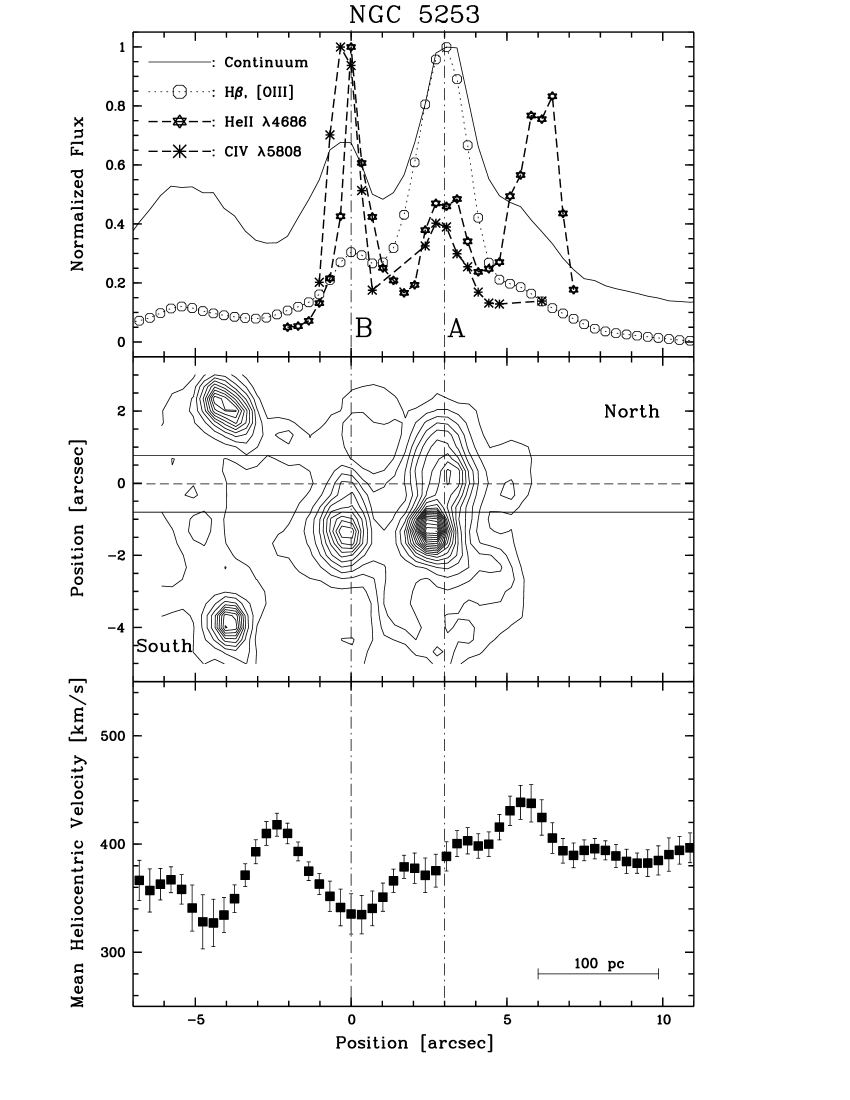
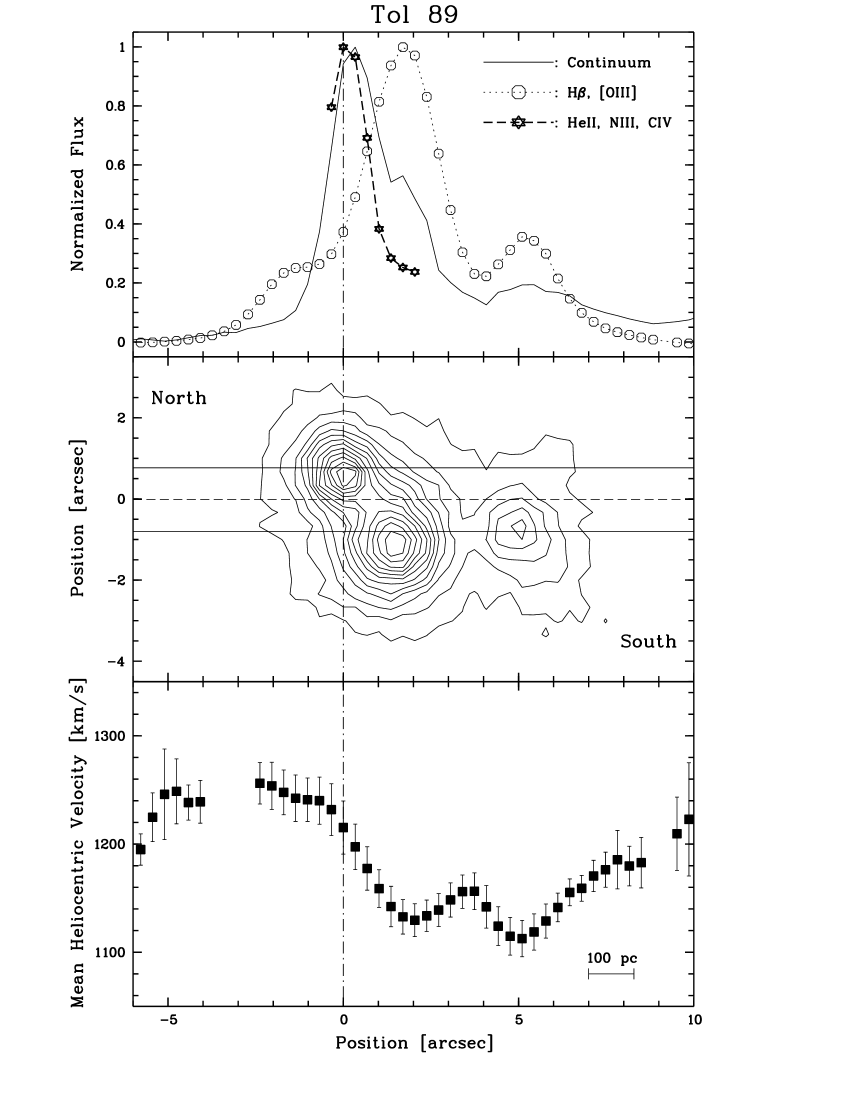
The results of the spatial analysis are displayed in Figs. 1 to 5. We do not observe any significant variation in the spatial distribution of the bright nebular emission lines. We therefore plot (see top panel) the mean nebular intensity distribution corresponding to the averaged flux of the brightest lines and [O iii] 5007. The same applies to the continuum emission; no significant variation is seen in the intensity distribution from 4400 Å to 6500 Å, at least for the small portion of galaxy shown in the figures. A small shift between the position of peak intensity of the blue and red W-R bumps is observed in nearly all the galaxies. This difference is however too small ( 1″) to be significant, given the spatial resolution of our observations. We thus plotted the mean intensity distribution of W-R emission lines by averaging the intensities of He ii 4686, C iv 5808 and N iii 4640+C iii 4650 (for NGC 3049 and Tol 89 only).
In the middle panel of each figure, we include an isophotal map of the galaxy produced from a CCD image taken without filter just before the spectroscopic observation. The position and direction of the slit are indicated. This image is very useful to identify the peak intensities of the continuum and emission lines. In the bottom panel, we show a velocity curve derived from the measured central wavelength of nebular emission lines along the slit. The mean radial heliocentric velocity has been derived using the brightest nebular lines, i.e. , [O iii] 4959, [O iii] 5007 and He i 5876, since no systematic variation in the velocity curves has been observed for the various emission lines.
One of the most striking features which appear in Figs. 1 and 5 is the difference between the distributions of stellar continuum and nebular lines in He 2-10 and Tol 89. The stellar continuum shows only one maximum whereas the distribution of nebular lines intensity is mostly double-peaked. Moreover, the maximum intensity of nebular lines is shifted relative to the maximum intensity of stellar continuum, both for He 2-10 ( 1″ to the East) and Tol 89 ( 2″ to the South-West). In the other galaxies, i.e. NGC 3049, NGC 3125 and NGC 5253, the peaks of the nebular lines and stellar continuum intensity distribution are coincident.
In all the galaxies, the peak intensity of the broad emission lines He ii 4686 and C iv 5808 coincide with the peak intensity of the stellar continuum, even in He 2-10 and Tol 89 where there is a shift between the distributions of stellar continuum and nebular lines. These results confirm the stellar origin of the broad W-R emission lines. Given the good signal-to-noise ratio of our observations, it has been possible to detect the W-R lines over a large extension around the maximum intensity. The size of the “W-R regions” ranges from 2″ – 3″ for Tol 89, NGC 3049, NGC 3125 and NGC 5253 to 6″ for He 2-10. The W-R lines are detected in two distinct regions in NGC 3125 (separation 10″) and NGC 5253 (separation 3″). See Table 1 for the corresponding linear scale (in pc/″) of the galaxies.
3.2 Spatial distribution of Wolf-Rayet stars
In this Section we shall discuss the spatial distribution of the W-R signatures in the individual objects. To this end, we use (when available) high resolution images from the literature to identify the W-R regions.
He 2-10
Three starburst regions can be distinguished on the optical images of He 2-10 Hutsemekers & Surdej (1984); Corbin et al. (1993). Following the nomenclature of Corbin et al. Corbin et al. (1993), the most prominent is region at the center of the galaxy. The second starburst region is located at 8.5″ East of . It is smaller and fainter in optical images and is seen at an even lower level in . The third region called Sauvage et al. (1997), located 2.5″ West of region , is not prominent in optical images but is more noticeable in and [O iii] images Corbin et al. (1993). Regions A, B, and C are resolved into several knots on HST UV images Conti & Vacca (1994). The presence of three starburst regions in the central part of He 2-10 is consistent with the spatial distribution of W-R emission lines along the slit ( 4″ long) which shows a maximum in but extends also to the region , the secondary peak of nebular emission seen in Fig.1. Knot was not included in our slit. Our long-slit spectrum of He 2-10 shows W-R features in regions A and C. However, the spectral signatures in region are too faint to be considered separately from region in the following analysis (see Sect. 4).
NGC 3049, NGC 3125
In NGC 3049 and NGC 3125, the W-R regions coincide with the peaks of the continuum emission and nebular lines distributions. NGC 3049 is a barred spiral galaxy belonging to the Virgo cluster. This low-mass galaxy has a small bulge and a thin bar of constant surface brightness surrounded by an inner ring Contini et al. (1997). The optical appearance of NGC 3125 is an amorphous elliptical shape with a bright central starburst region dominated by two bright knots (regions and ) apparently connected by a bridge of fainter intensity.
NGC 5253
Our observations of NGC 5253 have already been presented in Schaerer et al. (1997). The spatial distribution of W-R stars in this object is complex (see Fig. 4). There are two W-R regions, labeled as and , located at the two peaks intensity of the continuum and nebular lines distributions. The brightest W-R region (), however, corresponds to the faintest continuum and emission lines region. For this galaxy we made a distinction between the distribution of the He ii 4686 and C iv 5808 lines. There is indeed a third bright “He ii 4686 region” (region in Schaerer et al., 1997) located 6″ North-East of the brightest W-R region . The spectrum of this region show a narrower He ii 4686 line than in others regions and , probably of nebular origin Schaerer et al. (1997). In fact, the core of the galaxy ( 20″ of diameter) host a dozen blue stellar clusters as well as diffusely distributed massive stars (Meurer et al. 1995 ;cf. also Calzetti et al., 1997 for a recent study of NGC 5253).
Tol 89
Tol 89 is a giant Hii region located in one of the spiral arms of the barred spiral galaxy NGC 5398, about 34″ South-West of the nucleus. This object shows the largest shift between the spatial distribution of the continuum and nebular lines. The spatial distribution of the W-R lines is narrower than that of the nebular lines. W-R lines are found at the two regions where the continuum peaks.
4 The Wolf-Rayet regions
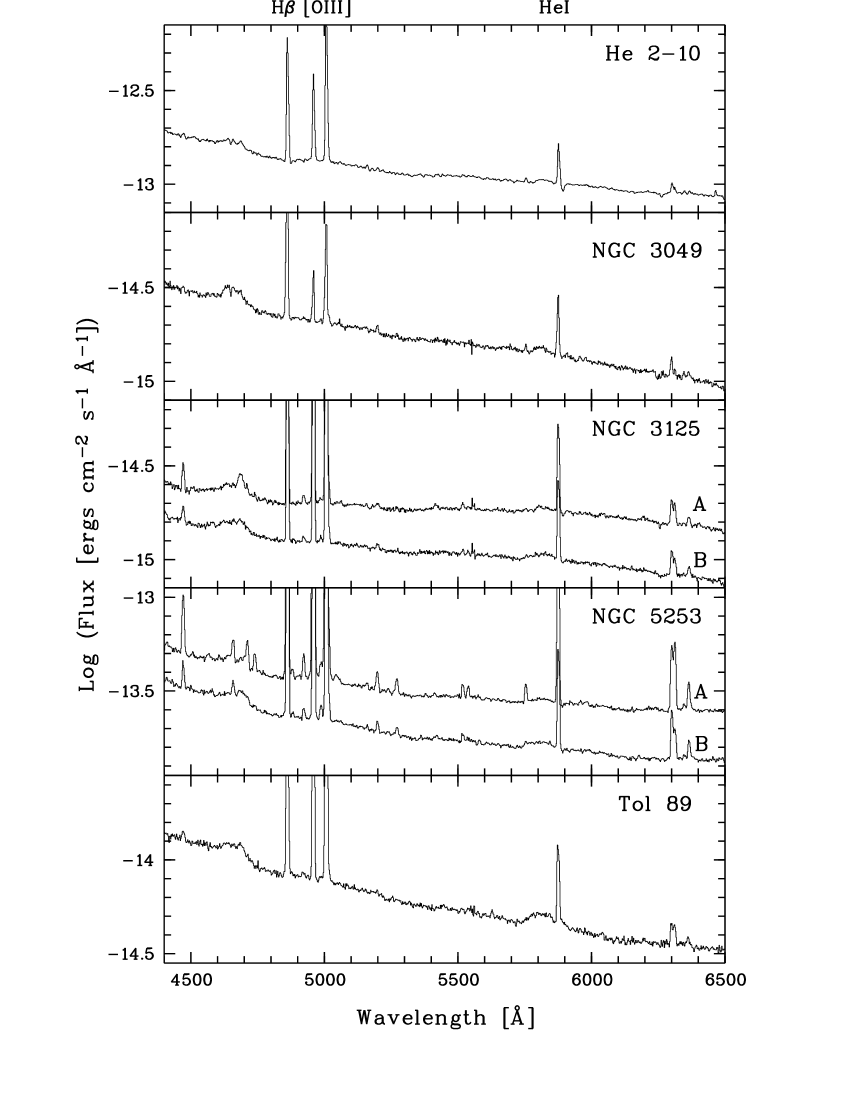
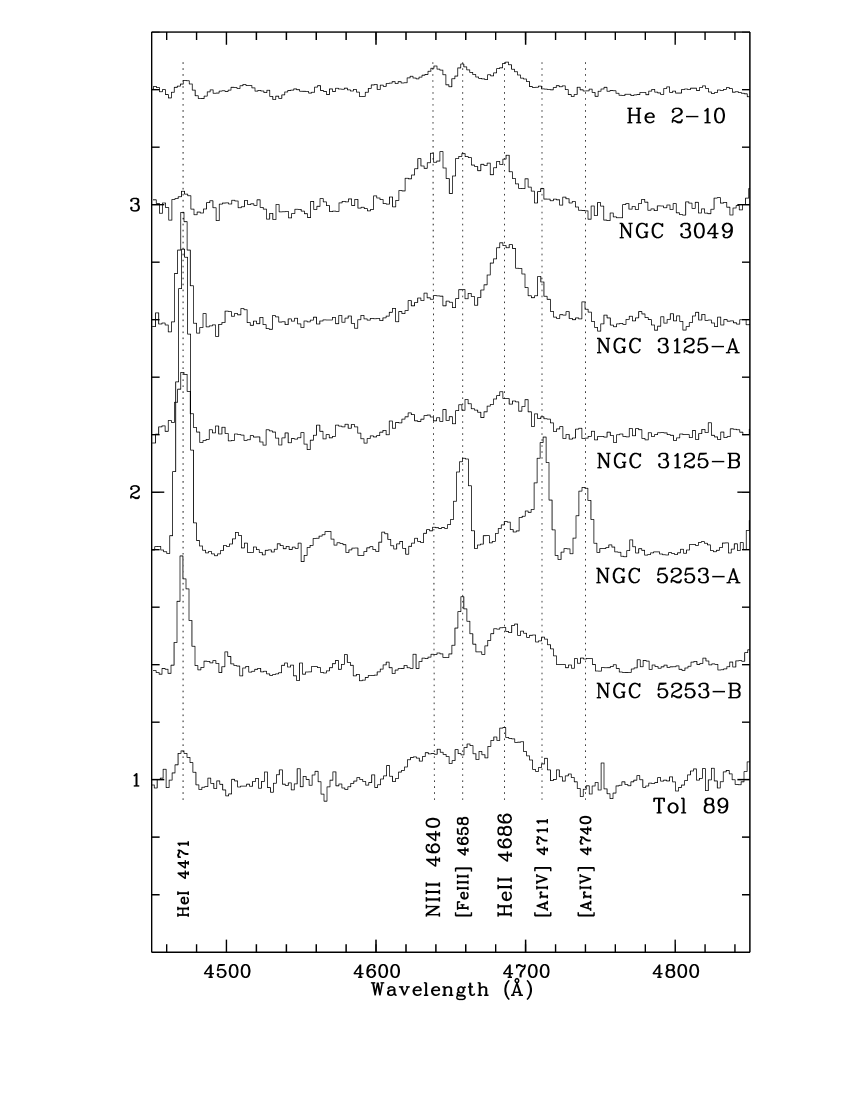
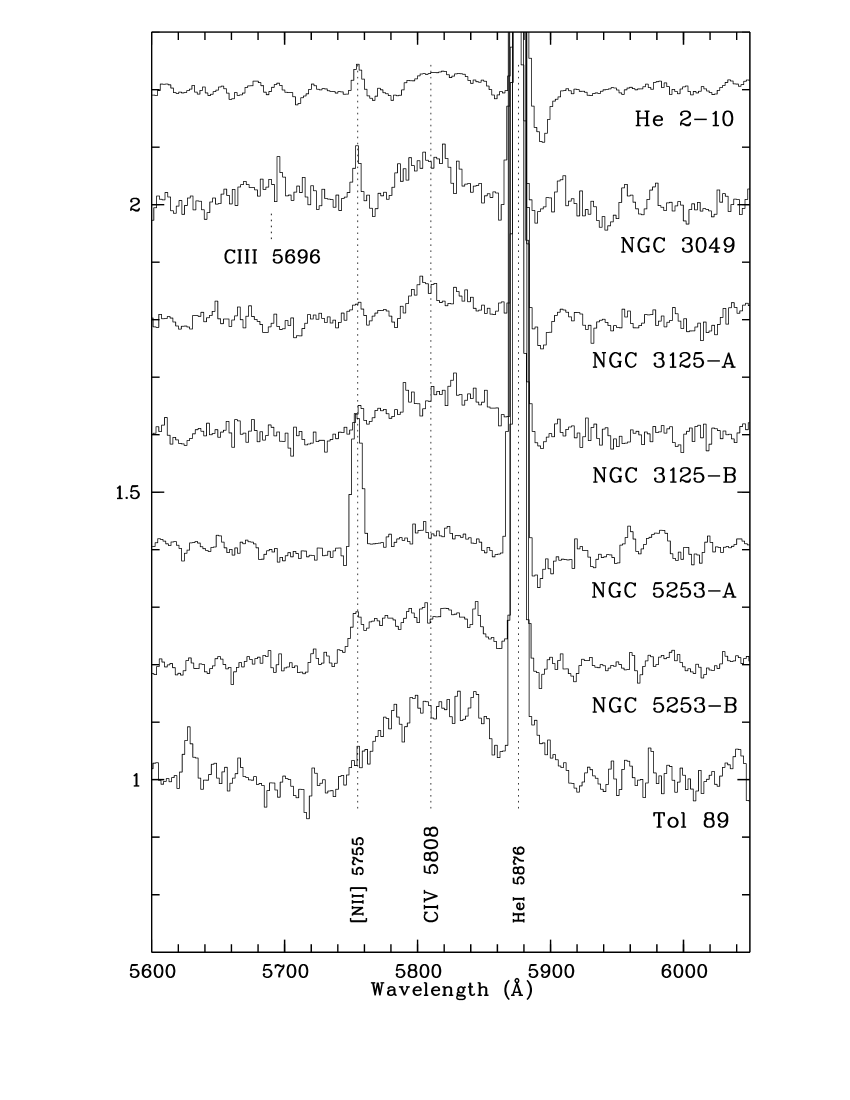
In this section, we present a spectroscopic analysis of the individual regions where spectral signatures from W-R stars have been detected. One-dimensional spectra were extracted corresponding to the different regions by adding several columns along the slit. The size of the extraction window has been chosen for each region in order to obtain the best compromise between a high signal-to-noise ratio in the continuum (around 4700 Å and 5800 Å) and a good enough spatial resolution. We extracted one-dimensional spectra centered on the maximum intensity of W-R emission lines with an aperture of 1.7″ for NGC 5253 (regions and ) and Tol 89, 2.0″ for NGC 3049, 2.7″ for He 2-10 and NGC 3125 (regions and ). We thus obtained spectra for a total of seven regions, one per galaxy except for NGC 3125 and NGC 5253 in which two W-R regions have been identified. The full wavelength range ( Å, corrected for the Doppler effect) of the flux calibrated spectra (not corrected for reddening) of W-R regions are shown in Fig. 6. Normalized spectra showing the region around the blue and red W-R bumps are given in Figs. 7 and 8 respectively.
Given the complex structure and multiple blends around the blue W-R bump and the medium resolution of our spectra we adopt the following procedure to measure accurately the individual emission lines. We use a procedure of multi-gaussians fitting where the number of gaussians is the only fixed parameter (central wavelength, intensity and FWHM are free to vary). The normalized spectra were obtained by dividing the spectra by a low-order polynomial fit on the line-free region of the continuum. In Table 2 we report the measurements performed on the normalized spectra. The uncertainties are discussed next.
4.1 Uncertainties
There are three major sources of uncertainties in the measured fluxes and equivalent widths of emission lines. The first one is inherent to the measurement itself and depends mainly on the signal-to-noise ratio of the spectra. These errors were computed directly when using the IRAF task SPLOT to derive the parameters of emission lines. The second source of errors comes from the extraction of an individual spectrum corresponding to a region in a galaxy. Indeed, for some galaxies like He 2-10 and Tol 89, we observe a shift between the maximum emission of the stellar continuum and of the nebular lines (see Sect. 3). Thus, the measured line flux and equivalent width of the lines is sensitive to the size of the extraction window used to obtain one-dimensional spectra of the individual regions. To estimate this error, we measured the lines in extracted spectra from effective apertures sizes ranging from 1″ to 4″. A third source of uncertainty exists for lines from the blue W-R bump. Given the important slope of spectra and the complex structure in this region the line measurement also depends on the determination of the continuum level (i.e. the normalization). Therefore measurements of emission lines in the W-R bumps were performed before and after normalization.
The three sources of errors were propagated quadratically to obtain the final uncertainties reported in Table 2 for the dereddened line fluxes and for the equivalent widths. For the bright nebular emission lines (like , [O iii] and He i 5876), the relative uncertainty is generally smaller than 10%. However, it can reach a maximum of 20% for the equivalent width and of 30% for the relative flux of faintest broad emission lines from W-R stars. We find that generally errors due to the measurement itself (which is S/N) and to the extraction window are comparable. For emission lines from the blue W-R bump, the uncertainties due to the normalization are not negligible and can even be comparable in some cases. We note however some exceptions. For He 2-10 and Tol 89, which show a discrepancy between the nebular and the continuum emission, the uncertainty on the equivalent width of nebular lines (and especially for ) is dominated by the error due to the size of the extraction window.
We checked the absolute flux calibration ( flux), the relative line flux of He i 4471, [O iii] 4959 and He i 5876 lines, and the equivalent width of by comparing our measurements with previous observations reported in the literature: He 2-10 Vacca & Conti (1992), NGC 3049 Kunth & Schild (1986); Vacca & Conti (1992); Contini et al. (1997), NGC 3125 Kunth & Sargent (1981, 1983); Kunth & Joubert (1985); Vacca & Conti (1992), NGC 5253 Campbell et al. (1986); Walsh & Roy (1989); Terlevich et al. (1991), and Tol 89 Durret et al. (1985); Terlevich et al. (1991). A good agreement was generally found for the absolute calibration and the relative fluxes of bright nebular lines, with relative errors 20%.
Larger differences can be found for the broad W-R lines. Comparing our data with VC92, our measurements of He ii 4686 (relative flux to and equivalent width) are found to be systematically larger by a factor of 3 in NGC 3049, and 1.5 in He 2-10 and NGC 3125, although a good agreement is found for the nebular lines. Given the systematic differences, it is unlikely that different slit positions are responsible for this effect. To understand the origin of this discrepancy, we compared our spectra to those published in VC92 and kindly provided by William Vacca. The comparison shows that the differences can mostly be understood in terms of differing signal-to-noise ratios. Indeed, the measurement of the faint, broad W-R emission lines is strongly dependent on the signal-to-noise ratio, especially to fit the continuum level in the deblending process used to separate the W-R bump into the individual components. Given the improved quality of our spectra (S/N 50–70 around 4700 Å compared to S/N for VC92), our measurements should be more reliable. In particular the improved S/N also allows the detection of the weaker N iii 4640+C iii 4650 blend, barely detectable in the data of VC92.
Within the uncertainties, our new measurements of W-R emission lines in NGC 5253 are consistent with those given in Schaerer et al. Schaerer et al. (1997), which were obtained from a different reduction/analysis.
4.2 Reddening
Due to the limited spectral range, our observations do not include the emission line commonly used to determine the internal reddening parameter . We therefore adopt values taken from the recent literature. We wish to remind that the determination of the amount of reddening is subject to two complications often not accounted for: 1) the value of the extinction coefficient can be wavelength dependent, and 2) variations of the extinction on small spatial scales can occur. The former is well illustrated by the case of He 2-10, where varies from 0.4 in the optical Sugai & Taniguchi (1992); Vacca & Conti (1992) to 4.5 in the infrared Aitken & Roche (1984); Kawara et al. (1989) and can even reach 14 in the millimeter range Kobulnicky et al. (1995). NGC 5253 is a good example showing large spatial variations of reddening Walsh & Roy (1989); Calzetti et al. (1997). The adopted extinction coefficient is taken from regions corresponding as closely as possible to the ones studied here and derived from optical spectra, i.e. from the Balmer decrement. Our adopted reddening values are given in Table 2.
For He 2-10 and NGC 3125, we adopt the internal extinction coefficients given by VC92, with different values for regions ( 0.40) and ( 0.64) of NGC 3125. For NGC 3049, we choose to use the value 0.23 given by Contini et al. Contini et al. (1997) instead of that derived by VC92. Our W-R region is indeed better identified in the spectroscopic observations of Contini et al. Contini et al. (1997). For Tol 89, we adopt the reddening coefficient 0.18 estimated by Terlevich et al. Terlevich et al. (1991) which is in good agreement with the measurements of Durret et al. Durret et al. (1985). See Schaerer et al. Schaerer et al. (1997) for NGC 5253.
Dereddened fluxes are derived using the extinction law of Cardelli et al. Cardelli et al. (1989) and including a Galactic foreground extinction given in Table 1. The result is almost independent of the chosen extinction curve, since in the wavelength range Å, there is little difference among the mean interstellar extinctions of the Galaxy, the Large Magellanic Cloud, and the Small Magellanic Cloud Seaton (1979); Bouchet et al. (1985); Fitzpatrick (1986). Dereddened line fluxes are given in Table 2.
| Line/Galaxy | He 2-10 | NGC 3049 | NGC 3125 | NGC 5253 | Tol 89 | ||
|---|---|---|---|---|---|---|---|
| A | B | A | B | ||||
| Nebular Emission Lines | |||||||
| He i 4471 | 11 3 | 11 3 | 42 8 | 42 3 | 49 1 | 45 3 | 31 19 |
| [Fe iii] 4658 | 35 5 | 42 5 | 10 3 | 23 3 | 13 4 | 19 2 | 27 8 |
| [Ar iv] 4711 | … | … | 13 3 | 11 1 | 14 4 | 21 2 | … |
| [Ar iv] 4740 | … | … | 4 1 | 3 1 | 8 2 | … | … |
| He i 4922 | … | … | 7 2 | 8 2 | 9 1 | 9 1 | 11 2 |
| [O iii] 4959 | 47122 | 106 6 | 1970 67 | 1526 41 | 2070 36 | 149119 | 1229 33 |
| [O iii] 5007 | 143044 | 338 4 | 5852197 | 4538128 | 6155104 | 438959 | 3636111 |
| [N i] 5199 | 12 2 | 14 5 | … | 7 2 | 9 1 | 8 2 | 3 1 |
| [Fe iii] 5271 | … | … | … | … | 5 1 | 8 1 | … |
| [Cl iii] 5518 | … | … | 6 1 | … | 4 1 | 5 1 | … |
| [Cl iii] 5538 | … | … | … | … | 3 1 | … | … |
| [N ii] 5755 | 10 2 | 8 1 | … | … | 5 1 | … | … |
| He i 5876 | 123 7 | 133 2 | 121 3 | 120 6 | 131 2 | 130 1 | 118 3 |
| [O i] 6300 | 14 5 | 23 1 | 18 3 | 19 1 | 27 5 | 28 2 | 13 1 |
| [S iii] 6318 | 21 7 | 6 1 | 14 1 | 12 1 | 29 7 | 20 1 | 20 1 |
| [O i] 6364 | 4 1 | 7 1 | 5 1 | 7 1 | 7 1 | 8 1 | 7 4 |
| () | 196 8 | 16 3 | 66 11 | 73 8 | 212 7 | 49 2 | 13 1 |
| () [Å] | 23 3 | 34 3 | 93 9 | 70 7 | 269 23 | 112 10 | 68 17 |
| 0.56 | 0.23 | 0.40 | 0.64 | 0.44 | 0.20 | 0.18 | |
| (O/H) [Z⊙] | 0.42 | 1.20 | 0.17 | 0.20 | 0.20 | 0.20 | 0.25 |
| Broad Emission Lines from Wolf-Rayet Stars | |||||||
| N iii 4640+C iii 4650 | 11243 | 11735 | 31 4 | 63 18 | 7 2 | 18 8 | 81 32 |
| He ii 4686 | 9735 | 12838 | 76 8 | 73 15 | 9 3 | 4515 | 116 43 |
| C iii 5696 | … | 3510 | … | … | … | … | … |
| C iv 5808 | 41 7 | 7910 | 21 5 | 51 9 | 6 3 | 30 5 | 132 30 |
| (N iii 4640+C iii 4650) [Å] | 2.70.5 | 5.20.5 | 3.20.5 | 2.81.0 | 2.11.3 | 1.00.5 | 3.40.5 |
| (He ii 4686) [Å] | 2.30.5 | 5.60.5 | 7.31.0 | 2.80.5 | 3.00.7 | 3.31.1 | 6.10.5 |
| (C iii 5696) [Å] | … | 2.00.5 | … | … | … | … | … |
| (C iv 5808) [Å] | 1.50.5 | 4.70.6 | 3.10.4 | 6.21.0 | 2.50.6 | 6.01.1 | 11.91.5 |
| For each emission-line we reported the dereddened () flux normalized to . () is the absolute dereddened flux of the emission line in ergs s-1 cm-2, is the extinction coefficient (see Sect. 4.2 for references) and is the equivalent width of the and W-R emission lines in Å. (O/H) is the oxygen abundance in solar units (see Sect. 4.3 for details). | |||||||
4.3 Oxygen abundance
Oxygen is an important element for our subsequent analysis, as it is used to define the metallicity of each W-R region for the comparison with starburst models (see Sect. 5). Since the [O ii] 3727 and [O iii] 4363 lines are not included in our wavelength range, the oxygen abundance was determined from the empirical calibration between log(O/H) and the ratio Edmunds & Pagel (1984), with the linear fit given by VC92. Edmunds & Pagel Edmunds & Pagel (1984) estimate the intrinsic uncertainty in the calibration to be about in log(O/H). For the solar oxygen abundance, we adopted the local galactic value of log(O/H) Meyer (1985). The oxygen abundances derived in this way are summarized in Table 2. Except NGC 3049 which has an oxygen abundance slightly above solar, the values for the other W-R regions are below solar, typically Z⊙.
Our derived oxygen abundances are generally in good agreement with earlier studies. The oxygen abundance (O/H) 0.2 Z⊙ derived for NGC 5253 is identical to the value obtained by Kobulnicky et al. Kobulnicky et al. (1997). We obtain (O/H) 1.2 Z⊙ for the W-R region of NGC 3049, in good agreement with previous observations by Contini et al. Contini et al. (1997). A good agreement is also found for NGC 3125 between our measurements (0.17 Z⊙ for region and 0.20 Z⊙ for region ) and those of VC92. The same is true for Tol 89, when we compare our estimation of (O/H) 0.25 Z⊙ to the derivation by Durret et al. Durret et al. (1985).
For He 2-10, however, we obtain (O/H) 0.42 Z⊙, three times larger than the value from VC92 for the same region. The calculations by VC92 are based on the detection of the temperature-sensitive [O iii] 4363 emission line, which is however very faint in their spectrum of He 2-10. Their (O/H) value may therefore be underestimated, and we thus prefer the higher value derived from our spectra.
4.4 Broad emission lines from Wolf-Rayet stars
Several broad emission lines (FWHM 25 Å) due to W-R stars have been detected with high confidence level ( 3 ) over the wavelength range covered by our spectra: the blend of N iii 4640 and C iii 4650, He ii 4686, and C iv 5808. Equivalent widths and fluxes relative to of these emission lines are listed in Table 2.
One of the main results of this paper is the unambiguous detection of broad (FWHM Å) C iv 5808 emission in all W-R regions of the observed galaxies (see Figs. 6 and 8), which clearly indicates the presence of WC stars in these regions (cf. below). Whereas all the objects where previously known to show the broad W-R bump around 4700 Å, our spectra are the first to show the red W-R bump around 5800 Å. As already pointed out by Schaerer et al. Schaerer et al. (1997) a sufficiently high signal-to-noise ratio ( 40) is required for the detection of such a C iv 5808 line in integrated spectra of W-R galaxies. Typically the 5808 flux is found to be factor of two less than 4686; furthermore the larger width of C iv 5808 and the lower intensity of the continuum render its detection more difficult. This explains why this line has remained undetected in previous ground-based spectroscopical studies, except for He 2-10 Hutsemekers & Surdej (1984); Vacca & Conti (1992).
What do the broad emission features tell us about the W-R populations in these regions ? WN stars cannot be responsible for the C iv 5808 emission, since they show He ii 4686/C iv 5808 16. (SV98), much larger than observed in our spectra. In addition the strong He ii 4686 emission, the relative strengths of the W-R features in the blue bump, and the FWHM(He ii 4686) ( Å) are fingerprints of the presence of WN stars, as commonly accepted Conti (1991). In all our seven emission line regions we thus find signatures of both WN and WC stars. For six regions this represents the first detection of WC stars.
The dominant W-R subtypes can be constrained as follows. In all our spectra the presence of N iii 4640 and/or C iii 4650 is established, while N v 4604 is very weak or absent. If the former are due only to WN stars this indicates the predominance of late-type WN stars (WNL). The relative strength of (N iii 4640+C iii 4650)/He ii 4686 ranges from 0.9 to 2.5 with an average of 1.5, which is much larger than the average of obtained for LMC WNL stars (SV98). The excess flux can easily be attributed to the emission from the WC stars. As for the WN stars it is not possible to apply the usual criteria to classify the WC subtypes. However, the measured FWHM(5808) are compatible with types WC7-WC4 but also WO1, WO3, and WO4 Smith et al. (1990); Crowther et al. (1998). A significant population of WO1 stars can, however, be excluded from the absence of O v 5590. Only in NGC 3049 do we also detect C iii 5696 (cf. below) with a relative intensity compatible with WC7 stars. In the other cases the non-detection of C iii 5696 and FWHM(5808) favors early-type WC stars. From the comparisons of the broad emission features, we thus conclude that all regions (except the high metallicity galaxy NGC 3049 discussed below) contain a mixed population of WNL, and early WC and/or WO3-4 stars. The presence of intermediate-type WN/WC stars cannot be excluded.
In the following we shall now discuss the W-R signatures individually for each object.
| Galaxy | Age | log | log | ||||||||
| [Myr] | [ s-1] | [M⊙] | [ergs s-1] | [pc] | [km s-1] | ||||||
| (1) | (2) | (3) | (4) | (5) | (6) | (7) | (8) | (9) | (10) | (11) | |
| He 2-10 | 5.5 – 6.0 | 3802 | 1100520 | 250 | 0.5 – 1.0 | 2450 - 4900 | 6.8 | 40.81 | 1000 | 110 | |
| NGC 3049 | 5.5 | 1349 | 510240 | 170 | –a | 0a | 6.4 | 40.40 | 900 | 100 | |
| NGC 3125 | A | 4.5 – 5.0 | 2188 | 500230 | 70 | 0.25 – 0.5 | 3240 - 6470 | 6.1 | 40.48 | 700 | 90 |
| B | 4.5 – 5.0 | 2455 | 530250 | 200 | 0.25 – 0.5 | 3450 - 6900 | 6.1 | 40.53 | 700 | 90 | |
| NGC 5253 | A | 3.0 | 896 | 2613 | 9 | 0.8 – 0.9 | 960 - 1080 | 6.6 | 39.00 | 230 | 50 |
| B | 5.0 | 207 | 2713 | 10 | 0.25 | 680 | 6.6 | 39.30 | 440 | 50 | |
| Tol 89 | 4.5 – 5.0 | 708 | 240110 | 150 | 0.25 – 0.5 | 640 - 1270 | 5.7 | 39.84 | 550 | 70 | |
| a For instantaneous burst models with solar metallicity and higher, is not defined. The derived number of O stars (col. 7) is strongly dependent on the adopted temperature limit between O and B stars. See text for more details. | |||||||||||
He 2-10
He 2-10 was the first galaxy discovered to have evidence for W-R stars Allen et al. (1976), and is in many ways considered as the prototypical W-R galaxy Conti (1991). A broad feature of C iv 5808 was also suspected by Hutsemekers & Surdej (1984) and detected by VC92 in the optical spectrum of He 2-10. The presence of this line is unambiguous in our spectrum of He 2-10 (see Fig. 8). The blue W-R bump (see Fig. 7) is composed by the broad He ii 4686 line and N iii 4640+C iii 4650 with nearly the same strength.
NGC 3049
In NGC 3049, the W-R region first noted by Kunth & Schild Kunth & Schild (1986) is located in the bar, 2.5″ North-East of the galaxy nucleus (see Fig. 2). The blue W-R bump is defined by two broad emission lines identified as He ii 4686 and N iii 4640+ C iii 4650 (see Fig. 7), with approximatively the same strength as already reported in previous observations (Kunth & Schild 1986, VC92). In addition to the C iv 5808 line, a broad (FWHM 45 Å) emission line of C iii 5696 is also detected at level in the spectrum of NGC 3049 (see Fig. 8). After Phillips & Conti Phillips & Conti (1992) this is the second detection of this W-R emission line in an extra-galactic Hii region. The C iii emission is attributed to late WC stars, whose presence is indeed expected in high metallicity regions Maeder (1991).
NGC 3125
Penston et al. Penston et al. (1977) detected the He ii 4686 emission line in the North-West knot (= our region ) of NGC 3125, but do not mention W-R stars. The W-R nature of NGC 3125 was first noted by Kunth & Sargent Kunth & Sargent (1981) who first envisioned their importance to elucidate the bursting nature of star-formation processes in Hii galaxies. They computed that this starburst region contains several hundred W-R stars. Long-slit observations of VC92 have first revealed W-R stars in the second condensation 10″ South-East of the nucleus (= our region ). In region of NGC 3125, the W-R bump around 4700 Å is dominated by the He ii 4686 line whereas the N iii 4640+ C iii 4650 blend and the He ii 4686 line are of similar strength in region (see Fig. 7). We signal a marginal () detection of broad He ii 5412 emission, the second strongest He ii line in WN stars, in knot A. If confirmed this represents, to our knowledge, the first detection of this line in the integrated spectrum of an extra-galactic object. The spectrum of region also exhibits the typical high-excitation nebular emission lines of [Ar iv] 4711 and [Ar iv] 4740 (see Fig. 7). Their presence might imply a nebular contribution to the He ii 4686 line.
NGC 5253
The spectra are discussed in Schaerer et al. Schaerer et al. (1997). In addition we signal that He ii 5412 emission may also be marginally detected in region B.
Tol 89
Durret et al. Durret et al. (1985) reported the first detection of the W-R bump around 4700 Å in the spectrum of Tol 89, but their low signal-to-noise ratio and moderate spectral resolution did not allow a clear identification of the lines. They do not detect any optical spectral signature from WC stars, but their presence was suggested from UV P-Cygni lines. In our spectrum of Tol 89 (see Fig. 7), the blue W-R bump shows He ii 4686 and at a lower level the N iii 4640+ C iii 4650 blend. The C iv 5808 line is the strongest ( 13 Å) and the broadest (FWHM 90 Å) detected among the spectra of observed W-R regions (see Fig. 8).
4.5 Massive star populations
In this section we derive the approximate number of massive stars (O and W-R) in the W-R regions of galaxies. The mechanical energy output from the stellar population and its impact on the surrounding ISM is studied in Sect. 4.6. A direct comparison of the observed W-R emission line features with evolutionary synthesis models is presented in Sect. 5.
The approximate number of WN, WC, and O stars are listed in Table 3 (columns 4, 5 and 7). The number of W-R stars is calculated from the luminosity of the W-R emission lines. We assume that the dominant contributors to the broad He ii 4686 and C iv 5808 lines are respectively WNL and WC4 stars (see Sect. 4.4). The average observed luminosity of WNL stars in the He ii 4686 line is ergs s-1; that of WC4 stars in the C iv 5808 line is ergs s-1(SV98). The quoted uncertainty on the WN number reflects the standard deviation of . Given the complex structure of the blue W-R bump, the uncertainty on He ii 4686 is probably larger than the formal errors, and a nebular He ii contribution may also be present in some of our objects (NGC 3125-A, NGC 5253-A, and possibly also Tol 89; see Fig. 7). In this case has to be corrected downwards. Since is lower for later WC types (SV98) and the dominant WC type is not well constrained (see Sect. 4.4) a lower limit on is provided. Taking into account the variation in between WC4-6 stars we conclude that the number of WC stars may be larger by a factor of .
Under the condition of case B recombination and assuming that all the ionizing photons emitted by the stars are absorbed by the gas, the total number of Lyman photons, (col. 3), can be derived from the observed luminosity of the emission line. Note that this also provides a convenient estimate of the number of equivalent O7V stars, for which s-1 Leitherer (1990). To estimate the number of O stars, , we must take into account the ionizing photon contribution from W-R stars, the age of the stellar population and the IMF (see SV98). is given by:
| (1) |
where , is the average Lyman continuum photon flux per W-R star, and is the IMF averaged ionizing Lyman continuum luminosity of a stellar population normalized to the output of a O7V star (see SV98). In most regions we find . Assuming a priori that the massive main sequence stars provide the bulk of the ionizing Lyman continuum photons implies that the average Lyman flux per W-R star, , is not significantly larger than . For simplicity we adopt s-1 (similar to VC92 but smaller than the age dependent value given by SV98). The value of given in column 6 of Table 3 was taken from the instantaneous burst models of SV98 for a Salpeter IMF at the age given in column 2 (derived from ). The resulting number of O stars (defined by 33 000 K) is given in column 7. The indicated range results only from the range of . The number of O stars found for the W-R regions are between 500 and 7000. NCG 3049 is somewhat exceptional in this respect. Indeed at its age (determined from ) the instantaneous burst models at solar or higher metallicity predict that no stars with 33 000 K are left. If this temperature limit is adopted to separate O stars from later types (cf. SV98) we formally derive (see Table 3). Lowering this limit by 10 % already changes the situation qualitatively: in this case one obtains , and 4000 as test calculations show. In any case, according to these models, the bulk of the ionisation is provided by late O and/or B type stars and W-R stars.
From Table 3, we obtain W-R/O number ratios of (and even larger for NGC 3049), systematically higher than the predictions for constant star formation at the appropriate metallicity Maeder & Meynet (1994), but within the range of instantaneous burst models with different IMF slopes (SV98, Table 4). A more detailed attempt to constrain the IMF is made in Sect. 5.3. A trend of increasing W-R/O ratios towards higher metallicity is found as expected on the average (e.g. Meynet 1995).
For the seven W-R regions, we find a flux ratio for He ii 4686/C iv 5808 of , which shows a fairly small dispersion. The corresponding number ratio of WC/WN stars is typically ; the extreme values are 0.14 (NGC 3125-A) and 0.63 (Tol 89). No systematic variation with metallicity is found. For the low-metallicity objects ( 0.2 Z⊙; NGC 3125, NGC 5253, and Tol 89) the derived WC/WN ratio is larger than what is found in the Local Group (except IC 10) at similar metallicity Massey & Johnson (1998). At higher metallicities He 2-10 and NGC 3049 show, however, WC/WN ratios below the trend observed by Massey & Johnson Massey & Johnson (1998).
The finding of a fairly constant WC/WN ratio may seem surprising at first sight. Contrary to regions of constant star formation, likely representative of the Local Group samples, regions of short star formation (more appropriate for our observed starburst galaxies, see Sect. 5.3) could a priori show quite a large range in WC/WN, depending on the age of the starburst. This is illustrated in Fig. 9 where the predicted WC/WN ratio from the SV98 models are shown for different metallicities, evolutionary tracks, and burst durations (cf. also Meynet, 1995111As pointed out in SV98 due to a different interpolation technique the models of Meynet Meynet (1995) predict a more important WC population at later ages than SV98 even if the same tracks are used. The “real” number of WC stars is likely intermediate between the two models. For a given set of tracks the WC/WN plotted in Fig. 9 may thus be somewhat underestimated.). However, already burst durations of Myr suffice to smooth out the rapid variations of WC/WN. This may well explain the small range of WC/WN found for the low-metallicity objects. The observed WC/WN value in these objects is also intermediate between the predictions from high and standard mass loss models (cf. Fig. 9a and 9b). More surprising is the low WC/WN ratio of the remaining higher metallicity objects (He 2-10 and NGC 3049) compared to the WC/WN value of Massey & Johnson Massey & Johnson (1998) at a similar metallicity. Indeed, the probability of finding WC/WN ratios below the equilibrium value attained in regions of constant star formation should be quite small. However, if the number of WC stars is systematically underestimated by a factor of 3 (due to variations of the average WC subtype with metallicity; cf. above) our observations may well all be larger than the observed WC/WN trend with . We conclude that the WC/WN ratios of the low-metallicity galaxies NGC 3125, NGC 5253 and Tol 89 can be understood quantitatively with burst models of reasonably short but non-zero duration. Additional observations of WC and WN populations, especially for regions of higher metallicities, would be very helpful.

4.6 Energy released by massive stars
The winds produced by these populations of massive stars and by supernovae explosions should strongly perturb the gas dynamics of galaxies. We effectively observe some perturbations centered on the W-R regions in the velocity curves of the ionized gas (see Figs. 1 to 5). The observed velocity differences range from 40 km s-1 in NGC 3125 and NGC 5253 to 100 km s-1 in He 2-10 and NGC 3049. These values are similar to the typical expanding velocities ( 50 km s-1) of superbubbles and filaments observed in dwarf galaxies Marlowe et al. (1995); Legrand et al. (1997a). According to these authors, the mechanical energy output from the supernovae explosions and strong stellar winds in the starburst regions appears adequate to power expansion motions of this speed. Note also that gas flows resulting from the energizing of the interstellar medium are currently observed in star-forming galaxies Kunth et al. (1998).
To verify this claim, one can compare the computed expansion velocity of a bubble of gas centered on the W-R regions to the observed velocity differences in galaxies. We used a very simple model of wind-blown bubble expanding adiabatically (i.e. energy conservative), which has been described by Castor et al. Castor et al. (1975) who give the following expressions for the evolution of the bubble radius (in kpc) and expansion speed (in km s-1):
| (2) |
| (3) |
where is the kinetic injection rate in units of 1041 ergs s-1, is the number density (in cm-3) in the ambient interstellar medium, and is the time since the expansion of the bubble began in units of 107 yr. The rate of kinetic energy produced by the population of massive stars can be estimated from starburst model predictions Leitherer & Heckman (1995) assuming an instantaneous burst and a Salpeter IMF. The predicted normalized rate of mechanical energy at a given age is thus multiplied by the total mass of ionizing stars formed in the starburst region. The total burst mass (column 8 of Table 3) is derived from using the instantaneous burst models of SV98 and assuming a Salpeter IMF down to 0.8 M⊙. We adopt cm-3 Marlowe et al. (1995), and for , we use the estimated age of the starburst listed in Table 3 (column 2). The computed radius and expansion velocity of the bubble are given in the last two columns of Table 3.
Comparing these values to the velocity differences observed in the W-R regions of galaxies (from 40 to 100 km s-1), we find that the observed and predicted bubble expansion speeds are in satisfactory agreement, especially when considering the extreme simplicity of the model and the observational uncertainties. The comparison of radius is more doubtful since, with long-slit spectra, we have some informations in only one spatial direction. The rough assessments of “bubble” radius from velocity curves are systematically lower by a factor two (NGC 3049) to six (He 2-10) than the values predicted by the model. The same trend has been observed using images of dwarf galaxies Marlowe et al. (1995). These discrepancies are certainly due to the difficulty to measure a “radius” from the velocity curves and to the simplicity of the model which assumes a pure spherical bubble expanding adiabatically. When looking deeply in images of nearby galaxies, like NGC 5253 Calzetti et al. (1997), one can see that the structure of expanding gas is much more chaotic, ranging from large scale ( 1 kpc) filaments to roughly circular shell nebulae of smaller size ( 100 pc). It is thus very difficult and even meaningless to compare some predicted and observed bubble “radius”.
Nevertheless, the size ( 50 to 300 pc) of expanding gas structures observed in W-R regions is significantly smaller than those derived from images ( 700 to 1500 pc) of dwarf galaxies Marlowe et al. (1995). This might reflect the different time scales of the gas dynamics, which depend on the age of the starburst responsible for the release of kinematical energy through stellar winds and supernovae explosions. In the W-R regions, the starburst is one order of magnitude younger (a few yr) than the one (a few yr) derived from gas kinematics in older starburst regions Marlowe et al. (1995). This could explain the smaller sizes of expanding “bubbles” in W-R regions. An additional effect may be the smaller energy injection expected from young regions where the SN rate is still small Leitherer & Heckman (1995). In any case it is evident that the large population of massive stars derived in W-R regions strongly perturb the surrounding ISM through the injection of their mechanical energy.
5 Comparison with starburst models
All the observed W-R features and the most important nebular H and He lines have been modeled recently with synthesis models by SV98. The aim of this Section is to constrain the main burst parameters (age, IMF, star formation history) as far as possible from the observed W-R signatures. Finally the success or failure to reproduce the observed features also provides a test of the underlying evolutionary tracks.
5.1 Model parameters and comparison procedure
In the following we consider two basic free model parameters: the IMF slope and the duration of the star-forming event. The third model parameter, the metallicity , is adopted from the observations (see values given below). A power law with a slope is adopted for the IMF (in our notation for a Salpeter IMF). The upper mass cut-off is generally set to 120 M⊙; the results discussed in this work are not affected by the choice of the lower mass cut-off. We consider burst models with different durations starting at time , with the limiting case of an instantaneous burst ().
For the subsequent detailed comparison it is, however, useful to remind some assumptions or uncertainties of the models, which are not considered as proper free parameters.
-
(a)
Most important is the set of stellar evolution models adopted. We use SV98 models based on the latest Geneva stellar evolution tracks (high mass loss models of Meynet et al., 1994), which have been extensively compared to observations (see Maeder & Meynet 1994) and which in particular reproduce well massive star populations in the Local Group. Only single star models are considered (but see Sect. 5.3 for binary stars).
-
(b)
The predicted fraction of WC stars (WC/WR, and WC/WN) is affected by the choice of interpolation techniques as briefly discussed in Sect. 4.5 and SV98. During the WR phase at ages 4 Myr the relative WC populations predicted by the Meynet (1995) and SV98 models differ; compared to the models used here (SV98), more WC stars are likely to exist at 4 Myr.
-
(c)
As mentioned in Sect. 4.5 the predicted strength of the W-R lines is affected by the uncertainty of the intrinsic W-R line luminosity, which is the largest for He ii 4686.
-
(d)
To relate models with observations is conveniently used as an age indicator. This assumes that the models predict the correct number of ionizing photons (i.e. correct atmospheres, tracks), Case B (ionization bounded nebula) is valid and the fraction of photons absorbed by the gas is correct (SV98 adopt ), and the continuum light is correctly predicted. All except the last point determine obviously the correctness of the nebular line intensity, whose strength is also used for comparisons with the WR lines (see below). It is fairly difficult to verify how well the predicted –age relation (cf. Copetti et al.1986) holds. Empirical tests using recent models and observations of Hii regions and their stellar content in the Galaxy and the Magellanic Clouds could be useful. The fact that very few Hii regions with observed as large as predicted by synthesis models for ages 0–2 Myr may indicate a difficulty in the –age relation (e.g. Mas-Hesse & Kunth 1998).
The comparison with the observations can be performed in two ways. One may compare relative line intensities of the W-R features with respect to the nebular emission (in short W-R/), or use equivalent widths of the W-R lines. Observationaly the determination of these quantities can mainly be “perturbed” by three effects:
-
(i)
We do not count all the ionizing photons produced by massive stars. This may happen if the nebular emission from the Hii region of interest is not entirely included in the slit (e.g. if the gaseous component is more extended than the ionizing star clusters), and/or if ionizing photons can escape from the Hii region (i.e. not ionization bounded nebula).
-
(ii)
Stars and gas suffer from a different extinction.
-
(iii)
An underlying older population contributes additional continuum light.
The relative intensities W-R/ are effected only by (i) and (ii). Effect (i) increase the relative WR/ intensities. The same holds for (ii) if the stellar light is less extincted than the gas (cf. e.g. Calzetti 1997, Mas-Hesse & Kunth 1998). The equivalent widths are only affected by (iii), which decreases the observed value. For the present paper the quantitative importance of these effects cannot be asserted in general without additional observations. At least our spatial information (see Sect. 3.2) can provide hints on (i). From the work of Mas-Hesse & Kunth (1998) we see that, if present, the differences in extinction between the gas and stars are typically 0.05 – 0.1. This implies that the stellar flux may be overestimated by a factor of 1.2 – 1.4, i.e. , and hence O have to be reduced by the same amount. Although e.g. the WC/WN ratio is in principle also modified, the effect is small ( 4 – 8 %). For NGC 3125, NGC 5253, and NGC 3049 an underlying population contributes to 60 % of the light at 4630 Å (Mas-Hesse 1998, private communication), which would correspond to a downward correction by a factor of 1.7 for e.g. . In our observations the contribution from an underlying population is, however, most certainly smaller since they are taken with smaller apertures including the bulk of the young emission line regions (cf. also Schaerer et al.1997) but only a smaller fraction of the continuum light.
Given these potential difficulties both comparisons of relative line intensities W-R/ and W-R equivalent widths will be performed for all objects. Significant differences between the two methods likely indicate some difficulty with (d) and/or effects (i)–(iii). In this case the simplest meaningful comparison is between the observed WR equivalent widths and the maximum value predicted by the models (irrespectively of the age); it only depends on (iii).
It is well known that the W-R populations strongly depend on metallicity. We will therefore compare the observed regions to the models at the closest metallicity available. For the remainder of this Section we will associate the objects (O/H given in Sect. 4.3) with the following metallicity : NGC 3049: 0.02 (star symbol in Figs. 10 to 12), He 2-10: 0.008 (open triangle), and 0.004 for the remaining objects (NGC 3125, NGC 5253, Tol 89; all filled symbols).
5.2 Results
In Fig. 10 we compare the observed relative W-R line intensities of all W-R regions with the model predictions of SV98 at 0.02 (solar), 0.008, and 0.004 for an instantaneous burst with a Salpeter IMF (hereafter “standard” model; variations are considered in Sect. 5.3). The same is shown for the W-R equivalent widths in Fig. 11. In both plots, is used as a time indicator (decreasing with time) in the synthesis models. The following general comments can be made to Figs. 10 and 11.
From object to object the observed line ratios vary by a much larger factor than the W-R equivalent widths. This can be explained by the more rapid decrease of the Lyman continuum luminosity (i.e. the intensity) compared to the smaller variations in the optical continuum light in a short burst. With the exception of C iv 5808 in Tol 89 (cf. below), larger line ratios are found in objects with higher . This is to first order understood by the more rapid decline of the ionizing luminosity with increasing metallicity, whereas the increase of the W-R population is less important (SV98). These findings favor the picture of short burst periods (compared to the lifetime of massive stars) and support the predicted dependence of the ionizing population with metallicity found independently from other studies García-Vargas et al. (1995); Stasińska & Leitherer (1996).
W-R signatures are observed at equivalent widths where the models indeed predict W-R stars. Although this is not a strong constraint it indicates that the –age chronometer is reasonably synchronised to first order. Some difference seems, however, to be present for the appearance of WC signatures (see also Fig. 12). Given the uncertainty (b) in the models, this difference is not significant (see below).


Comparing the individual objects (classified by metallicity) with the model predictions, we find the following:
NGC 3049 ()
The predictions of the standard model (instantaneous burst, Salpeter IMF) for the high metallicity region in NGC 3049 show an excellent agreement with all observed W-R line strengths. This is also the case for the C iii 5696 feature (not shown here) which is only detected in NGC 3049.
He 2-10 ()
For He 2-10 the comparison between the equivalent widths and the line ratios shows a somewhat different picture. While the observed equivalent widths are considerably smaller than the maximum value predicted by the models (for the corresponding ), the relative line intensities are close to the predicted maximum. This difference can be attributed to the mismatch between gaseous and stellar emission (cf. (i)) seen in Fig. 1, although other explanations (e.g. leakage of photons) cannot be ruled out. Assuming that effect (iii) is small (cf. below) we conclude from the comparison of the W-R equivalent widths (Fig. 11) that the W-R and O star populations are compatible with an instantaneous burst and a Salpeter IMF. The same conclusion was already reached by Schaerer Schaerer (1996) based on the observations of VC92.
NGC 3125, NGC 5253 and Tol 89 ()
Only some of the observed W-R line intensities and equivalent widths lie well on the predicted model curves plotted in Figs. 10 and 11. NGC 5253 represents the best case Schaerer et al. (1997). For the considered objects we dispose in total of 15 measurements of broad emission lines (all lines and all regions). The relative line intensity of 7 data points is above the maximum value predicted by the standard model. On the other hand the majority (12 of 15) of the equivalent widths are well in the range of the model predictions. The three remaining cases are He ii 4686 of NGC 3125-A and Tol 89, which could well be overestimated due to nebular contamination and contributions from other lines in the blended region, and an exceptionally large C iv 5808 in Tol 89 (cf. below).
The uncertainties affecting the observed quantities have been discussed above (Sect. 5.1). Only for Tol 89 we have direct evidence that effect (i) (displacement gas–stars) is likely of importance (Sect. 3); this does, however, not exclude that the line intensities in some other objects are also affected. Even after reducing by a factor 1.4 due to effect (ii), discrepancies in the line intensities remain. The observed W-R equivalent widths are mostly within the predicted range, although the observed values could be underestimated due to effect (iii). We feel, however, that our measurements are only weakly affected by the old stellar populations (see Sect. 5.1). Other possibilities to explain the observations of some regions with large W-R/ intensities and large may e.g. be a flatter IMF. These are discussed in Sect. 5.3.
Regarding the signatures essentially attributed to WC stars (i.e. N iii 4640+ C iii 4650, C iv 5808) we note a shift in between the observed and predicted equivalent widths (bottom panels of Fig. 11, and Fig. 12). The shift looks as if WC stars appeared to early and/or did not remain alive long enough. Possible explanations for this “chronometer-shift” are: effects (i), (b), (d), or variations in the burst duration, IMF, etc. (see Sect. 5.3). The uncertainties in the interpolation techniques determining the number of WC stars ((b)) seem large enough to explain this effect.
For Tol 89 we measure an extraordinarily strong C iv 5808 emission (, 12 Å) which exceeds the values shown Figures 11 and 12. The other W-R emission lines do not show any particularity compared to the other regions at . We have no simple explanation for this strong emission. Other observations are required to confirm the measurements for Tol 89.
5.3 Age, duration and IMF of starbursts

The mere detection of W-R signatures in the integrated spectrum of galaxies reveals the presence of stars with ages generally between 1 and 8 Myr (Meynet, 1995; SV98), depending on the metallicity. These predictions, based on single star evolutionary models, apply for stars which have undergone “normal” mass loss. The possibility of additional mass loss through Roche-lobe overflow in a close binary system is not considered here Cerviño et al. (1996); Schaerer & Vacca (1996); Vanbeveren et al. (1997); Schaerer & Vacca (1998); Cerviño (1998). An independent age estimate is obtained from . From our standard models at the appropriate metallicity, we obtain ages between 3 and 6 Myr, which are reported in Table 3 (column 2) for each starburst region. As mentioned earlier these ages agree well with age range predicted for the W-R phase by the SV98 models at the appropriate metallicity and give some support to –age relation.
Models with different burst durations are plotted in Fig. 12. These show that, within reasonable assumptions for the IMF slope, the duration of star formation episode is limited to Myr. From Fig. 12 and taking into account effect (iii) this is a conservative limit; longer durations are clearly excluded from this basis (see also Sect. 5.4). This quantitative estimate is compatible with most studies of W-R galaxies which have so far clearly favoured instantaneous burst scenarios Kunth & Sargent (1981); Arnault et al. (1989); Vacca & Conti (1992); Meynet (1995); Schaerer (1996).
What can be said about the IMF slope? As mentioned earlier the observations of the W-R features in NGC 3049, He 2-10, and NGC 5253 are quite compatible with a Salpeter IMF. However, the large observed values of in NGC 3125-A and Tol 89, and in Tol 89 (representing in principle already lower limits due to (iii)) may require more W-R stars. This can be obtained by invoking a flatter IMF, which increases the WR equivalent widths as shown in Fig. 12 . However, we note that intrinsicly the model predictions for He ii 4686 are not very sensitive to changes of the IMF slope. More IMF-sensitive are the features of WC stars, which descend on the average from more massive predecessors than WN stars and from a narrower range of initial masses.
Although the standard models show some deficiencies it is difficult to claim significant differences with respect to a Salpeter IMF for the following reasons: 1) The He ii 4686 predictions are not very sensitive to the IMF slope. Furthermore the prediction of this line is uncertain (see (c), and the observed line may also be contaminated by nebular emission (e.g. in NGC 3125-A, Sect. 4.5). 2) Most of the WC signatures from the discrepant objects are within the range of the model predictions for a Salpeter IMF. We therefore conclude that within the uncertainties our observations are compatible with a Salpeter IMF. Although we cannot exclude this possibility, no clear case requiring a significantly flatter IMF is found. Much steeper IMF slopes may, however, not be compatible with our data.
Regarding the set of stellar tracks (cf. (a)) we note that the present results are only obtained for the stellar evolution models of Meynet et al. Meynet et al. (1994) adopting high mass loss rates. Significantly lower equivalent widths of He ii 4686 (approximately factor ), N iii 4640+ C iii 4650 (), and C iv 5808 () are obtained with the standard mass loss models due to the reduced WN and WC populations Meynet (1995). As mentioned before the high mass loss models are favoured by several independent comparisons with individual W-R stars and populations in the Local Group Maeder & Meynet (1994). This justifies their use when analysing massive star populations in extra-galactic objects.

5.4 On the influence of R136 like stars on spectra of W-R galaxies
We shall now briefly digress and investigate how robust the above results (especially the burst duration) are in view of recent studies of massive stars in R136 and the Galactic Hii region NGC 3603. HST observations of these regions show the presence of very young ( 2 Myr) stars with considerably strong He ii 4686 emission (Drissen et al., 1995; de Koter et al., 1997). Although their exact spectral types are still under debate (e.g. Crowther & Dessart, 1998) quantitative analysis indicate that these stars are likely massive hydrogen-burning stars which are less evolved than typical WN stars (de Koter et al., 1997; Crowther & Dessart, 1998). According to the criteria used to define W-R stars, traditional synthesis models would most likely miss to count such stars as W-R and hence their He ii 4686 emission would not be included. If such stars are common in young star forming regions, the He ii emission predicted by the models would thus be underestimated. Could the presence of such emission line stars relieve the need to invoke very short star formation timescales ?
To answer this question we investigated the effect of “R136-like” stars on the interpretation of W-R galaxy spectra, by performing test calculations (see Fig. 13). To account to first order for He ii 4686 emission from fairly unevolved stars (OIf and “R136-like” stars), we have assumed that all main-sequence stars with initial masses 80 M⊙ (cf. de Koter et al., 1997; Crowther & Dessart, 1998) show a He ii emission with . This should provide an upper limit for the emission from “R136-like” stars222SV98 included a contribution of ergs s-1 from main-sequence stars with low gravity. For the three most luminous stars of R136 and NGC 3603, the average 4686 luminosity is, however, larger: ergs s-1 (Crowther, 1997 and Drissen, 1997, private communications; de Koter 1996, private communication gives lower by approximately a factor of 2) similar to WNL stars (see SV98)..
Figure 13 shows that, fairly independently of the star formation history, the expected increase of He ii 4686 due to the additional He ii emitters is found only at () Å. At lower equivalent widths the differences with the “standard model” are quite small (cf. Fig. 12). If a general phenomenon, the existence of “R136-like stars” may thus help to explain the observations of He ii 4686 only in regions with large equivalent widths. Our observations of W-R galaxies (see Fig. 12 and Table 2) and those of VC92 are mostly found at () Å. For these objects, the He ii 4686 requires fairly short burst (see Fig. 12 and Fig. 2 of Schaerer 1996). In any case “R136-like” stars cannot explain the observed N iii 4640+C iii 4650 and C iv 5808 emission which also requires short burst durations as discussed above. Other independent arguments against extended star formation in the observed W-R galaxies are discussed below.
6 Summary and conclusions
The main result of the present paper is the unambiguous detection of WC stars (indicated by broad C iv 5808 emission) in five previously known W-R galaxies, defined by broad He ii 4686 emission mostly due to WN stars (Sect. 4.4). We confirm the presence of WC stars in He 2-10 indicated by VC92. With our four new detections (in NGC 3125, NGC 5253, Tol 89, and NGC 3049) the total number of extragalactic objects known to harbour both WN and WC stars is now 19 (cf. Schaerer & Contini 1998), which represent only 20% of the total sample of W-R galaxies. The relative weakness of C iv 5808 compared to He ii 4686 ( typically) and its larger width requires sufficiently high S/N ( 40) to be detected. As already pointed out by Schaerer et al.Schaerer et al. (1997) this explains most likely the non-detection in previous observations.
In all objects broad lines of N iii 4640+ C iii 4650, He ii 4686, and C iv 5808 are measured (Sect. 4.4). A marginal detection of He ii 5412 is found in two W-R regions; weak C iii 5696 indicative of late WC stars is found in the high metallicity W-R region of NGC 3049. From these emission lines we conclude that all W-R regions (except NGC 3049) contain a mixed population of WNL, and early WC and/or WO3-4 stars. This agrees well with expectations (e.g. Maeder, 1991; SV98).
We have performed a detailed spatial analysis of the nebular and W-R emission lines and the continuum light along the slit position in all our objects (Sect. 3). In He 2-10 and Tol 89 we found multiple peaks of nebular emission and a spatial offset between the main peak and the stellar continuum. These structures are likely due to the existence of bubbles and loops in the ISM powered by the kinetic energy released by massive stars (stellar winds and/or SNe, see Sect. 4.6). The spatial distribution of W-R stars follows closely the continuum and no significant distinction is found between WN and WC stars. The only exception is a bright He ii 4686 peak with no continuum and nebular counterpart found in NGC 5253 Schaerer et al. (1997). Its origin is still unclear.
From the luminosity of the W-R signatures we have estimated the absolute number of W-R stars of the different subtypes (Sect. 4.5). For the regions whose luminosities vary approximately up to a factor of 20 the total W-R star content varies from 30 to 1500. The estimated WC/WN number ratios (lower limits) are between 0.15 – 0.65, with typical values between 0.2 – 0.4 and no clear trend with metallicity. For our objects with metallicities Z⊙, these values are larger than the observed WC/WN ratios in Local Group objects with similar Massey & Johnson (1998). We argue that our WC/WN values are compatible with expectations for regions of short star formation. For He 2-10 and NGC 3049 the derived WC/WN ratio is below the trend given by Massey & Johnson Massey & Johnson (1998). This can have several explanations: 1) a short burst is observed at a particular time (quite low probability), 2) the number of WC stars is systematically underestimated (see Sect. 4.5). The solution awaits new observations and quantitative analysis of “WC+WN galaxies” of different metallicities.
The detection of emission in the “traditional” blue W-R bump yields useful information about the age of the stellar population and the presence of massive stars (cf. Sect. 5). Above this, detecting both WN and WC features provides a considerable improvement for the following reason: WC stars are strongly evolved descendents of massive stars revealing He-burning products on their surface; prior to this phase these objects are WN stars showing H-burning products (e.g. Maeder & Conti 1994). Given this WN WC sequence, which is expected to be followed only by the most massive WN stars, it is clear that the predictions of WC/WN populations are particularly sensitive to the evolutionary scenario and burst parameters (e.g. IMF, burst duration). In Sect. 5 we have exploited this fact by performing detailed comparisons of three different observational W-R signatures from WC and WN stars with predictions from the recent synthesis models of SV98.
The comparisons of the observed equivalent widths and line intensities relative to with models do not all show a simple picture. The most important effects and uncertainties which may affect such a comparison have been amply discussed in Sect. 5. Some W-R signatures in few regions exceed the predicted relative intensities and/or equivalent widths. The majority of the observed quantities (N iii 4640+C iii 4650, He ii 4686, C iv 5808, and ) can, however, be reproduced reasonably well by the SV98 models with a Salpeter IMF. Although some W-R lines may indicate a flatter IMF in some regions, no clear case requiring a significantly flatter IMF is found. Much steeper IMF slopes may, however, not be compatible with our data. These results are in agreement with other studies of similar objects (e.g. Mas-Hesse & Kunth 1991, 1998; Schaerer 1996; Leitherer 1998).
In order to reproduce the W-R lines, young populations with short durations of star formation are required. From our quantitative modeling, we find a conservative limit for burst durations of typically Myr. A simple experiment shows that this result holds even if very young massive emission line stars such as found in R136 and NGC 3603 are common in our observed star-forming regions. Such short star formation timescales can be understood if the light observed in our W-R regions comes from one or few individual compact regions, such as the super-star clusters frequently identified on high resolution HST images (e.g. Conti & Vacca, 1994; Meurer et al., 1995). The finding of young and short bursts is supported by other independent constraints from Hii galaxies which have very similar properties to our W-R galaxies, such as the observed spread of () and variations of nebular line ratios Stasińska & Leitherer (1996).
Last, but not least, we also note from our comparison with starburst models that it is not possible to reproduce the observed WN and WC signatures adopting evolutionary models using standard mass loss rates. The high mass loss models of Meynet et al.Meynet et al. (1994) are clearly favoured from our comparison (see also Maeder & Meynet, 1994). A similar conclusion was obtained from comparisons of new evolutionary tracks with the observed W-R population in the extremely metal-poor galaxy I Zw 18 De Melló et al. (1998), showing the usefulness of such observations to constrain evolutionary scenarios in environments (i.e. extreme metallicities) inaccessible in the Local Group.
Our successful finding of WC stars in W-R galaxies opens the door to new systematic studies of massive star populations in starbursts. In addition to the subjects addressed in the present paper the study of WC stars in starburst regions is of interest for several other reasons: 1) WC stars may contribute to a harder ionizing spectrum which has implications on the observed nebular properties (e.g. Terlevich & Melnick 1985, Schaerer 1996). 2) Regions which harbour WC stars during their lifetimes are expected to produce ejecta of significantly different composition (cf. Maeder 1992). Our understanding of stellar evolution, chemical evolution and the starburst phenomenon should greatly benefit from such future studies.
Acknowledgements.
We thank Bill Vacca for providing us with spectra of W-R galaxies for comparisons and the referee, Peter Conti, for his positive comments. We also benefited from fruitful discussions with Roger Coziol, Miguel Mas-Hesse, Georges Meynet, and Maximilien Pindao and from comments on earlier versions of the manuscript. DS acknowledges support from the Swiss National Foundation of Scientific Research. This research has made use of the Lyon-Meudon Extragalactic Database (LEDA) supplied by the LEDA team at the CRAL-Observatoire de Lyon (France).References
- Aitken & Roche (1984) Aitken D.K., & Roche P.F., 1984, MNRAS 208, 751
- Allen (1995) Allen S.W., 1995, MNRAS 276, 947
- Allen et al. (1976) Allen D.A., Wright A.E., & Goss W.M., 1976, MNRAS 177, 91
- Armus et al. (1988) Armus L., Heckman T., Miley G.K., 1988, ApJ, 326, L45
- Arnault et al. (1989) Arnault Ph., Kunth D., & Schild H. 1989, A&A 224, 73
- Bouchet et al. (1985) Bouchet P., Lequeux J., Maurice E., Prevot L., & Prevot-Burnichon M.L., 1985, A&A 149, 330
- Burstein & Heiles (1984) Burnstein D., & Heiles C., 1984, ApJS 54, 33
- Calzetti (1997) Calzetti D., 1997, AJ 113, 162
- Calzetti et al. (1997) Calzetti D., Meurer G.R., Bohlin R.C., Garnett D.R., Kinney A.L., Leitherer C., & Storchi-Bergmann T., 1997, AJ 114, 1834
- Campbell et al. (1986) Campbell A., Terlevich R., & Melnick J., 1986, MNRAS 223, 811
- Cardelli et al. (1989) Cardelli J.A., Clayton G.C., & Mathis J.S., 1989, ApJ 345, 245
- Castor et al. (1975) Castor J., McCray R., & Weaver R., 1975, ApJ 200, L107
- Cerviño (1998) Cerviño M., 1998, PhD thesis, Universidad Complutense de Madrid, Spain
- Cerviño et al. (1996) Cerviño M., Mas-Hesse M., & Kunth D., 1996, in “W-R stars in the Framework of Stellar Evolution”, Eds. J.M. Vreux et al., Liège: Univ. Liège, p. 613
- Conti (1991) Conti P.S., 1991, ApJ 377, 115
- Conti & Vacca (1994) Conti P.S., & Vacca W.D., 1994, ApJ 423, L97
- Contini et al. (1997) Contini T., Wozniak H., Considère S., & Davoust E., 1997, A&A 324, 41
- Copetti et al. (1986) Copetti M.V.F., Pastoriza M.G., Dottori H.A., 1986, A&A 156, 111
- Corbin et al. (1993) Corbin M.R., Korista K.T., & Vacca W.D., 1993, AJ 105, 1313
- Crowther & Dessart (1998) Crowther P.A., & Dessart L., 1998, MNRAS 296, 622
- Crowther et al. (1998) Crowther P.A., De Marco O., & Barlow M.J., 1998, MNRAS 296, 367
- de Koter et al. (1997) de Koter A., Heap S.R., Hubeny I., 1997, ApJ 477, 792
- De Melló et al. (1998) de Melló D., Schaerer D., Heldmann J., & Leitherer C., 1998, ApJ, in press (astro-ph/9805342)
- Dinerstein & Shields (1986) Dinerstein H.L., & Shields G.A., 1986, ApJ 311, 45
- Drissen et al. (1995) Drissen L., Moffat A.F.M., Walborn N., & Shara M.M., 1995, AJ 110, 2235
- Durret et al. (1985) Durret F., Bergeron J., & Boksenberg A., 1985, A&A 143, 347
- Edmunds & Pagel (1984) Edmunds M.G., & Pagel B.E.J., 1984, MNRAS 211, 507
- Fitzpatrick (1986) Fitzpatrick E.L., 1986, AJ 92, 1068
- García-Vargas et al. (1995) García-Vargas M.L., Bressan A., & Díaz A.I. 1995, A&AS 112, 13
- García-Vargas et al. (1997) García-Vargas M.L., González-Delgado R.M., Perez E., Alloin D., Díaz A.I., & Terlevich E., 1997, ApJ 478, 112
- González-Delgado et al. (1994) González-Delgado R.M., et al., 1994, ApJ 437, 239
- Heckman et al. (1997) Heckman T.M., González-Delgado, R., Leitherer C., Meurer G.R., Krolik J., Wilson A.S., Koratkar A., & Kinney A., 1997, ApJ 482, 114
- Hutsemekers & Surdej (1984) Hutsemekers D., & Surdej J., 1984, A&A 133, 209
- Izotov et al. (1994) Izotov Y.I., Thuan T.X., & Lipovetsky V.A., 1994, ApJ 435, 647
- Izotov et al. (1997) Izotov Y.I., Foltz C.B, Green R.F., Guseva N.G., & Thuan T.X. 1997, ApJ 487, L37
- Kawara et al. (1989) Kawara K., Nishida M., & Phillips M.M., 1989, ApJ 337, 230
- Kobulnicky et al. (1995) Kobulnicky H.A., Dickey J.M., Sargent A.I., Hogg D.E., & Conti P.S., 1995, AJ 110, 116
- Kobulnicky & Skillman (1996) Kobulnicky H.A., & Skillman E.D., 1996, ApJ 471, 211
- Kobulnicky et al. (1997) Kobulnicky H.A., Skillman E.D., Roy J.-R., Walsh J.R., & Rosa M.R., 1997, ApJ 477, 679
- Kunth & Joubert (1985) Kunth D., & Joubert M., 1985, A&A 142, 411
- Kunth & Sargent (1981) Kunth D., & Sargent W.L.W., 1981, A&A 101, L5
- Kunth & Sargent (1983) Kunth D., & Sargent W.L.W., 1983, ApJ 273, 81
- Kunth & Schild (1986) Kunth D., & Schild H., 1986, A&A 169, 71
- Kunth et al. (1998) Kunth D., Mas-Hesse J.M., Terlevich E., Terlevich R., Lequeux J., & Fall S.M., 1998, A&A 334, 11
- Legrand et al. (1997a) Legrand F., Kunth D., Mas-Hesse J.M., & Lequeux J., 1997a, A&A 326, 929
- Legrand et al. (1997b) Legrand F., Kunth D., Roy J.-R., Mas-Hesse J.M., & Walsh J.R., 1997b, A&A 326, L17
- Leitherer (1990) Leitherer C., 1990, ApJS 73, 1
- Leitherer (1998) Leitherer C., 1998, in “Dwarf Galaxies and Cosmology”, Eds. T.X. Thuan, C. Balkowski, V. Cayette, J. Tran Than Van, Editions Frontieres (Gyf-sur-Yvette, France), in press
- Leitherer & Heckman (1995) Leitherer C., & Heckman T.M., 1995, ApJS 96, 9
- Maeder (1991) Maeder A., 1991, A&A 242, 93
- Maeder (1992) Maeder A., 1992, A&A 264, 105
- Maeder & Conti (1994) Maeder A., & Conti P.S., 1994, ARA&A 32, 227
- Maeder & Meynet (1994) Maeder A., & Meynet G., 1994, A&A 287, 803
- Marlowe et al. (1995) Marlowe A.T., Heckman T.M., Wyse R.F.G., & Schommer R., 1995, ApJ 438, 563
- Mas-Hesse & Kunth (1991) Mas-Hesse J.M., & Kunth D. 1991, in Wolf-Rayet Stars and Interrelations with Other Stars in Galaxies, IAU Symp. 143, eds. K. A. van der Hucht, & B. Hidayat, (Dordrecht: Kluwer), p. 613
- Mas-Hesse & Kunth (1998) Mas-Hesse J.M., & Kunth D. 1998, A&A, in preparation
- Massey & Johnson (1998) Massey P., & Johnson O., 1998, ApJ 505, 793
- Meurer et al. (1995) Meurer G.R., Heckman T.M., Leitherer C., Kinney A.L., Robert C., & Garnett D.R., 1995, AJ 110, 2665
- Meyer (1985) Meyer J.-P., 1985, ApJS 57, 173
- Meynet (1995) Meynet G., 1995, A&A 298, 767
- Meynet et al. (1994) Meynet G., Maeder A., Schaller G., Schaerer D., & Charbonnel C., 1994, A&AS 103, 97
- Osterbrock & Cohen (1982) Osterbrock D.E., & Cohen R.D., 1982, ApJ 261, 64
- Penston et al. (1977) Penston M.V., Fosbury R.A.E., Ward M.J., & Wilson A.S., 1977, MNRAS 180, 19
- Phillips & Conti (1992) Phillips A.C., & Conti P.S., 1992, ApJ 395, L91
- Saha et al. (1995) Saha A., Sandage A., Labhardt L., Schwengeler H., Tammann G.A., Panagia N., & Machetto F.D., 1995, ApJ 438, 8
- Sargent & Filippenko (1991) Sargent W.L.W., & Filippenko A.V., 1991, AJ 102, 107
- Sauvage et al. (1997) Sauvage M., Thuan T.X., & Lagage P.O., 1997, A&A 325, 98
- Schaerer (1996) Schaerer D. 1996, ApJ 467, L17
- Schaerer & Contini (1998) Schaerer D., & Contini T., 1998, A&A, in preparation
- Schaerer et al. (1997) Schaerer D., Contini T., Kunth D., & Meynet G., 1997, ApJ 481, L75
- Schaerer & Vacca (1996) Schaerer D., & Vacca, W.D., 1996, in “W-R stars in the Framework of Stellar Evolution”, Eds. J.M. Vreux et al., Liège: Univ. Liège, p. 641 (astro-ph/9609192)
- Schaerer & Vacca (1998) Schaerer D., & Vacca, W.D., 1998, ApJ, 497, 618 (SV98)
- Seaton (1979) Seaton M.J., 1979, MNRAS 187, 73P
- Smith et al. (1990) Smith L.F., Shara M.M., & Moffat A.F.J., 1990, ApJ 358, 229
- Stasińska & Leitherer (1996) Stasińska G., & Leitherer C. 1996, ApJS 107, 66
- Sugai & Taniguchi (1992) Sugai H., & Taniguchi Y., 1992, AJ 103, 1470
- Terlevich & Melnick (1985) Terlevich R., Melnick J., 1985, MNRAS 213, 841
- Terlevich et al. (1991) Terlevich R., Melnick J., Masegosa J., Moles M., & Copetti M.V.F., 1991, A&AS 91, 285
- Thuan, Izotov & Lipovetsky (1996) Thuan T.X., Izotov Y.I., & Lipovetsky V.A., 1996, ApJ 463, 120
- Vacca & Conti (1992) Vacca W.D., & Conti P.S., 1992, ApJ 401, 543 (VC92)
- Vanbeveren et al. (1997) Vanbeveren D., Van Bever J., & De Donder E., 1997, A&A 317, 487
- Walsh & Roy (1989) Walsh J.R., & Roy J.-R., 1989, MNRAS 239, 297