Evidence for ionized reprocessing in the X-ray spectrum of the Seyfert 1 Galaxy 1E 1615+061
Abstract
The Seyfert 1 galaxy 1E 1615+061 was observed to display a very steep () and intense soft X-ray spectrum during a HEAO-1 A2 observation in the 1978. Such an exceptionally soft X-ray state has never been observed subsequently, but the source has continued to exhibit a large (up to a factor 6) range of X-ray intensity variability. The overall UV/X-ray spectrum of this source, observed during a multiwavelength campaign in 1991–1992, can be well fit with a self-consistent, low- accretion disk model. In this model, the soft X-rays result were suggested to arise from reflection of the nuclear emission by mildly ionized () material in the inner regions of the disk. In this Paper we report the results of an ASCA observation in 1995 August, which give a direct confirmation of such a scenario. The spectrum may be modeled as a power-law with a photon index of 1.8, together with absorption consistent with the galactic line of sight value, substantial reflection from ionized material and an iron fluorescent Kα emission line. The centroid energy (6.6–6.8 keV) implies a ionization stage Fexix. The line profile is consistent with that expected from a kinematically and gravitationally distorted line around a black hole. These results provide the first direct evidence for the existence of considerable amount of ionized material around the nucleus of a “broad” Seyfert 1 galaxy.
Key Words.:
X-ray: galaxies – Galaxies:Seyfert – Galaxies:individual:1E 1615+061 – accretion disks1 Introduction
In many Seyfert 1 galaxies and radio-quiet quasars, the extrapolation of the intermediate (2–10 keV) X-ray emission to the soft (0.1–2 keV) energy range reveals evidence for the presence of soft excesses. These soft excesses are generally well correlated with the optical/UV emission bumps. This supported the hypothesis that they are the same spectral component (Walter & Fink 1993; Puchnarewicz et al. 1996; Laor et al. 1997), probably thermal emission from an accretion disk (Czerny & Elvis 1987). Attempts to fit disk models to the optical/UV spectra of single objects have been generally successful (Laor 1990; Bechtold et al., 1994; Kuhn et al. 1995), but have been unable to significantly constrain the emission process due to the large number of free parameters. On the other hand, multiwavelength and/or sample studies generally fail to reproduce the energy spectrum predicted by disk models (Ulrich & Molendi 1995; Laor et al. 1997). Moreover, the good correlation between the optical and UV variations observed from some Seyfert galaxies (Peterson et al. 1991; Clavel et al. 1991) argues against the UV originating from thermal emission in an accretion disk.
An alternative possibility is to explain the soft and hard X-ray emission in a common framework. The key concept is reprocessing. There is good observational evidence that the primary continuum emitted in the nuclear regions of active galaxies is strongly reprocessed by optically thick matter surrounding a supermassive black hole. The strongest evidence comes from the discovery of a “Compton bump” and fluorescent Kα emission features from neutral or mildly ionized iron in the spectra of a number of Seyfert 1 galaxies (Pounds et al. 1990; Piro et al. 1990; Nandra & Pounds 1994). The discovery of the gravitationally and kinematically distorted profile of the iron line in a deep ASCA observation of the Seyfert 1 galaxy MCG-6-30-15 (Tanaka et al. 1995), and the general evidence that iron lines in Seyfert 1 galaxies are indeed broad (Nandra et al. 1997a) indicates that the iron line emitting region is located close to the black hole.
An accretion disk can be an effective low-energy reflector if it is substantially ionized (Matt et al. 1993; Życky et al. 1994). This may provide a clue to link the hard X-rays and the soft X-ray excesses. A hardening of the spectrum above a few keV (Matt et al. 1993; Życki et al. 1994) and iron lines corresponding to He- or H-like states (Matt et al. 1993; Życki & Czerny 1994) are clear signatures of an ionized disk. There is currently no compelling evidence for ionized iron lines in the “broad-line” Seyfert 1s (Nandra et al. 1997a), but there is growing evidence for them in the spectra of Narrow Line Seyfert Galaxies (NLSy1, Comastri et al. 1998; Turner et al. 1998), and intermediate luminosity quasars (Nandra et al. 1996).
The Seyfert 1 Galaxy 1E 1615+061 () is one of the few objects where the spectral and temporal behavior from UV and X-ray observations can be self-consistently explained by an ionized accretion disk. The soft X-ray spectrum of 1E 1615+061 is highly variable, both in intensity and spectral shape. The source was discovered during the all sky survey by the Low Energy Detectors on board HEAO-1 and was identified with a Seyfert 1 galaxy with an unusually steep (photon index ) and intense [ erg cm-2 s-1] X-ray spectrum following Einstein IPC and HRI observations (Pravdo et al. 1981). The source was observed by EXOSAT to be in a 100 times fainter state than observed by HEAO-1 (Piro et al. 1988). The EXOSAT spectrum was similar to that of other Seyfert galaxies. Piro et al. (1988) suggested that this behavior could be explained in terms of an highly variable soft X-ray excess, which dominates the emission at high luminosities. A campaign of simultaneous observations using ROSAT and IUE and nearly-simultaneously with Ginga (Piro et al. 1997, Paper I) as well as a ROSAT observation in 1992, found the source at an intensity 6 times brighter than observed by EXOSAT (although still much fainter than at the time of the HEAO-1 observation). These observations confirmed the presence of a variable soft excess, whose relative strength compared to the underlying power-law increases with luminosity. Self-consistent accretion disk models can reproduce the observed multiwavelength spectra in a low accretion rate regime (0.03–0.1), where the soft X-rays are dominated by reflection from the mildly ionized regions of the disk. Interestingly, such a model left positive residuals in the 0.5–0.8 keV ROSAT Position Sensitive Proportional Counter spectrum, which can be fit by an emission line with a centroid energy keV and an equivalent width eV. Such a feature is consistent with Kα fluorescent emission from O vii or O viii (Paper I).
If this scenario is true and the ionizing flux is not lower than in the state observed by ROSAT, a continuum component above a few keV (Życki et al. 1994) and ionized iron fluorescent lines (Matt et al. 1993; Życki & Czerny 1994) are expected in the 1–10 keV spectrum. The ASCA scientific payload has moderately good energy resolution at the energy of the iron lines ( at 6 keV) and good sensitivity in the whole 0.5–10 keV band. A search for these features was the motivation behind an ASCA observation, and in this Paper the relevant results are presented.
2 Observation and data Reduction
1E 1615+061 was observed by ASCA (Tanaka et al. 1994; Makishima et al. 1996) between 1995 August 20 12:22 UT and August 21 08:03 UT. The ASCA scientific payload consists of a pair of CCD cameras (Solid-state Imaging Spectrometer, SIS), which is sensitive in the energy range 0.4–10 keV, and a pair of gas scintillating proportional counters (Gas Imaging Spectrometer, GIS), sensitive in the 0.6–10 keV energy range. SIS data were acquired in the 2-CCD FAINT mode and converted to BRIGHT mode for scientific analysis. GIS data were telemetred in the default PH mode. Standard selections were applied to the data to avoid Earth occultation (angle between the pointing direction and the Earth’s limb ), the bright Earth (angle between pointing direction and day-night terminator ) and particle (momentum associated with Geomagnetic cut-off rigidity ) contamination. Additionally, data obtained within 32 s after any South Atlantic Anomaly passages were discarded. SIS grade 0, 2, 3 and 4 data were used. Scientific products were extracted from circular regions of 4’ and 6’ radii for the SIS and GIS, respectively. Background subtraction was performed both with spectra extracted from source free regions of the same field of view, or from blank sky event files from the same detector extraction region as the source. The two methods give results consistent within the statistical uncertainties. The “field of view” and “blank sky” backgrounds were chosen for the GIS and SIS spectral analysis, respectively. The “field-of-view” procedure is preferred for the GIS in order to avoid the known contamination in the blank sky field caused by the presence of the Seyfert 2 galaxy NGC 6552 (Fukazawa et al. 1994), which strongly reduces the area available for spectra extraction. The “blank sky” method was instead used for the SIS since significant source contamination occurs unless a very small extraction area (i.e.: ) is chosen. The energy range used for spectral analysis are 0.57–9 keV and 0.7–10 keV for the SIS and GIS, respectively. These were chosen to exclude low (i.e. ) effective area regions and SIS calibration problems around the K-edge of neutral oxygen (). The total effective exposure times after screening were 30, 29, 32.5 and 32.5 ks for SIS0, SIS1, GIS2 and GIS3, respectively.
Data reduction has been performed with Ftools 3.6 package; spectral analysis made use of Xspec 9.0. Version 4.0 of the GIS publicly available redistribution matrices has been employed. All energies are quoted in the source rest frame and uncertainties are given at 90% level of confidence for one interesting parameter (), unless otherwise specified.
3 Timing analysis
Figure 1 shows broadband SIS0 and GIS2 light curves.

An overall increase in count rate by a factor during the s observation is evident. We searched for spectral changes associated with this variation by studying the hardness ratio (HR) between the counts in the 0.7–4 keV and 4–9 keV bands (these energy ranges were chosen to sample different spectral components, see Sect. 4). The HR light curve shows no significant variations and the for a fit with a constant straight line is 14.6 for 14 degrees of freedom (dof). The light curve also displays significant variability episodes on much shorter time scales. Figure 2 illustrates two such events
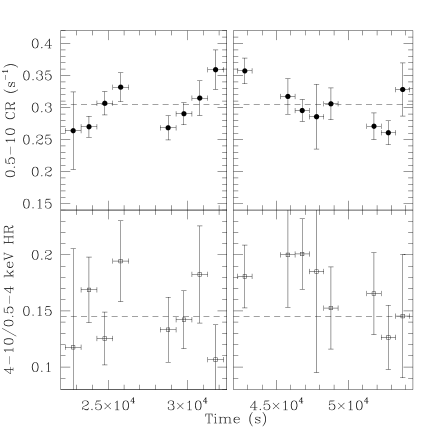
as they were observed by the SIS0 instrument. The implied minimum doubling/halving time is 1–3 s. The HR seems not to be strongly correlated with the total flux on short timescales (i.e.: a few s) either. Better than available statistics is however needed to confirm this suggestion.
4 Spectral analysis
The spectra of the four detectors were fit simultaneously, after checking that the results of fits using individual spectra are consistent within the statistical uncertainties. The data/model ratio is shown in Fig. 3

when a simple power-law model absorbed by cold matter is applied. A constant normalization factor between the SIS and GIS instruments was left as a free parameter during the initial fits, but it turned out to be consistent with unity () and it was not included in subsequent fits. The is unacceptable (781 for 659 dof) and is mainly due to a clear change in the spectral shape at energies 4 keV. This spectral hardening can be phenomenologically described using a broken power-law, with spectral indices and and a break energy keV to give a of 718 for 657 dof. The addition of an absorption edge with a threshold energy of 7.5 keV, or an emission line with a centroid energy of 6.58 keV improves the quality of the fit marginally ( and 3.0, respectively). This suggests that further spectral complexity is present in the 7–8 keV band. The 2–10 keV flux is erg cm-2 s-1, corresponding to a rest frame luminosity erg s-1. This is comparable to the level observed by Ginga five years earlier (Paper I).
Spectral hardening above a few keV in Seyfert 1 galaxies
has been interpreted
as the effects of a Compton reflected component arising from
the reprocessing of the nuclear continuum by optically thick matter
around the central black hole.
In the case of 1E 1615+061, this interpretation is further supported
by the suggestion that
reprocessing from a mildly ionized accretion disk is the most
likely explanation for the UV/soft X-ray emission when the source
was at a comparable luminosity level as in the ASCA observation (Paper I).
We have tested this hypothesis with the
Xspec model pexriv (Magdziarz & Zdziarski 1995),
which calculates in a self-consistent manner the spectrum produced via
Compton reflection of a power-law primary continuum
by a plane slab.
The model depends on several parameters. The inclination angle
between the line of sight and the normal to the slab has
been fixed to 30∘ (see a later discussion on the
iron line profile properties for a justification of this choice).
The iron abundance has been assumed cosmic.
The thermal and ionization state of the reflecting material is
parameterized through its temperature and the ionization
parameter ,
where is the incident luminosity,
the electron number density and the distance between
the primary
continuum source and the reflecting material.
The model is
too complex and the number of free parameters too large
for the available statistics.
If we allow both and to vary freely, they
are not significantly constrained by the data. That is unsurprising, since
varying both parameters affects the detailed shape of the spectrum
below the O vii edge
and above the iron k-edges (i.e. keV and
keV in the observer frame), where the effective
area of the ASCA detectors is low.
The possible presence of an emission line, consistent with
Kα fluorescence from Fe xxiii, suggests that
the temperature is as high as K,
provided that is in the range 60–300.
We have therefore fixed at
K. The corresponding
1 confidence interval on is
40–100.
Adding a narrow Gaussian emission line to the continuum
significantly improves the quality of the fit ().
The centroid energy is keV,
corresponding to an iron ionization stage xix.
The profile of the iron line is shown in Fig. 4.

The in the “ionized” case is better than in the case when the disk is assumed to be a priori “neutral” ( if is held fixed to zero, significant at 98.0% level). The improvement is even more significant when the emission line is included (, significant at 99.96% level). Moreover, the line best-fit parameters are only slightly affected by the details of the underlying continuum description, and therefore the evidence that the line indeed comes from highly ionized species of iron is rather robust. We therefore assume in the following that the continuum is well described by the combination of a directly observed power-law and a reflection spectrum from an ionized disk with K and . Table 1 summarizes the best-fit parameters and results for the reflection model fits.
| Model | EW | dof | |||||
| () | (keV) | (eV) | (eV) | ||||
wa*pexrav |
… | … | … | 732/657 | |||
wa*(pexrav+ga) |
0† | 726/656 | |||||
wa*pexriva
|
… | … | … | 726/657 | |||
wa*(pexriv+ga)a
|
0† | 712/655 | |||||
wa*(pexriv+ga)a
|
0.43† | 705/655 | |||||
wa*(pexriv+ga)b
|
6.97† | 715/656 | |||||
wa*(pexriv+ga+ga)a
|
0† | 705/654 | |||||
| 0† | |||||||
wa*(pexriv+diskline)a
|
… | 700/656 | |||||
| †held fixed | |||||||
| a fixed, | |||||||
| b, , both fixed | |||||||
Figure 5 shows the contour plot of R (the relative normalization between the reflected and primary continua normalizations) versus . At the

99% level of confidence for two interesting parameters, the reflection is stronger than expected by a plane-parallel infinite slab (i.e.: ), whereas lies in the range 1.74–1.9. The value of is in principle correlated with the inclination. However, if is fixed to values in the range 0–60∘ (reasonable for a Seyfert 1) the best-fit nominal values of vary correspondingly in the range 1.7–2.3, well within the statistical uncertainties. The absorption cold column density of cm-2 is consistent with the Galactic contribution along the line of sight to 1E 1615+061 ( cm-2, Dickey & Lockman 1990).
We also investigated whether the iron feature is consistent with multiple components or a broadened structure. Such features are expected if the emission region is located well within the gravitational field of a supermassive black hole. If the width of the line if left free, then there is a significant improvement in fit quality (), with keV and keV. However, such a high centroid energy implies that the iron should be almost fully in the He-like stage. We therefore performed a new fit fixing the disk parameters to the appropriate values (, K). The line centroid energy was fixed at 6.97 keV, corresponding to fluorescent emission from Fe xxvi. The is comparable to that given by the narrow line fit ( =717 for 656 dof). However, the best-fit width ( keV) and the equivalent width ( keV) are unplausibly high, while typical values for lines emitted by ionized disks are at most a few hundred eV (Matt et al. 1993). Unsurprisingly, the amount of reflection is more than a factor of 3 lower than in the models where the emission line is assumed to be narrow. We regard therefore such a solution as unphysical, the line profile adapting itself easily to the spectrum curvature change due to the underlying continuum hardening. If we employ an intrinsic width of 0.43 keV, equal to the average value measured in the Nandra et al. (1997a) sample, the line turns out to be slightly more ionized ( keV) and intense ( eV) than in the narrow line case.
Alternatively, the addition of a second narrow
Gaussian profile yields a marginally
significant improvement in fit quality ().
The best-fit parameters of this second component
are keV and
eV.
It is tempting to associate the second component with
the “red-horn” of a gravitationally- and dynamically- distorted Gaussian
profile. In order to test this hypothesis,
we fit the emission
complex with the diskline model.
The emissivity law coefficient was fixed at
-2 and the inner and outer radii of the emission region were set
to 10 and 40 Schwarzschild radii, following Paper I.
We assumed the inclination angles in the pexriv and
diskline models to be the same.
The resulting of 700 for 654 dof is better than the
double-Gaussian model. The rest energy of the line photons
corresponds to highly ionized iron ( keV)
and the EW is in the range 400–750 eV.
If the inclination angle
is left free to vary, a very marginal improvement of the quality of
the fit is achieved (). However,
we can set a 90% lower limit on the inclination angle of 22.5∘,
the other line and continuum parameters are only marginally affected
by its precise value.
The spectrum, best-fit model and residuals are shown in Fig. 6.

We also searched for the low energy emission line detected in ROSAT data (Paper I). Adding a further narrow Gaussian profile to our data does not produce any improvement in . If we fix the centroid energy at , the 90% confidence upper limit to the EW is 20 eV.
There are a number of other possible different mechanisms that could explain the spectral change observed 4 keV. A hard component leaking through a patchy absorber could produce a soft excess at energies below the cut-off corresponding to the absorbing matter density. However, fits using this model do not converge, and reduce to the single absorber case. If a blackbody component is added to the simple absorbed power-law a significant improvement of the fit is obtained (), but both the very hard photon index () and the rather high temperature () are hard to reconcile with our present understanding of physical processes in the nuclear region of AGN and with the available observational results on Seyfert 1 X-ray spectra.
5 Discussion
1E 1615+061 displays a very complex and extreme soft X-ray behavior, with intensity variations by one order of magnitude on a timescale of years (Pravdo et al. 1981; Piro et al. 1988). In Paper I, Piro et al. (1997) proposed that an ionized disk plays an important role in determining the soft X-ray spectrum of this source. A low ionization state disk would produce the very dim states observed, for instance, by EXOSAT. A mildly ionized disk () in a low accretion rate regime () could explain the intermediate states, as observed in the multiwavelength IUE-ROSAT-Ginga campaign (Paper I). In that observation, an emission line was discovered with a centroid energy consistent with Kα fluorescence from O vii or O viii. For higher accretion rates, the disk would become even more highly ionized and one could expect an ionized iron line to appear in the X-ray spectrum.
This prediction is nicely fulfilled by the detection of an iron emission line in the X-ray spectrum of 1E 1615+061 reported here. The centroid energy in the source rest frame is 6.6–6.8 keV and is formally inconsistent with emission from neutral or mildly ionized iron. The implied ionization stages correspond to Fe xix. It is the first time that a “warm” iron line has been detected in a “broad-line” Seyfert 1. Such a high ionization state can be achieved in a thermally stable disk, provided that the temperature is K and the ionization parameter lies between 60 and 500. In the above analysis, the lack of statistics and the limited ASCA bandpass prevent us leaving all the spectral parameters which characterize the physical state of the disk free. However, if we assume a temperature of K, turns out self-consistently to be . The line profile and continuum shape allow us to set a 90% lower limit of 22.5∘ on the inclination of the disk normal to the line-of-sight.
The observed EW of the line ranges between 300 and 600 eV, depending on the line model used. The observed combination of line centroid energy and EW is consistent with the ionized disk scenario provided that is the range 0.2–0.4. No emission line from ionized stages of oxygen is detected in the ASCA spectra, the upper limit to a 0.66 keV narrow line being inconsistent at the 1 level with the positive detection using ROSAT reported in Paper I. This is once again consistent with the ionized disk scenario. Under the proposed combination of ionization parameter and temperature, the oxygen atoms are expected to be fully stripped (Życki et al. 1994) and any relevant line would therefore disappear.
X-ray flux variations with a doubling time of a few thousand seconds have been discovered for the first time in 1E 1615+061. Usual light crossing arguments constraint the mass of the central accretor to be less than a few . This is in broad agreement with the spectral analysis results: and erg s-1 implying a central accretor mass of .
Coherently with with the iron line properties, the intermediate X-ray continuum of 1E 1615+061 is best modeled with a primary power-law, with photon index, , in the range 1.74–1.9, and a Compton reflection component from highly ionized matter. The relative normalization between the reflected and primary continua is higher than expected from a plane-parallel slab, subtending a angle from the central source. Several effects could account for this. The reflecting matter could be arranged in a warped geometry, or the primary radiation could be anisotropic and therefore the disk could see more flux than directed along our line of sight. In principle, the same effect could be produced by a lag in the response of the reflector to any changes in the ionizing flux, longer than the short-term variability 1E 1615+061 time scales. Since the average inferred from the ASCA data is 1, while the primary continuum increases by 40%, one has to assume that the reflector is responding to a brighter state that occurred before the ASCA observation started. No spectral hardening occurred during the s duration of the ASCA observation. The nuclear continuum should then be reproducing a very similar pattern of variability during the ASCA observation and during the previous brighter state. If this is indeed the case, the bulk of the reflecting matter should then be located cm from the nucleus, or for a black hole with a mass of . However, this conclusion is almost at odds with the evidence, again coming from the ASCA data, that the line is broad, as expected if it is produced in the immediate vicinity of a supermassive black hole (Matt et al. 1992). The indication that the Compton reflected component probably follows quasi-simultaneously the short-term (i.e.: a few s) variations of the primary flux (see Fig. 2) further supports the idea that the bulk of the ionized reflecting matter is located within gravitational radii from the nucleus.
The ASCA observation has provided the first simultaneous measure of the 1E 1615+061 spectral properties in the soft and intermediate X-ray energy bands. It impossible to directly compare the secular changes in the properties of the accretion flow/matter inferred from the oxygen and iron line properties with the contemporary luminosity of the ionizing continuum. If we compare the spectral shape measured by ROSAT and ASCA in the 0.5–2.5 keV energy band of overlap, the former turns out to be much steeper (, ). This effect is significantly higher than the well-known systematic higher steepness of ROSAT spectra in comparison with ASCA ones (Fiore et al. 1994; Iwasawa et al. 1998). This again is in good agreement with the expectation of the ionized reflection scenario (Matt et al. 1993), which predicts a flatter and more featureless spectrum in that band, for increasing values of . Moreover, the higher the accretion rate, the less prominent any soft X-ray excess should be, which is in good agreement with the lack of a strong soft excess in the ASCA observation (see Fig. 3). The soft X-ray state observed by ROSAT is more luminous than ASCA’s ( erg cm-2 s-1; erg cm-2 s-1). This apparent contradiction with the model expectations can be easily resolved if one assumes that the intermediate X-ray ionizing continuum was at the epoch of ROSAT observation about a factor of 3 higher than observed by ASCA. The dynamical range of the historical 2–10 keV flux is about 6 (see Paper I) and therefore of the required order of magnitude.
1E 1615+061 displayed an unusual soft state during part of the 1980s. The source detected by HEAO-1 exhibited a power-law with a photon index . The 0.5–4.5 keV flux was about a factor of five larger than observed in the same band by ASCA ( erg cm-2 s-1). In Paper I it was speculated that a highly ionized disk with an accretion rate close to the Eddington limit could explain the extremely high soft X-ray state observed by HEAO-1, due to the combined effects of bremsstrahlung emission from hot electrons produced by the ionizing continuum, of the reflected continuum and of the direct emission from the accretion disk. This seems not to be the case in the ASCA observation. The power-law photon index in the 0.7–4 keV band is , in good agreement with that typically observed in Seyfert 1 galaxies (Nandra et al. 1997a) and no further soft excess is required in addition to the reflected power-law model. However, a steeper and brighter soft X-ray emission can be obtained in this framework with an appropriate combination of slightly higher (, Życki et al. 1994: Paper I) and steeper intrinsic continuum.
An alternative explanation to obtain short “bursts” of accretion invokes instabilities in the disk. Such models have been proposed to explain the optical/UV variability in AGN (Siemiginowska & Czerny 1989) and the giant X-ray outburst in some NLSy1 (Grupe et al. 1995a,b). An instability at radial distance can determine a switch from a low to a high viscosity state and induce a rapid accretion phase, which decays over the viscous timescale s (Frank et al. 1975), where is the viscous parameter, is the accretion rate in units of g s-1, and cm). If we assume, following Matt et al. (1993), , and , it follows that years, what makes such a mechanism viable to account for the observed historical soft X-ray behavior of 1E 1615+061. The transient nature of near-Eddington accretion events has already been proposed as a possible explanation for the high dispersion in the distribution in soft X-ray selected AGN (Grupe et al. 1998).
In none of the objects of the Nandra et al. (1997a) sample of Seyfert 1s observed by ASCA is the centroid of the iron line inconsistent with emission from neutral or mildly ionized iron. However, an ionized iron emission line was detected in the NLSy1 TonS180 (Comastri et al. 1998; Turner et al. 1998). NLSy1 are characterized by steep soft X-ray spectra (Böller et al. 1996) and extreme soft X-ray variability (Böller et al. 1993, 1997; Grupe et al. 1995a,b; Forster & Halpern 1996). The former property bears a resemblance with the X-ray spectra of Galactic black hole candidates in their high and soft state, suggesting that soft X-rays in NLSy1 galaxies are produced by intrinsic emission from a quasi-Eddington accretion disk (Pounds et al. 1995). If this is indeed the case, the surface of the disk should be strongly ionized (Matt et al. 1993) and iron Kα fluorescent line from highly ionized iron species are expected. This scenario also explains naturally the clear anti-correlation between the soft X-ray spectral index and the width of the Hβ line (Böller et al. 1996). This relation would be the mirror of the scale law, which arises if the broad lines are produced in a virialized gas and the Broad Line Region size is determined uniquely by the nuclear luminosity. In this picture, the accretion rate is the only physical parameter, which determines both the X-ray and the optical properties. Unfortunately, no optical observation simultaneous with the extreme soft state observed in 1E 1615+061 by HEAO-1 exist. A spectrum taken two years later showed relatively broad Hβ ( km s-1; Pravdo et al. 1981). 1E 1615+061 could undergo transitions between “narrow” and “broad” Seyfert 1 states, driven by changes of its accretion rate from few tenths to quasi-Eddington values. Future simultaneous optical and X-ray monitoring of 1E 1615+061 are needed to test this intriguing hypothesis.
The most extreme example of soft X-ray variability in NLSy1s is IRAS 132243809, which exhibits variations up to a factor 57 in 2 days (Böller et al. 1997). The most convincing explanation for such a phenomenology is Doppler boosting, induced by relativistic motions in the inner regions of an accretion disk A boost factor of 5 for can be achieved if the system is seen at an inclination (Guilbert et al. 1983). This mechanism is in principle also viable to explain the exceptional X-ray soft states of 1E1615+061. However, the much steeper spectrum observed by HEAO-1 remains to be explained, and the interplay between spectral variability and flux amplification would make it difficult to disentangle the two causes.
It is worthwhile to note that the 2-10 keV luminosity is not unusual compared with other “broad” Seyfert 1s () and therefore the argument that ionized disks occur preferentially in high-luminosity systems (Nandra et al. 1996; Nandra et al. 1997b) cannot be applied to 1E 1615+061.
Other explanations for the huge soft X-ray variability can be discarded at the light of the ASCA outcomes. The lack of any absorption feature from ionized oxygen (which confirms the first evidence emerging from the ROSAT spectrum, Paper I) excludes a significant contribution from an ionized absorber to the 1E 1615+061 line of sight opacity, whose changes could mimic the appearance and variability of a soft excess. Alternatively, one could argue that the steeper spectrum observed in the 80s was due to a change of the nuclear primary continuum. This hypothesis has been recently invoked to explain the extreme soft X-ray variability in the otherwise standard Seyfert 1 1H 0419577 (Guainazzi et al. 1998). However, a spectrum would require very extreme conditions in the Comptonizing plasma, either in terms of very low electron density temperature or very high optical thickness (Hua & Titarchuk 1995). Such conditions cannot be achieved in the standard two phase corona-disk model (Haardt & Maraschi 1993; Haardt et al. 1997).
The new X-ray results on 1E 1615+061 which provide the first direct evidence of reprocessing from highly ionized matter in the immediate proximity of a supermassive black hole in the nuclear regions of Seyfert 1 galaxies, confirm the general importance of reprocessing phenomena in the AGN environment. Future attempts to follow the multiwavelength history of this, and similar, objects will certainly very fruitful and allow better constraints to be set on the physics and geometry of the matter located in the radiation field of these monsters.
Acknowledgements.
MG acknowledges an ESA Research Fellowship. The careful reading by two referees allowed us to improve the organization of the paper and the comprehensiveness of the discussion.References
- (1) Betchold J., Elvis M., Fiore F., et al., 1994, AJ 108, 374
- (2) Böller T., Trümper J., Molendi S., et al., 1993, A&A 279, 53
- (3) Böller T., Brandt W.N., Fabian A.C., 1997, MNRAS 289, 393
- (4) Böller T., Brandt W.N., Fink H.H., 1996, A&A 305, 53
- (5) Clavel J., Reichert G.A., Alloin D., et al., 1991, ApJ 366, 64
- (6) Comastri A., Fiore F., Guainazzi M., et al., 1998, A&A 333, 31
- (7) Czerny B., Elvis M., 1987, ApJ 321, 305
- (8) Dickey J.M., Lockman F.J., 1990, ARA&A 28, 215
- (9) Fiore F., Elvis M., McDowell J.C., et al., 1994, ApJ 431, 515
- (10) Forster K., Halpern J.P., 1996, ApJ 468, 565
- (11) Frank J., King A.R., Raine D.J., 1975, “Accretion power in Astrophysics”, Cambridge University Press, p.101
- (12) Fukazawa Y., Makishima K., Ebisawa K., et al., 1994, PASJ 46, L141
- (13) George I., Fabian A.C., 1991, MNRAS 249, 352
- (14) Grupe D., Beuermann K., Mannheim K., et al., 1995a, A&A 299, L5
- (15) Grupe D., Beuermann K., Thomas H.-C., et al., 1995b, A&A 300, L21
- (16) Grupe D., Beuermann K., Thomas H.-C., Mannheim K., Fink H.H., 1998, A&A 330, 25
- (17) Guainazzi M., Comastri A., Stripe G., et al., 1998, A&A, in press (available at astroph/9808009)
- (18) Guilbert P.W., Fabian A.C., Rees M.J., 1983, MNRAS 205, 593
- (19) Haardt F., Maraschi L., 1993, ApJ 413, 507
- (20) Haardt F., Maraschi L., Ghisellini G., 1997, ApJ 476, 620
- (21) Hua X.-M., Titarchuk L., 1995, ApJ 449, 188
- (22) Iwasawa K., Brandt W.N., Fabian A.C., 1998, MNRAS 293, 251
- (23) Kuhn O., Betchold J., Cutri R., Elvis M., Rieke M., 1995, ApJ 438, 643
- (24) Laor A., 1990, MNRAS 246, 396
- (25) Laor A., Fiore F., Elvis M., et al., 1997, ApJ 477, 93
- (26) Magdziarz P., Zdziarski A.A., 1995, MNRAS 273, 837
- (27) Makishima K., Tashiro M., Ebisawa K., et al., 1996, PASJ 48, 171
- (28) Matt G., Perola G.C., Piro L., Stella L., 1992, A&A 257, 63
- (29) Matt M., Fabian A.C., Ross R.R., 1993, MNRAS 264, 839
- (30) Nandra K., Pounds K.A., 1994, MNRAS 268, 405
- (31) Nandra K., George I.M., Turner J.T., Fukazawa Y., 1996, ApJ 464, 165
- (32) Nandra K., George I.M., Mushotzky R.F., Turner T.J., Yaqoob T., 1997a, ApJ 477, 602
- (33) Nandra K., George I.M., Mushotzky R.F., Turner T.J., Yaqoob T., 1997b, ApJ 488, L91
- (34) Peterson B.M., Bolonek T.S., Barker E.S., et al., 1991, ApJ 368, 119
- (35) Piro L., Massaro E., Perola G.C., Molteni D., 1988, ApJ 325, L25
- (36) Piro L., Yamauchi M., Matsuoka M., 1990, ApJ 360, L35
- (37) Piro L., Bałucińska-Church M., Fink H.H., et al., 1997, A&A 319, 74 (Paper I)
- (38) Pounds K., Nandra K., Stewart G.C., George I.M., Fabian A.C., 1990, Nat 344, 132
- (39) Pounds K., Done C., Osborne J., 1995, MNRAS 277, L5
- (40) Pravdo S.H., Nugent J.J., Nousek J.A., et al., 1981, ApJ 251, 501
- (41) Puchnarewicz E.M.P., Mason K.O., Romero-Colmenero E., et al., 1996, MNRAS 281, 1243
- (42) Siemiginowska A., Czerny B., 1989, MNRAS 239, 289
- (43) Tanaka Y, Inoue H., Holt S.S., 1994, PASJ 46, L37
- (44) Tanaka Y., Nandra K., Fabian A.C., et al., 1995, Nat 375, 659
- (45) Turner T.J., George I.M., Nandra K., 1998, ApJ in press (available at astroph/9806323)
- (46) Ulrich M.H., Molendi S., 1995, A&A 293, 641
- (47) Walter R., Fink H.H., 1993, A&A 274, 105
- (48) Życki P.T., Czerny B., 1994, MNRAS 266, 653
- (49) Życki P.T., Krolik J.H., Zdziarski A.A., Kallman T.R., 1994, ApJ 437, 597