X-ray observations of the rich cluster CL 0939+4713 and discovery of the strongly variable source RXJ0943.0+4701
Abstract
Recent X-ray observations of the rich galaxy cluster CL 0939+4713 (or Abell 851) at with the ROSAT/HRI as well as with the ASCA/GIS and ASCA/SIS instruments are presented and analysed. With the high resolution imaging data (ROSAT/HRI) we confirm and extend the earlier impression that the cluster has a lot of substructure. Two maxima of the cluster emission are obvious in the images, each of them shows even some internal structure. One of the subclusters can be nicely modeled with an elliptical model. For the total luminosity of the cluster in the ROSAT band we obtain erg/s, for the bolometric luminosity erg/s. We perform spectral fits for the two ASCA instruments and for the ROSAT/PSPC simultaneously. The most reliable numbers for the temperature and metallicity for the intracluster gas are keV and , respectively. We find a relatively small total mass, a small gas mass ratio and a small iron mass to light ratio. These numbers together with relatively low luminosity for such an optically rich cluster and the pronounced substructure confirm that CL 0939+4713 is a young cluster still far away from a virialised state.
In the same ROSAT/HRI image the X-ray emission of a background quasar () can clearly be identified. With a luminosity of erg/s (which is necessarily affected by gravitational lensing) it belongs to the X-ray brightest quasars. A striking difference between the ROSAT/PSPC and the ROSAT/HRI observations (taken almost five years apart) is the fainting of one X-ray source (RXJ0943.0+4701) by at least a factor of ten. We try to identify this source from deep optical data. Our best candidate is a blue compact object, possibly an AGN.
Key Words.:
Galaxies: clusters: individual: CL 0939+4713 – Galaxies: clusters: individual: Abell 851 – intergalactic medium – Cosmology: observations – Galaxies: active – X-rays: galaxies1 Introduction
One of the foremost goals of modern cosmology is the understanding of the formation and evolution of structure. Clusters of galaxies provide an excellent probe because they represent the largest gravitationally bound objects in the universe and can be identified over a large range of redshifts. Studying the X-ray properties of distant clusters and comparing them with the properties of nearby clusters gives important insight into the evolution of galaxy clusters and provides a strong test for cosmological models.
The galaxy cluster presented in this paper is the rich cluster CL 0939+4713 at redshift . It is very well studied optically (see e.g. Dressler & Gunn 1983; Dressler & Gunn 1992; Dressler et al. 1993; Belloni et al. 1995; Belloni & Röser 1996). Almost 200 (spectroscopic and photometric) redshifts are known. The cluster is extremely rich, and it contains a high fraction of blue and E+A galaxies. A background quasar at redshift two is seen through the cluster. CL 0939+4713 was subject of a weak lensing analysis (Seitz et al. 1996), and very recently Trager et al. (1997) showed that there are a few redshift four galaxies seen through the cluster.
A ROSAT/PSPC observation of this cluster was analysed by Schindler & Wambsganss (1996). It was shown that the X-ray luminosity is relatively low for such a rich cluster. Meanwhile new X-ray data are available from the high resolution ROSAT/HRI detector as well as improved spectral information from the ASCA/GIS and SIS instruments.
Here we present and analyse this new X-ray data. We investigate the X-ray morphology of the cluster (Sect. 2.1) from the new ROSAT data and show that the cluster contains clear substructure. In Sect. 2.2 we present a spectral analysis from both ASCA instruments and from the ROSAT/PSPC data. The X-ray luminosity is determined in Sect. 2.3. In Sect. 2.4 we estimate the gas mass, the iron mass and the total mass. We look in some detail into the variable X-ray source RXJ0943.0+4701 whose flux weakened by more than a factor of ten over the five years between the two ROSAT observations (Sect. 2.5). The attempt to identify an optical counterpart for RXJ0943.0+4701 is described in Sect. 2.6. Finally we identify and measure the X-ray properties of the quasar in the field (Sect. 2.7). In the final Chap. 3 we discuss and summarize the X-ray and optical properties of this unusual galaxy cluster.
Throughout this paper we use km/s/Mpc.
2 Observations
For the analysis we use optical and X-ray observations – taken with ROSAT (Trümper 1983) and ASCA (Tanaka et al. 1994) – obtained within a period of five years. The X-ray observations consist of three data sets taken with different instruments:
-
•
14.4 ksec with ROSAT/PSPC on November 15th to 20th, 1991
-
•
39 ksec with ASCA on April 12th and 13th, 1995
-
•
45.6 ksec with ROSAT/HRI on October 16th to 20th, 1996
While the ROSAT observations give us information on the spatial distribution of the X-ray emission, the ASCA data – and to some degree also the ROSAT/PSPC data – provide spectral resolution. The ASCA analysis uses both types of detectors – the Solid-state Imaging Spectrometers (SIS) and the Gas Imaging Spectrometers (GIS). The SISs were operated in 2CCD Faint mode, while the GISs were operated in PH mode (see http://asca.gsfc.nasa.gov/docs/asca/abc/abc.html). The ASCA data are selected according to the following criteria: elevation higher than 20 degrees and bright Earth angle larger than 30 degrees.
The optical observations have been all obtained in November 1992 at the prime focus of the 3.5 m telescope on Calar Alto (Spain) and are listed in Table 1 of Belloni et al. (1995). A series of narrow-band filters had been used (FWHM 90–200 Å) covering the range from 3800 to 9200 Å, and broad band B, R, I filters to obtain low resolution spectra for all galaxies brighter than R=22.5 mag in a 7 arcmin x 7 arcmin cluster field. The filters were selected to examine as accurately as possible the spectral energy distribution (SED) of ellipticals and E+A galaxies (Dressler & Gunn 1983) at the clusters’ redshift. Therefore, they allow us to estimate the redshift of these galaxies with an accuracy (Thimm et al. 1994) and with an accuracy of about for cluster members of other morphological types and foreground/background galaxies.
2.1 X-ray morphology of CL 0939+4713
The ROSAT/PSPC data of cluster CL 0939+4713 were analysed and discussed in Schindler & Wambsganss (1996). Here we concentrate on the higher resolution and much longer HRI observation and compare the two data sets.
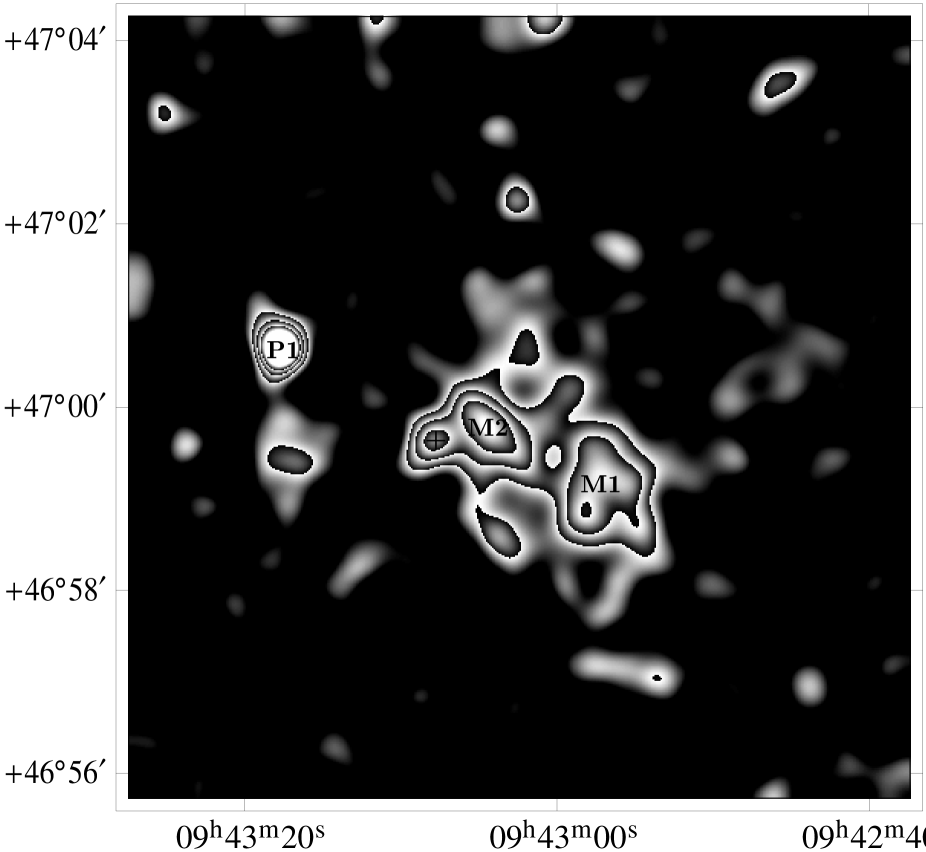
The ROSAT/HRI image of CL 0939+4713 obtained in October 1996 is shown in Fig. 1. The cluster looks very amorphous. It it obvious that there is a lot of substructure in this cluster. The cluster emission consists mainly of two maxima labeled M1 and M2 (see Fig. 1.). Both of them seem not spherically symmetric but show some internal structure. The positions of these maxima are:
-
•
M1 at , (J2000), with a maximum surface brightness of erg/arcmin2/s, and
-
•
M2 at , (J2000) with a maximum surface brightness of erg/arcmin2/s.
These values are obtained from an image smoothed with a Gaussian filter of arcsec. The central part of the ROSAT/HRI image looks very similar to the smoothed light distribution of all identified E/S0 galaxies (Seitz et al. 1996, Fig. 9b) as observed by Dressler et al. (1994).
The high resolution of the HRI allows for the first time to resolve the emission of the quasar at z=2.055 (Dressler et al. 1993). It is located left of the left maximum and marked with a plus sign in Fig. 1.
The most striking difference between this HRI observation and the earlier PSPC image is the complete absence of the emission in the north which is marked as M3 (RXJ0943.0+4701) in the PSPC observation (see Schindler & Wambsganss 1996). This will be investigated in detail in Section 2.5. The bright point source (P1) in the left part of Fig. 1 was detected already with the PSPC. It is very likely not related to the cluster.
As the cluster is clearly not spherically symmetric we do not attempt to fit a single model (Cavaliere & Fusco-Femiano 1976; Jones & Forman 1984)
to the cluster as a whole, but to the two subclusters separately ( is the surface brightness at distance r, is the central surface brightness, is the core radius, and is the slope parameter). The fits are centred on the respective maximum, a sector of in the direction of the other subcluster and the quasar emission being excluded. The profiles and the fits are shown in Fig. 2, the fit parameters are listed in Table 1. Both subclusters show very small values for and for the core radius.
 |
 |
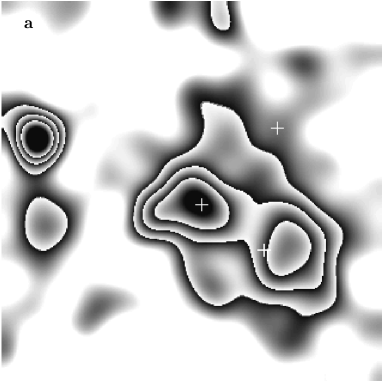
For a quantitative analysis of the substructure we apply the method by Neumann & Böhringer (1997): we fit an elliptical model to the HRI data. Since the cluster has a bimodal shape an elliptical fit cannot converge. Therefore we have to exclude one of the maxima for fit. Both maxima have about the same number of counts within a radius of 40 arcseconds, but M1 is less peaked and its shape corresponds less to an elliptical profile. Therefore we exclude M1 and centre the fit on M2. The quasar emission is excluded for the fit as well. The resulting fit parameters are given in Table 1. They correspond well with the parameters of the spherically symmetrical fit, hence we can be sure that the elliptical fit converged reasonably well. Figure 3a shows the elliptical model.
| Type of fit | centre | S0 in cts/s/arcmin2 | rc in arcsec | rc in kpc | PA (N over E) | |
|---|---|---|---|---|---|---|
| spherical fit | M1 | 15 | 95 | 0.31 | - | |
| spherical fit | M2 | 11 | 67 | 0.36 | - | |
| elliptical fit | M2 | 12(major axis) | 79(major axis) | 0.36 | 133∘ | |
| 9(minor axis) | 56(minor axis) |
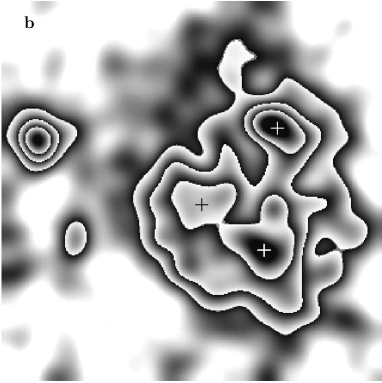
Subsequently, we use the elliptical model and subtract it from the original image. The residuals are shown in Fig. 3b. The emission of and around M2 has almost disappeared which indicates that the elliptical fit is a good model.
In this residual map the maximum M1 is clearly visible, it has a significance of more than 4. It is quite obvious from the morphology that M1 is not relaxed but has some internal structure. There is also some diffuse emission surrounding M1, but with lower significance. The emission of the quasar is very clearly visible. The other emission around the cluster has only significances between 2 and 3, i.e. it is not clear whether each of these features is indicating more substructure is real or whether some of them are just statistical fluctuations.
 |
 |
2.2 Spectral analysis
In order to complement the morphological analysis of CL 0939+4713 we perform a spectral analysis as well. For that we use data obtained by both ASCA/GISs (G2 and G3) and ASCA/SISs (S0 and S1) detectors and the ROSAT/PSPC.
For composing the ASCA spectra the photons are extracted from a circle centred on , with a radius of 3.5 arcminutes and 4.5 arcminutes for the SIS and GIS, respectively. It is necessary to extract the data from different radii because of the different point spread functions of these instruments.
The GIS spectrum covers an energy range of 0.7-10 keV and is rebinned to contain at least 50 photons per bin. The background is taken from blank sky fields where the contaminating sources are masked (Ikebe 1995).
The SIS data are difficult to analyse as they were taken with a non-standard energy discrimination threshold. While normally a lower energy discrimination threshold of 0.41 keV is used, these SIS data were taken with a threshold of 0.55 keV. The correction of the detector response seems to be inaccurate for this non-standard threshold, e.g. if we use the SIS energy range down to 0.7 keV, we find very high values not consistent with the PSPC results. Therefore we have to restrict the SIS energy range for the spectral fits. In Table 2 we list the fit results for two different SIS energy ranges 3-6 keV and 1-10 keV. Obviously, these are both valid energy ranges because they give very similar results. The SIS data are rebinned to contain at least 20 photons per bin and the standard Godard background (see http://asca.gsfc.nasa.gov/docs/asca/abc/abc.html) is used. In the ASCA images a possible contribution of RXJ0943.0+4701 is not resolved, therefore this emission can affect our results. But as RXJ0943.0+4701 has a softer spectrum than the cluster (see Sect. 2.5), its influence is expected to be very small on the ASCA spectra. Extrapolating the flux of RXJ0943.0+4701 as measured in the ROSAT/PSPC observation to an energy band of 1-10 keV – assuming a power law spectrum with a mean photon index of 2.5 (see Sect. 2.5) – we find that the flux (1-10keV) is less than 1% of the cluster flux.
The source spectrum of the ROSAT/PSPC is extracted from a circle centred between M1 and M2 (, ) with a radius of 2.3 arcminutes (the point spread function is even smaller than the one of the ASCA/SIS). We exclude the emission of RXJ0943.0+4701 (, with a radius of 50 arcseconds) since it is most likely unrelated to the cluster. The background is taken from different parts of the same pointing. The spectrum is rebinned to contain at least 16 and 25 photons, respectively. Fits with different background realizations and different binning give very similar results.
We fit the spectra of all instruments simultaneously by folding for each spectrum the Raymond-Smith model with the response for the corresponding instrument (see Fig. 4). This procedure has the advantage of enabling us to constrain different fit parameters at the same time. While the PSPC data can determine the temperature only with very large uncertainty and cannot constrain the metallicity at all, they can determine the hydrogen column density quite reliably, because the affects mainly the soft part of the spectrum. The GIS data are ideal for determining the temperature, because the spectrum extends to the highest energies (see Fig. 4). The SIS data are the ones that give good constraints on the metallicity from the Fe K emission line, as the energy resolution of the SIS is the best of all used detectors. Because all the fit parameters are connected, it is the best to fit the spectra of all detectors simultaneously.
The results of the spectral analysis are listed in Table 2. We show different simultaneous fit results, for two SIS energy ranges, each one with the redshift as free fit parameter as well as the redshift fixed to the optical value of . The results of all fits agree well within the errors. The hydrogen column density is consistent with the Galactic value of 1.27 cm-2 (Dickey & Lockman 1990) within the uncertainty. In the following we use the mean values from all four simultaneous fits and corresponding 90% confidence level errors: keV, and cm-2.
We find small discrepancies in the fluxes of the different detectors: the flux determined by GIS is about 15% higher with respect to the flux determined by SIS and about 25% higher with respect to the PSPC flux, which can be explained only partially by the different extraction radii and variability of the source RXJ0943.0+4701 (see Sect. 2.5).
| Instruments | SIS energy range in keV | in keV | in cm-2 | d.o.f. | d.o.f. | ||
|---|---|---|---|---|---|---|---|
| GIS/SIS/PSPC | 81 | 0.97 | |||||
| GIS/SIS/PSPC | (fixed) | 82 | 0.97 | ||||
| GIS/SIS/PSPC | 139 | 0.92 | |||||
| GIS/SIS/PSPC | (fixed) | 140 | 0.92 | ||||
| PSPC only | 0.23(fixed) | 0.41(fixed) | 18 | 0.86 |
 |
 |
For comparison with the temperature found previously in a ROSAT/PSPC analysis by Schindler & Wambsganss (1996) we show in Table 2 also the fit of the PSPC data only. The temperature of T keV is somewhat lower than in the combined fits, but the upper limit is unconstrained. The temperature of Schindler & Wambsganss (1996) keV obtained without excluding RXJ0943.0+4701 was much lower. The explanation is that the ROSAT/PSPC spectrum was contaminated by the soft contribution of the variable source RXJ0943.0+4701 and therefore the best fit yielded a lower temperature.
2.3 Luminosity
The X-ray emission of the galaxy cluster can be traced out to 2.5 arcminutes (almost 1 Mpc) in the HRI observation. Within this radius we find 1060 source counts after background subtraction (the point source P1 lies outside this circle; the emission of the quasar is excluded.) This corresponds to a count rate of 0.023 HRI counts/s.
Using the temperature keV and the hydrogen column density cm-2 of the spectral fits we derive a luminosity in the ROSAT band (0.1-2.4 keV) of erg/s, corresponding to a bolometric luminosity of erg/s.
2.4 Gas mass, total mass and iron mass
A mass determination from the X-ray data for this cluster is very difficult, because one has to assume spherical symmetry, which is certainly a bad approximation for CL 0939+4713. Just for giving a rough estimate of the mass we restrict the mass analysis to the central parts of the two subclusters assuming that each subcluster is spherically symmetric. The outer radius of 41 arcseconds (265 kpc) is chosen as half of the distance between the subclusters. For the analysis we use the spherically symmetric -models described in Sect. 2.1 and a constant temperature of 7.6 keV for both subclusters.
Figure 5 shows the integrated gas and total masses. At a radius of 265 kpc the integrated gas masses in the subclusters M1 and M2 are very similar: kpc and kpc, respectively. Assuming a constant temperature and hydrostatic equilibrium we can also determine the total masses of the subclusters: kpc and kpc, respectively. The errors come mainly from the uncertainty in the temperature (see Sect. 2.2), which are . An additional uncertainty is introduced by the internal substructure of the subclusters which tends to cause an underestimation of the mass (Schindler 1996). The errors on the mass include another uncertainty of 15% error coming from this effect, from possible temperature gradients and from possible temperature differences between the subclusters.

With these numbers we find gas mass fractions of and for M1 and M2, respectively. These fractions are very small compared to other clusters where one finds usually gas mass fractions between 10% and 30% (Böhringer 1995).
For a comparison with the total mass estimate from gravitational lensing we determine the mass in the region were the HST field and our two circles around the subcluster centres overlap. The HST field is much smaller than the HRI field so that only part of the two circles are covered by the HST field. As M1 and M2 are close to the border of the HST field we use only the sectors of the circles which have overlap with the HST field: angles (N over E) centred on M1 and angles centred on M2. The total overlapping area is only about 1.4 arcmin2. For the comparison we have to determine the surface mass density i.e. projecting the mass onto a plane. For doing this we have to extrapolate and project the model. As the outer integration radius in the line of sight we choose 1 Mpc, which is a compromise between extrapolating too far into non-relaxed regions and summing most of the mass. Integrating out to a radius of 1.5 Mpc would increase the mass only be 3.5% which is negligible considering the error. With this procedure we find a projected mass of in the overlapping area. The error is again the same percentage as used for and .
The mass from gravitational lensing as calculated by Seitz et al. (1996) in the same overlapping area is . For this number a mean redshift of the background galaxies of is assumed. If one would use a different redshift and , the mass would be and , respectively. As this redshift is the largest uncertainty in the lensing mass estimate, it remains a discrepancy of a factor 2 – 3 between the X-ray and the lensing mass.
For determining the iron mass in the intra-cluster gas we use the metallicity from the spectral fits . With this we calculate the ratio of . For the determination of the gas mass we use the two spheres of 265 kpc radius around the two subclusters. The iron mass in this volume is . Within the same radii in the optical field are 26 galaxies. Estimating the total blue luminosity including an extrapolation to faint galaxies we find about . This results in an iron mass to light ratio .
For comparison we do the same also in a larger sphere of 584 kpc around M1 (the maximum radius completely covered by the optical field) by extrapolating the -profile. The subcluster around M2 is neglected in this case. For this case we find , 75 galaxies with , and again . As the two numbers for the iron mass to light ratio are so similar, we can be sure that we do not make an error by using a restricted volume and by not taking into account the gas in the line-of-sight outside the circles.
The iron mass to light ratio is smaller than the ones typical for rich clusters of 0.01-0.02 (Renzini et al. 1993), although one has to keep in mind the errors only coming from the metallicity are already .
2.5 The variable X-ray source RXJ0943.0+4701
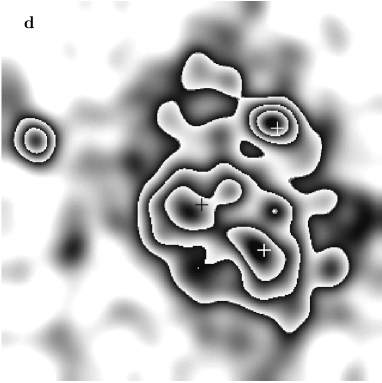
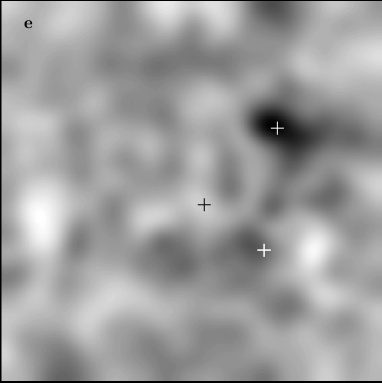
A comparison of the PSPC and the HRI observations shows that the source RXJ0943.0+4701 is not present in the HRI image (Fig. 6). For a determination of the flux of RXJ0943.0+4701 in the PSPC observation we simulate the PSPC point spread function, smooth it with a Gaussian of arcsec and subtract it from a PSPC image with the same smoothing. We vary the number of counts in the point spread function model until the level of the residuals is comparable to the diffuse cluster emission at this position.
With this method we find that RXJ0943.0+4701 has about 50 counts (broad band) above the cluster emission in the PSPC observation. This corresponds to about cts/s for the PSPC detector. With the above mentioned value of the Galactic and a power law with photon index 2.3 this count rate corresponds to a flux in the ROSAT band (0.1-2.4 keV) of erg/cm2/s.
In the HRI image appears very faint emission near the position of RXJ0943.0+4701 with very low significance (only 1.3) which could as well be a statistical fluctuation. If there is any real emission at this position it cannot contain more than 5 counts above the cluster plus background emission; this corresponds to a source countrate HRI cts/s. With the same assumptions as above this count rate corresponds to a flux in the ROSAT band erg/cm2/s. Given the smaller point spread function of the HRI which would give the (point) source a higher significance above the background and the diffuse cluster emission we conclude that the decrease in luminosity of RXJ0943.0+4701 in the ROSAT band is at least a factor of 10. This decrease can be either due to a general decrease in luminosity or due to a shift of the emission out of the ROSAT energy range.
The non-detection of RXJ0943.0+4701 in the HRI observation cannot be caused by the fact that the HRI is slightly less sensitive in the soft band compared with the PSPC (ROSAT User’s Handbook http://www.xray.mpe.mpg.de/rosat/doc/ruh), because the hardness ratio at the position of RXJ0943.0+4701 (hard-soft)/(hard+soft), i.e. there are about the same number of counts in the soft and in the hard band.
 |
 |
 |
 |
 |
In the ROSAT All-Sky Survey (Voges et al. 1996) CL 0939+4713 was observed in November 1990 for two days. Unfortunately, the exposure time is too low to see any morphological details. The Survey countrate of the whole cluster region is within the errors in agreement with both the PSPC and the (converted) HRI count rate. A lightcurve of the Survey observation shows no indication of variability (Boller & Voges, private communication).
Unfortunately, RXJ0943.0+4701 cannot be resolved with ASCA, i.e. one cannot distinguish the cluster emission from emission coming from RXJ0943.0+4701. Therefore, we have no information about the flux of RXJ0943.0+4701 at the time of the ASCA observation.
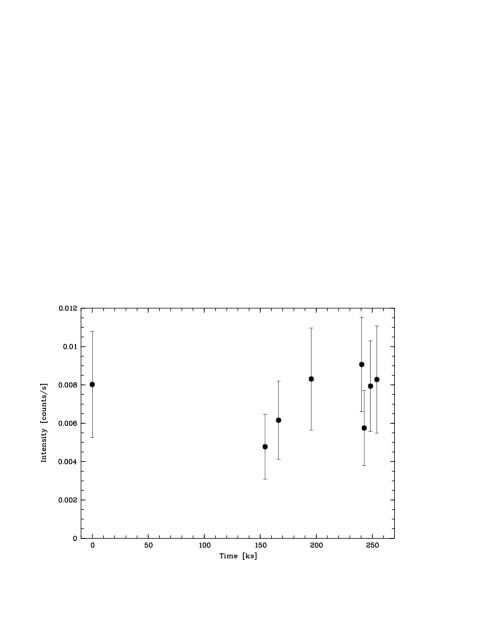
For examining the short-term variability of RXJ0943.0+4701 we try to derive a lightcurve from the PSPC observation. The source was observed in eight intervals within 72 hours. The intervals have exposure times between 1300s and 2400s. Figure 7 shows this attempt of a lightcurve. It is consistent with a constant emission over 3 days.
A spectral fit to the RXJ0943.0+4701 region alone is very difficult because of the small number of photons. In an attempt to get a least a rough idea we fit the spectrum using two different kinds of background: 1) only detector background and 2) detector background plus cluster emission. A fit with a Raymond & Smith (1977) model yields temperatures of keV and keV, respectively, for the two different background models. Although these results have very large errors they show that the RXJ0943.0+4701 emission is considerably softer than the cluster emission (compare also Fig. 6). A fit with a power law to the same spectra yields photon indices of 2.2 and 2.9, respectively (again with very large errors).
2.6 Identification of RXJ0943.0+4701
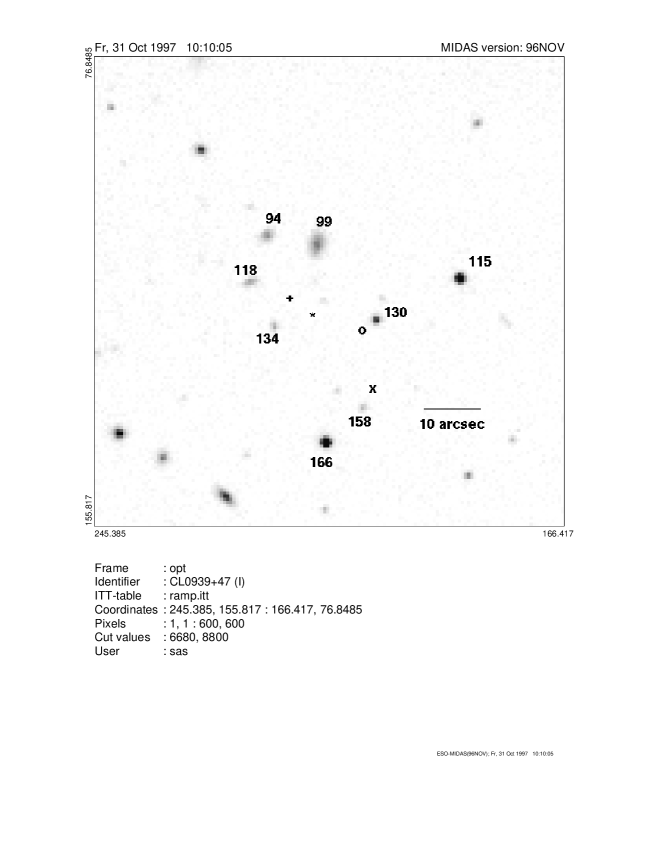
Since the source RXJ0943.0+4701 appears to be variable and hence very interesting, we try to find the optical counterpart of the X-ray emission at RXJ0943.0+4701. Unfortunately, the northern part of the cluster was never observed with HST. A ground based I-band image of the field around RXJ0943.0+4701 is shown in Fig. 8. The position of RXJ0943.0+4701 is not very well determined in the PSPC observation for several reasons. First, the maxima in different bands are not exactly coincident (see Fig. 6 and 8). Second, there is no other point source near the cluster with an obvious optical counterpart which could be used to correct for a possible pointing offset of the ROSAT telescope. Therefore, we use the HRI image for the correction. In this image the quasar at z=2.055 is used to determine the pointing offset of the HRI. The pointing offset is only 1 arcsec. After correcting for this offset we use the point source P1 (see Fig.1) present in both, HRI and PSPC image, to correct for the PSPC offset, which is relatively large, 11 arcsec.
The corrected positions of RXJ0943.0+4701 are marked in the optical image (Fig. 8). In the region of these positions are 8 possible optical counterparts with R magnitudes brighter than 22m. These objects are marked with numbers in Fig. 8. We measure the brightness of all these objects using fixed aperture photometry with an aperture of 3.5 arcsec on the deep cluster images taken with the 12 filters (Belloni et al. 1995). The R magnitudes of all these counterpart candidates are listed in Table 3 along with their classification from the SEDs plus morphological analysis. Figure 9 shows the observed fluxes and the SEDs that we assign by eye as the best fit. Although this is admittedly a quite qualitative classification, we can still gain valuable information from it. Using all this information we gather: of the possible optical counterparts two are stars, five are galaxies and one is a blue compact object (#130).
| object | (2000) | (2000) | R magnitude | probable identification |
|---|---|---|---|---|
| #94 | 09 42 59.1 | 47 01 04 | 20.37 | spiral |
| #99 | 09 42 58.2 | 47 01 02 | 19.75 | elliptical/Sa at z=0.30-0.35 |
| #115 | 09 42 55.8 | 47 00 56 | 19.26 | M0-M2 or K6-K8 star |
| #118 | 09 42 59.3 | 47 00 56 | 21.05 | Sb, possibly cluster member |
| #130 | 09 42 57.2 | 47 00 50 | 20.60 | blue compact object, slightly larger than PSF |
| #134 | 09 42 59.0 | 47 00 48 | 21.63 | possibly elliptical and cluster member |
| #158 | 09 42 57.5 | 47 00 35 | 21.61 | Sb-Sc, possibly cluster member |
| #166 | 09 42 58.1 | 47 00 29 | 18.48 | M0-M2 or K6-K8 star |
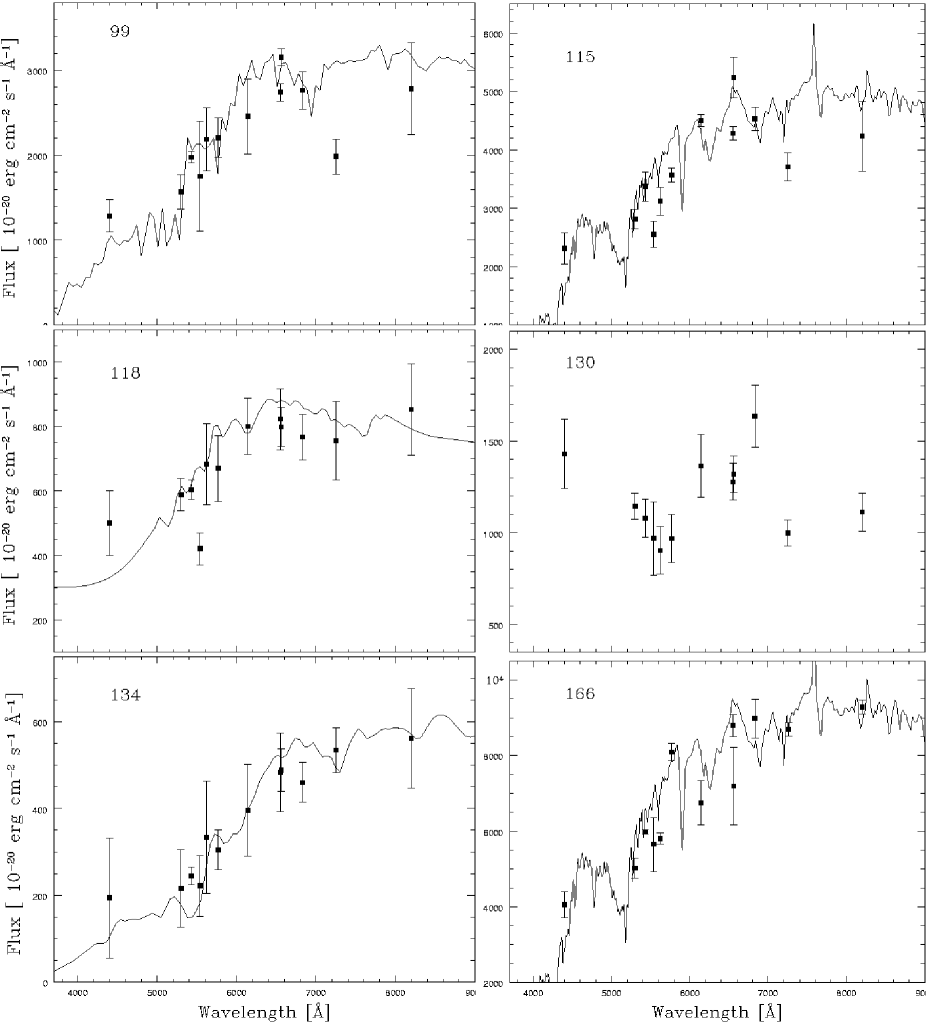
The two stars, objects #166 and #115, have clearly very red spectra typical of cool stars. A convolution of K- and M-type stars spectra (Gunn & Stryker 1983) with our filter setup shows that both stars can be classified as K6-K8 or M0-M2 stars. A possible H emission would not be visible in the SEDs because the corresponding filter at 6560 Å has a FWHM of 170 Å and therefore only a strong emission line (EW 30 Å) could be detected. But it is very rare that these stars have such is a strong emission line.
For stars of this type an X-ray variability of a factor of ten is highly unlikely, unless the star is observed during a flare. But a flare can be excluded from the lightcurve, which shows approximately constant emission over 3 days (see Fig. 7). Furthermore, the ratio of X-ray flux to bolometric optical flux would be too high for K or M stars. For the brighter star #166 the flux ratio
while a value of is the upper limit for K or M stars (J. Schmitt, private communication). Therefore we can rule out the stars as origin of the X-ray emission of RXJ0943.0+4701.
It is also not likely that a cataclysmic variable causes the X-ray emission because a hardness ratio close to (and not the observed ) would be expected.
None of the five galaxies shows the SED or the emission lines typical of an AGN. They look indeed like normal spiral galaxies, either in the foreground or possibly even cluster members. But we cannot exclude that one of the galaxies changed from an active state to a quiescent state within the year that passed between the PSPC and the optical observation. Even for an AGN a variability larger than a factor of 10 is quite exceptional, but an AGN would be a possible identification.
As seen in the previous section, a spectral fit of the RXJ0943.0+4701 region with a power law yields a photon index between 2.2 and 2.9 (with large errors because of the few photons and contamination from the cluster emission). These numbers are typical photon indices for AGNs (e.g. Boller et al. 1996).
Assuming that a cluster member galaxy () or the galaxy #99 at a redshift of about were the X-ray emitting AGN we calculate the luminosity in the ROSAT band. With a photon index of 2.4 and a Galactic we find a luminosity log[keV] = 26.5 (corresponding to (0.1-2.4keV) erg/s for ) or log[keV] = 26.3 (equivalent to (0.1-2.4keV) erg/s for ). Both numbers are in the standard range for AGNs (Boller et al. 1996).
The values for are for all the galaxies in the typical range for AGNs (Maccacaro et al. 1988). So an AGN is a viable possibility for the source RXJ0943.0+4701.
The most interesting candidate for the optical identification of the strongly variable X-ray source RXJ0943.0+4701, however, is the blue compact object #130. With the low-resolution spectra provided by our SED it is not possible to estimate the redshift since only one possible emission line is visible. However, the spectrum is clearly very blue and the extend of the object is only slightly larger than the point spread function. Therefore the candidate #130 could be consistent with a quasar/AGN. For a true identification we have to wait for a better spectrum, though. The spectral fits to the RXJ0943.0+4701 X-ray emission (see previous section) do not provide strong constraints, but these results are certainly not in contradiction with RXJ0943.0+4701 being an AGN. So combining all these different lines of evidence, our conclusion is that the strongly variable X-ray source RXJ0943.0+4701 is most likely an AGN.
2.7 The quasar at z=2.055
In order to determine the X-ray brightness of the quasar at redshift z=2.055 (Dressler et al. 1993) we use the same method as for RXJ0943.0+4701: a smoothed model of the point spread function (in this case the point spread function of the HRI) is subtracted from the image in Fig. 1. We find that the quasar has about 30 counts above the cluster emission in the HRI observation. This corresponds to a count rate of counts/s. Assuming a Galactic hydrogen column density of cm-2 (Dickey & Lockman 1990) and a power law spectrum with photon index = 2.3, we find a flux keV erg/cm2/s/Hz and a luminosity of log[keV (corresponding to (0.1-2.4keV)erg/s), which places the quasar among the most X-ray luminous quasars (La Franca et al. 1995; Green et al. 1995). However, since the quasar it seen through a galaxy cluster, it is unavoidable that the gravitational lens effect of the cluster magnifies the flux of the quasar. Therefore its true X-ray luminosity is probably somewhat lower.
A comparison of the HRI and the PSPC observation (Fig. 6a and b) might suggest a possible X-ray variability of the quasar, because in the PSPC observation M1 is slightly brighter than M2 and it is the other way round in the HRI image (the latter is smoothed such that the resolutions of both images are equivalent). But the number of photons in the two maxima are not significantly different. As these small differences are within the statistical fluctuations there is no indication for a brightening of the quasar between the two observations.
3 Discussion and Conclusions
The main results from the X-ray analysis of CL 0939+4713 are summarized in Table 4. It is quite surprising for such a rich cluster to have an X-ray luminosity typical for a less rich cluster; e.g. its X-ray luminosity is smaller than the mean luminosity of the richness class 4+5 clusters in Soltan & Henry (1983) and CL 0939+4713 is probably richer than these clusters (Dressler et al. 1994). Of course there is a large range of luminosities within each richness class. Burg et al. (1994) find a factor of 25 between the fifth and 95th percentiles, although there seems to be a tendency that the range is becoming smaller when going to higher richness classes. As Burg et al. did the analysis only up to richness class 2, it is hard to quantify how unusual the X-ray luminosity of CL 0939+4713 is.
One might try to explain the low X-ray luminosity by the non-equilibrium configuration of the cluster, which is obvious from the pronounced substructure visible in the ROSAT/HRI image. Evidently, there are still separate units in this cluster which are still in the process of merging. After the final merging the cluster will have probably a higher central density and – as the luminosity is proportional to the square of the density – also a higher luminosity in this stage. But as this effect is not expected to be large (Schindler & Müller 1993) it cannot explain the relatively low luminosity of this obviously pre-merger cluster.
| countrate HRI [counts/s] | 0.023 | |
|---|---|---|
| (0.1-2.4keV) [erg/s] | ||
| (bol) [erg/s] | ||
| temperature [keV] | ||
| metallicity [solar] | ||
| [cm-2] | ||
| subcluster | M1 | M2 |
| ( kpc)[] | ||
| ( kpc)[] | ||
| gas mass fraction | ||
The temperature could be determined here without the contamination of the variable source RXJ0943.0+4701 to keV. The luminosity-temperature relation for high redshift clusters (e.g. Mushotzky & Scharf 1997; Tsuru et al. 1997) predicts a temperature around 6 keV, i.e. the temperature of CL 0939+4713 is somewhat higher than expected from its luminosity, but still consistent within the scatter of the luminosity-temperature relation. From the point of view of the velocity dispersion the temperature is consistent within the scatter of the velocity-temperature relation (Edge & Stewart 1991; Lubin & Bahcall 1993; Bird et al. 1995), but again slightly on the high temperature side. Taking into account the substructure in the cluster one can explain such a behaviour by a merger roughly perpendicular to the line-of-sight. The increase of temperature (and of luminosity) is visible from all directions while the increase in the velocity dispersion is very small when it is observed from a direction perpendicular to the collision axis.
It seems puzzling that a cluster with such a high galaxy content has not a high metallicity. The metallicity of is in the normal range compared with other clusters with this temperature (and less galaxies) which have Fe abundances around 0.3 (Fukazawa et al. 1996, Mushotzky & Loewenstein 1997). The ratio of iron mass to light makes the difference even more evident. The value found in CL 0939+4713 of is smaller than the one expected for rich clusters of 0.01-0.02 (Renzini et al. 1993), although one must keep in mind the errors are so large that there is some overlap and, in addition, the observed dispersion in metallicity is about a factor of two (Mushotzky & Loewenstein 1997).
In order to find an explanation for this difference we have a closer look into the galaxy population of the cluster, having in mind the conclusions of Arnaud et al. (1992) that only ellipticals and lenticulars contribute to the metal enrichment of in the intra-cluster medium. Andreon et al. (1997) found from HST images that CL 0939+4713 is overabundant in spirals. They compared the percentage of ellipticals and lenticulars with the one in the Coma cluster. While they find about 50% E’s and S0’s of identified galaxies in CL 0939+4713, 80% of the Coma cluster galaxies are E’s and S0’s. Furthermore, we can compare it with another cluster which is not so well virialised as the Coma cluster but has also pronounced substructure like CL 0939+4713: the Virgo cluster. This cluster has a percentage of ellipticals and lenticulars of 81% (Binggeli et al. 1985) – also much larger than in CL 0939+4713. These are all results which are based on a morphological classification. Using a spectral analysis one finds a somewhat different result for CL 0939+4713 (Belloni et al. 1995): ellipticals 67%, Spirals and Im 15%, E+A galaxies 19%. The high fraction of E+A galaxies would be classified in the morphological analysis as ellipticals. But as they have a preceding starburst phase, they are in terms of the iron enrichment more similar to spirals. Therefore one should not count the E+A galaxies as ellipticals, so that the elliptical fraction is just 67%. This number is larger than the one from the morphological study but still smaller than other elliptical percentages. Summarizing, the low elliptical content together with the low iron mass to light ratio confirms the correlation of elliptical and iron content found by Arnaud et al. (1992).
The gas mass fraction in this cluster of 6 or 7% is lower than in other clusters, where 10-30% are observed (Böhringer 1995). The small values can be either due to an error in the determination in the total mass, as the total mass for non-relaxed clusters is general difficult to determine (Ota et al. 1998; Allen 1997). A major problem can be projection effects of subclusters like e.g. in CL 0500-24 (Schindler & Wambsganss 1997). Cen (1997) found that these projection effects may be able to account for all discrepancies found between X-ray masses and lensing masses.
On the other hand the consistency with the luminosity-temperature relation implies together with the small gas mass fraction a compact structure of the subclusters, which is found in the subclusters around M1 and M2 (see small core radii in Table 1). For a standard-shaped isothermal cluster the temperature has a fixed relation with the total mass, as well as the X-ray luminosity with the gas mass. To get a low gas mass fraction a more compact gas distribution than the average one is necessary, which produces the same X-ray luminosity with a smaller amount of gas. As this is the case in CL 0939+4713 everything gives a consistent picture. The mass to light ratio of is also rougly in the standard range. This implies that there is not necessarily an error in the mass estimate and the low gas mass fraction can be real. Such variations in the baryonic fractions would have implications for cosmology. They would be explainable either by dynamical processes operating differently on baryonic and dark matter or by pre-inflationary baryon-to-total mass fluctuations which are preserve d into the post-inflationary epoch (see Evrard 1997).
This new X-ray analysis of ROSAT/HRI and ASCA data confirms that CL 0939+4713 is a young cluster. It is a cluster where mergers on different levels are taking place, which is obvious from the complex subcluster structure. Also other properties point in this direction: for its richness the cluster has a relatively low luminosity, low gas mass, low total mass and low iron mass, which are all indicators for young systems.
The variable source RXJ0943.0+4701 at a distance of about 1.5 arcmin from the cluster centre was discovered by comparing the ROSAT/PSPC and the ROSAT/HRI image. Its luminosity decreased by at least a factor ten within the five years between the two ROSAT observations. Only a small fraction of X-ray sources has such large variations in the flux (Voges & Boller 1997).
To identify RXJ0943.0+4701 we use the X-ray properties (X-ray spectrum, short term time variability) in combination with optical properties taken from observations with various filters (SED, ratio of optical to X-ray flux). This comparison rules out stars and cataclysmic variables as origin of the X-ray emission of RXJ0943.0+4701, so that the most likely origin would be an AGN.
So far only very few AGNs have been found with large X-ray variabilities and these strongly variable AGNs turned out to be mainly narrow-line Seyfert 1 galaxies (e.g. Piro et al. 1988; Grupe et al. 1995, Otani et al. 1996, Boller et al. 1997). It is not clear yet what physical processes are responsible for the strong X-ray variability. Possible explanations (as discussed in Boller et al. 1997) could be strong relativistic effects and partial covering by occulting structures in an accretion disc. Optical follow-up observations will give us detailed information on this interesting object.
Acknowledgements.
It is a pleasure to thank Doris Neumann for providing the code to determine the significance of substructure, Carlo Izzo for his most helpful EXSAS support, Thomas Boller for assistance with the time analysis, and Stella Seitz for determining the lensing mass for us on the complicated overlapping area. We thank D. Grupe, J.H.M.M. Schmitt and H.C. Thomas for helpful discussions about variable sources. The referee Richard Mushotzky is thanked for valuable suggestions. S. S. acknowledges financial support by the Verbundforschung.References
- (1) Allen S.W., 1998, MNRAS, 296, 392
- (2) Andreon S., Davoust E., Heim T., 1997, A&A 323, 337
- (3) Arnaud M., Rothenflug R., Boulade O., Vigroux L., Vangioni-Flam E., 1992, A&A 254, 49
- (4) Belloni P., Bruzual G.A., Thimm G.J., Röser H.-J., 1995, A&A 297, 61
- (5) Belloni P., Röser H.-J., 1996, A&A 118, 65
- (6) Binggeli B., Sandage A., Tammann G.A., 1985, AJ 90, 1681
- (7) Bird C.M., Mushotzky R.F., Metzler C.A., 1995, ApJ 453, 40
- (8) Böhringer H., 1995, in: Proceedings of the 17th Texas Symposium on Relativistic Astrophysics and Cosmology, Böhringer H., Morfill G.E., Trümper J.E. (eds.), New York Academy of Sciences, New York, p. 67
- (9) Boller T., Brandt W.N., Fabian A.C., Fink H.H., 1997, MNRAS 289, 393
- (10) Boller T., Brandt W.N., Fink H.H., 1996, A&A 305, 53
- (11) Burg R., Giacconi R., Forman W., Jones C., 1994, ApJ 422, 37
- (12) Cavaliere A., Fusco-Femiano R., 1976, A&A 49, 137
- (13) Cen R., 1997, ApJ 485, 39
- (14) Dickey J.M., Lockman F.J., 1990, ARA&A 28, 215
- (15) Dressler A., Gunn J.E., 1983, ApJ 270, 7
- (16) Dressler A., Gunn J.E., 1992, ApJS 78, 1
- (17) Dressler A., Oemler A., Gunn J.E., Butcher, H.R., 1993, ApJL 404, L45
- (18) Dressler A., Oemler A., Butcher, H.R., Gunn J.E., 1994, ApJ 430, 107
- (19) Edge A.C., Stewart G.C., 1991, MNRAS 252, 428
- (20) Evrard A.E., 1997, MNRAS 292, 289
- (21) Fukazawa Y., Tamura T., Ezawa H., Makishima K., Kikuchi K., Ohashi T., Ikebe Y., Tsuru T., 1996, in: Contributions to the ASCA Symposium on X-ray Imaging and Spectroscopy of Cosmic Hot Plasmas, RESCEU 38/96, p. 21
- (22) Green P.J., Schartel N., Anderson S.F., Hewett P.C., Foltz C.B., Brinkmann W., Fink H., Trümper J., Margon B., 1995, ApJ 450, 51
- (23) Grupe D., Beuermann K., Mannheim K., Thomas H.-C., Fink H.H., de Martino D., 1995, A&A 300, L21
- (24) Gunn J.E., Stryker L.L., 1983, ApJS 52, 121
- (25) Ikebe Y., 1995, Ph.D. Thesis, University of Tokyo
- (26) Jones C., Forman W., 1984, AJ 276, 38
- (27) La Franca F., Franceschini A., Cristiani S., Vio R., 1995, A&A 299, 19
- (28) Lubin M.L., Bahcall N.A., 1993, ApJ 415, L17
- (29) Maccacaro T., Gioia I., Wolter A., Zamorani G., Stocke J.T., 1988, ApJ 326, 680
- (30) Mushotzky R.F., Loewenstein M., 1997, ApJ 481, L63
- (31) Mushotzky R.F., Scharf C.A., 1997, ApJ 482, L13
- (32) Neumann D.M., Böhringer H., 1997, MNRAS 289, 123
- (33) Piro L., Massaro E., Perola G.C., Molteni D., 1988, ApJ 325, L25
- (34) Ota N., Mitsuda K., Fukazawa Y., 1998, ApJ 495, 170
- (35) Otani C., Kii T., Miya K., 1996, in: Proceedings of Röntgenstrahlung from the Universe, Zimmermann H.U., Trümper J.E., Yorke H. (eds.), MPE Report 263, p. 491
- (36) Raymond J.C., Smith B.W., 1977, ApJS 35, 419
- (37) Renzini A., Ciotti L., D’Ercole A., Pellegrini S., 1993, ApJ 419, 52
- (38) Schindler S., 1996, A&A 305, 756
- (39) Schindler S., Müller E., 1993, A&A 272, 137
- (40) Schindler S., Wambsganss J., 1996, A&A 313, 113
- (41) Schindler S., Wambsganss J., 1997, A&A, 322, 66
- (42) Seitz C., Kneib J.-P., Schneider P., Seitz S., 1996, A&A 314, 707
- (43) Soltan A., Henry J.P., 1983, ApJ 271, 442
- (44) Tanaka Y., Inoue H., Holt S.S., 1994, PASJ 46, L39
- (45) Thimm G.J., Röser H.-J., Hippelein H., Meisenheimer K., 1994, A&A 285, 785
- (46) Trager S.C., Faber S.M., Dressler A., Oemler A. Jr., 1997, ApJ 485, 92
- (47) Trümper J., 1983, Adv. Space Res. 2, 142
- (48) Tsuru T.G., Matsumoto H., Koyama K., Tomida H., Fukazawa Y., Hattori M., Hughes J.P., 1997, astro-ph/9711353
- (49) Voges W., Boller T., Dennerl K., Englhauser J., Gruber R., Haberl F., Paul J., Pietsch W., Trümper J.E., Zimmermann H.U., 1996, in: Proceedings of the workshop Röntgenstrahlung from the universe, held in Würzburg, Germany, Zimmermann H.U., Trümper J.E., Yorke H. (eds.), MPE Report 263, p. 637
- (50) Voges W., Boller T., 1997, in: Proceedings of the workshop on All-Sky X-ray observations in the next decade – The workshop for ASM and GRB mission in X-ray band, held in Wako, Japan, Matsuoka M., Kawai N. (eds.), p. 35