ESO Imaging Survey
Abstract
This paper presents the I-band data obtained by the ESO Imaging Survey (EIS) over two patches of the sky, 6 square degrees each, centered at , , and , . The data are being made public in the form of object catalogs and, photometrically and astrometrically calibrated pixel maps. These products together with other useful information can be found at ”http://www.eso.org/eis”. The overall quality of the data in the two fields is significantly better than the other two patches released earlier and cover a much larger contiguous area. The total number of objects in the catalogs extracted from these frames is over 700,000 down to , where the galaxy catalogs are 80% complete. The star counts are consistent with model predictions computed at the position of the patches considered. The galaxy counts and the angular two-point correlation functions are also consistent with those of the other patches showing that the EIS data set is homogeneous and that the galaxy catalogs are uniform.
Key Words.:
imaging survey - star counts- correlation function1 Introduction
This paper presents data for the last two patches (C and D) of the sky observed by the public ESO Imaging Survey (EIS), being carried out in preparation for the first year of regular operation of VLT. The I-band data reported here covers a total area of 12 square degrees, down to , corresponding to two patches probing separated regions of the sky, 6 square degrees each. The present work complements earlier papers in the series (Nonino et al. 1998; paper I, Prandoni et al. 1998; paper III) and completes the presentation of the data accumulated by the EIS observations carried out in the period July 1997-March 1998 as part of the wide-angle imaging survey originally described by Renzini and da Costa (1997) and in paper I.
The primary science goal for surveying patches C and D was to search for and produce a list of distant galaxy cluster candidates that would complement those of the other two patches (A and B) reported earlier (Olsen et al. 1998a,b: paper II and V), providing VLT targets nearly year-round. Patches C and D were also selected to overlap with the ongoing 92cm Westerbork Survey in the Southern Hemisphere (WISH) being carried out in the region and . Originally, the EIS observations were expected to be carried out in two passbands (V and I). However, because of time constraints and the prospect of supplementing the EIS observations at the NTT with the new wide-field imager for the 2.2m ESO/MPIA telescope, preference was given to increase the area covered by the I-band observations, more suitable for identifying distant clusters with (see paper V). This decision allowed the full coverage of the selected patches, yielding a total coverage of 12 square degrees. Combined with the data for patches A and B the EIS I-band data covers a total area of about 17 square degrees, currently the largest available survey of its kind in the Southern Hemisphere.
The goal of the present paper is to describe the characteristics of the I-band observations of patches C and D. In section 2, the observations, calibration and the quality of the data are described. In section 3, the object catalogs extracted from the images are examined and compared with data from the other patches and other data sets to comparable depth. Concluding remarks are presented in section 4.
2 Observations and Data Reduction
The observations of patches C and D were carried out over several months in the period November (December for patch D) 1997 to March 1998, using the red channel of the EMMI camera on the 3.5m New Technology Telescope (NTT) at La Silla. The red channel of EMMI is equipped with a Tektronix 2046 2046 chip with a pixel size of 0.266 arcsec and a useful field-of-view of about . The observations were carried out as a series of overlapping 150 sec exposures, with each position on the sky being sampled at least twice, using the wide-band filter WB829#797 described in paper I, and for which the color term relative to the Cousins system is small.
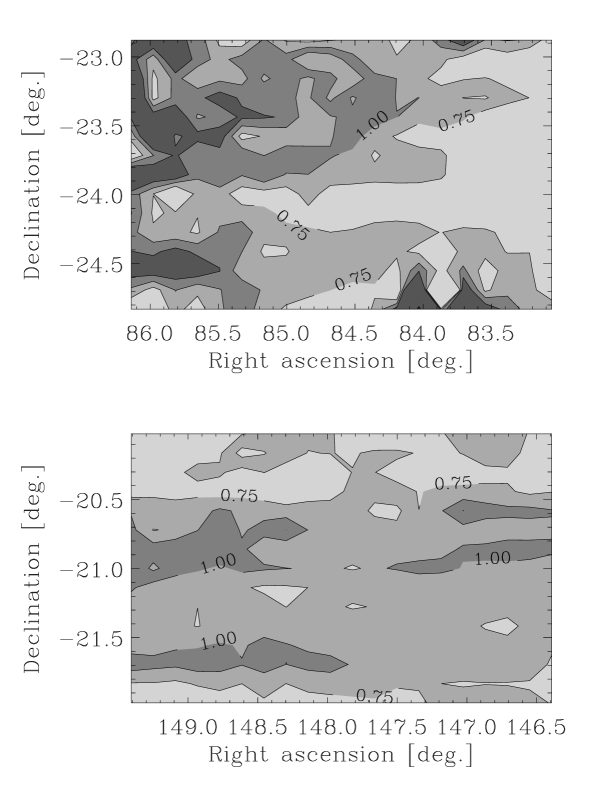
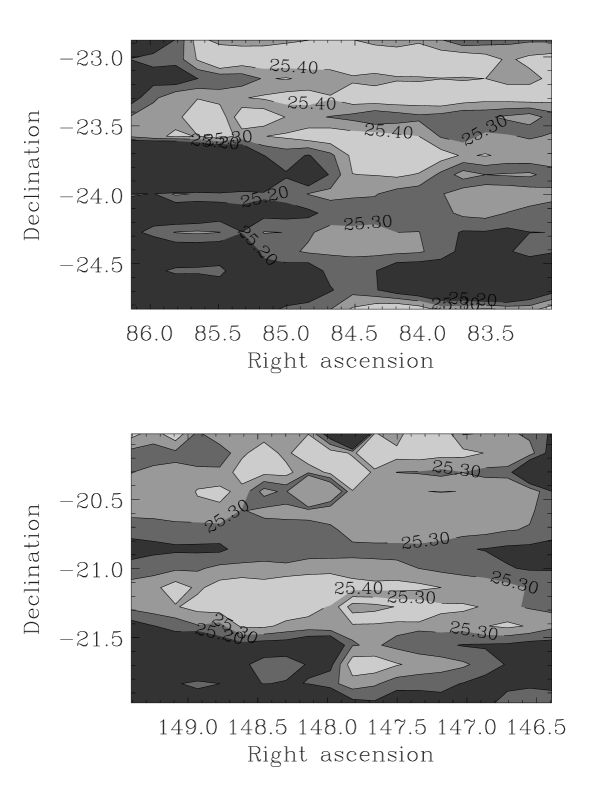
The data for patches C and D consist of 1348 frames but only 1203 were accepted for final analysis, discarding 145 frames obtained in poor seeing condition ( arcsec). The frames actually accepted have a seeing in the range 0.5 to 1.6 arcsec, considerably better than the data available for patches A and B obtained at the peak of El Niño. Figure 1 shows the seeing distribution of all observed frames in each patch. For comparison the figure also shows the seeing distribution of the accepted frames, with the vertical lines in each panel indicating the median seeing and the quartiles of the distribution. From the figure one finds that the median seeing for both patches is sub-arcsec ( arcsec) with only 25% of the area covered by frames with a seeing larger than 1 arcsec. The good quality of the observations can also be seen from figure 2 which shows the limiting isophote within 1 arcsec for each patch. Apart from one subrow in patch C, in both cases the limiting isophote is typically 25.3 mag arcsec-2. The two-dimensional distributions of the seeing and limiting isophote are shown in figures 3 and 4. Comparison with similar distributions presented in earlier papers (paper I and III) shows that the data for patches C and D are significantly better. Note that for each patch tables are available listing the position of each accepted frame, its seeing, limiting isophote and photometric zero-point and can be found at “http://www.eso.org/eis”.
In late February 1998, a realignment of the secondary mirror was carried out by the NTT team in an attempt to minimize the image distortions seen in the upper part, especially the upper-right corner, of the EMMI frames. Some frames for patch C and most of the frames in patch D were observed with the new setup of the NTT. Examination of the point spread function for these frames showed no significant improvement in the quality of the images. This points out the need to introduce a position-dependent estimator for the point-spread function to assure uniformity in the star/galaxy separation across the frame. This is particularly important for images observed under good seeing conditions. In fact, examining the uniformity of the classification as a function of position on the chip it is found that there is a 10% increase in the density of galaxies at the upper edge of the chip, due to misclassifications, significantly larger than that seen in paper I.
In the last three runs (January-March) it was also noticed faint (at the level of the background noise) linear features aligned along the east-west direction (perpendicular to the readout axis) associated with moderately bright stars located in the lower half of the CCD not previously seen. The cause for the these features are at the present time unclear but are probably due to the electronic of the old-generation CCD controller of EMMI, when used in a dual-port readout mode. These affects two-thirds of the patch C frames and essentially all the patch D frames. These light trails occur randomly in the patch and there is no obvious way of correcting for them a priori. An important consequence of this problem is that it leads to a localized increase in the detection of low-surface brightness objects over a range of magnitudes (typically ) which can have a significant impact in the cluster detection algorithm (Scodeggio et al. 1998, paper VII). This is unfortunate because both patches C and D are located at lower galactic latitudes () with almost an order of magnitude larger density of stars than the previous patches.


The photometric calibration of the patch was carried out, as described in papers I and III, by determining a common zero-point for all frames from the solution of a global least-squares fit to all the relative zero-points, constraining their sum to be equal to zero. The absolute zero-point was determined by a simple zero-point offset determined from the common zero-point of all frames observed in photometric conditions. There are 340 and 290 such frames, covering about 80% and 60% of the surveyed area, in patches C and D, respectively (see figure 5). The zero-points for these frames were determined using a total of 10 fields containing of the order of 45 standard stars taken from Landolt (1992 a,b), observed in 10 nights for patch C and in 11 nights for patch D. Altogether 215 independent measurements of standards in the three passbands were used in the calibration. Comparison with external data suggests that a zero-point offset provides an adequate photometric calibration for the entire patch.
In order to check the photometric calibration and the uniformity of the zero-points, strips from the DENIS survey (Epchtein et al. 1996) crossing the surveyed area are used. The regions of overlap of these data are shown in Figure 5, which shows that there are five strips crossing patch C and two strips crossing patch D. In the figure the regions observed under photometric conditions are also indicated. Comparison of this figure with their counterparts presented in papers I and III, clearly shows that the data for patches C and D are of superior quality, with a much larger fraction of frames taken under photometric conditions.


In order to investigate possible systematic errors in the photometric zero-point over the scale of the patch, the EIS catalogs were compared with object catalogs extracted from the DENIS strips that cross the survey regions (see figure 5). Comparison of the catalogs allows one to investigate the variation of the zero-point over the patch. The results are shown in figure 6. The domain in which the comparison can be made is relatively small because of saturation of objects in EIS at the bright end () and the shallow magnitude limit of DENIS (). Still, within the two magnitudes where comparison is possible one finds a roughly constant zero-point offset of less than 0.02 mag for both strips and a scatter of mag that can be attributed to the errors in the DENIS magnitudes (Deul 1998).


3 Data Evaluation
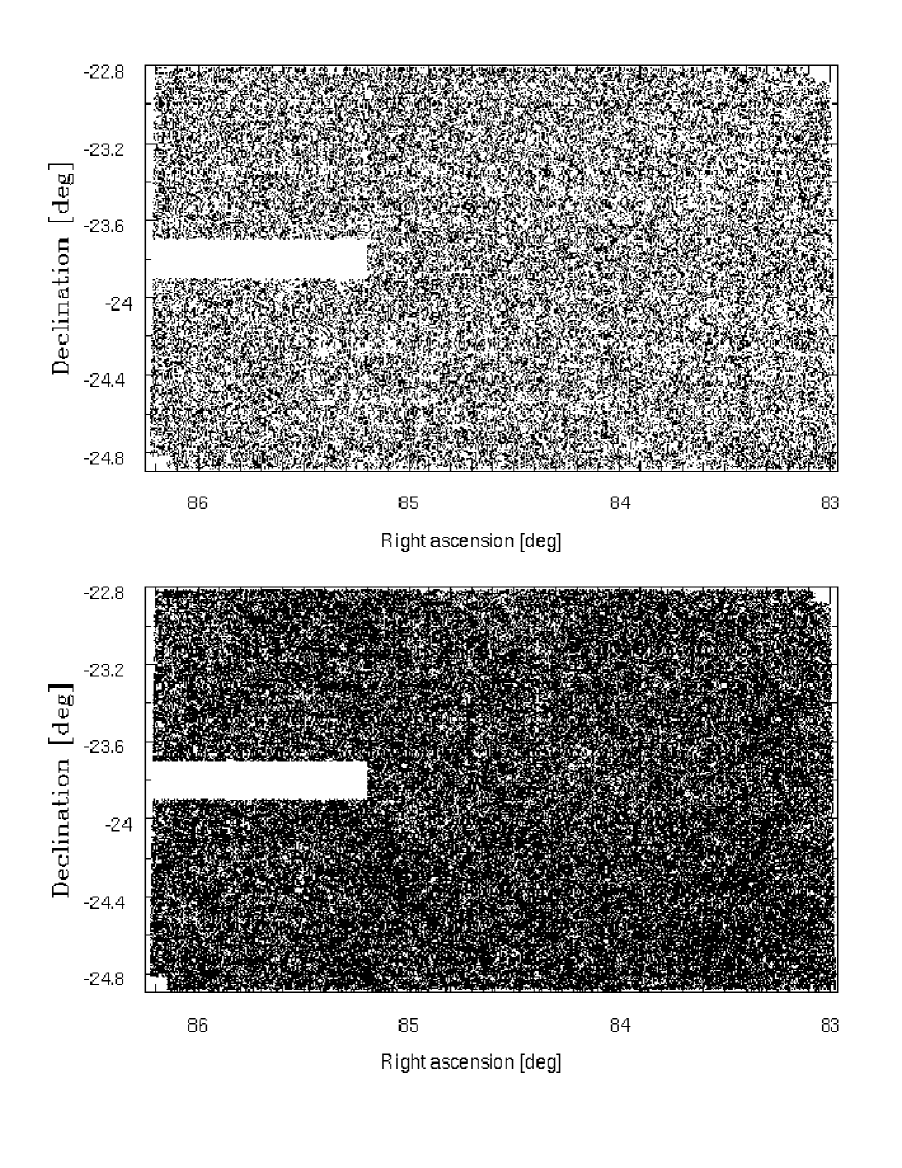
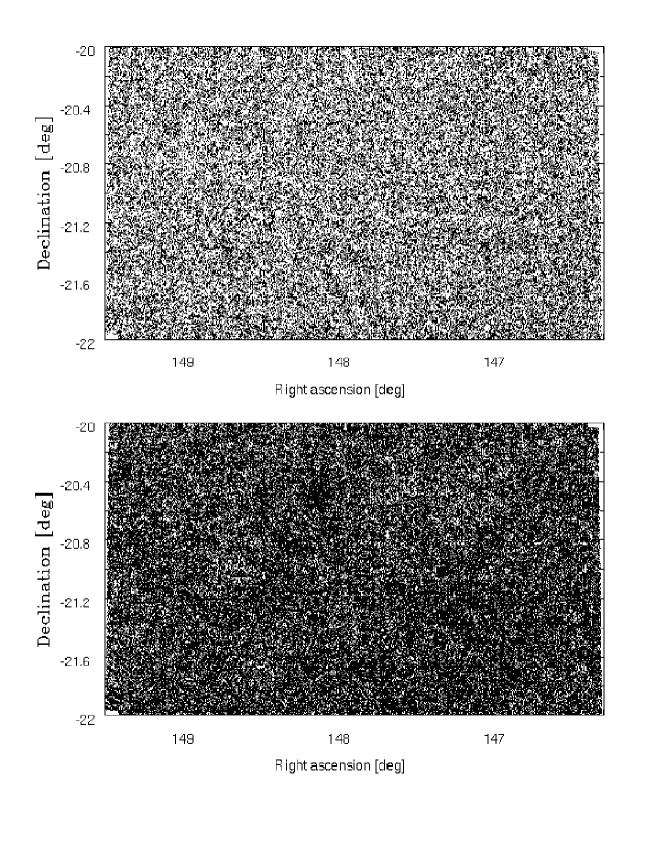
In order to evaluate the quality of the data simple statistics computed from the object catalogs extracted from the images are compared in this section with model predictions and other data sets. The catalogs derived from individual frames are used to generate the even, odd and best seeing catalogs, described in earlier papers. The spatial distribution of stars and galaxies, defined using similar star/galaxy classification criteria as in previous papers of the series, are shown in figures 7 and 8 down to and for stars and galaxies, respectively. The latter corresponds roughly to the completeness limit of the object catalog. This limit was established using the object catalog extracted from the co-addition of images of a reference frame taken periodically during the observations of a patch. Note that because of the much better seeing star/galaxy classification is possible down to and the completeness is about 0.5 mag deeper. Some improvement in the classification is expected from a new estimator being implemented in SExtractor based on a position-dependent PSF fitting scheme currently being tested. This new version should also improve the uniformity of the classification across the chip.
The distribution of the stars and galaxies shown in figures 7 and 8 is remarkably homogeneous and considerably better than those seen in the previous EIS patches due to the much better observing conditions. This is true except for a small region of about 0.2 square degrees in patch C which has been removed, as indicated in figure 7. The only problem seen with the galaxy catalogs in these patches is the presence of several relatively thin linear features clearly seen at high resolution (see EIS release page). These features are a consequence of the electronic problem mentioned above and are not easily corrected for at the image level.
In order to evaluate the data the general properties of the extracted object catalogs are investigated and compared with model predictions and other data sets. Note that patches C and D are located at lower galactic latitude and the number of stars is considerably larger. In addition, the seeing is considerably better than in previous patches. Therefore, it is of interest to re-evaluate the overall performance of the EIS pipeline reduction under these new conditions.
Figure 9, shows the comparison of the star counts for patches C and D derived using the stellar sample extracted from the object catalogs, with the predicted counts based on a galactic model composed of an old-disk, a thick disk and a halo. The star-counts have been computed using the model described by Méndez and van Altena (1996), using the standard parameters described in their Table 1 and an of 0.015 and 0.010 for patches C and D, respectively. It is important to emphasize that no attempt has been made to fit any of the model parameters to the observed counts. The model is used solely as a guide to evaluate the data. As can be seen there is a good agreement at bright magnitudes (), but the observed counts show an excess at fainter magnitudes (). Even though it is unlikely that this excess is due to misclassified galaxies at these relatively bright magnitudes, a better agreement can be achieved if a higher stellarity index is assumed. On the other hand, it is also possible that the model underestimates the contribution of the thick-disk which makes a significant contribution in this magnitude range. The steep drop in the stellar counts beyond is partially due to the relatively high stellarity index adopted, which was chosen to minimize the losses of galaxies. By adopting a stellarity index of 0.5 the drop in the counts may be avoided down to . However, at these magnitudes and this value of the stellarity index contamination by galaxies may be significant. Another potential problem at these faint magnitudes is the misclassification of stars as a consequence of the distortion effects in EMMI, that can have some impact for images taken in good seeing conditions.

In order to evaluate the depth of the galaxy samples, galaxy counts in patches C and D are compared with those of previous patches in figure 10. There is a remarkable agreement among the counts derived for the different patches, indicating that the identification of galaxies has not been affected by the observations at lower galactic latitudes. The galaxy counts obtained from the different patches have been combined to compute the mean galaxy counts and the variance. This is also shown in figure 10 where it is compared to other ground-based counts (Postman et al. 1998) and those from HDF (Williams et al. 1996), appropriately converted to the Cousins system (see paper III). As can be seen the EIS galaxy counts agree extremely well with the ground-based data covering comparable area over the entire magnitude range down to and with the bright end of the HDF counts. The excellent internal and external agreement of the I-band galaxy counts serves as a confirmation of the reliability of the EIS galaxy catalogs. Extraction from co-added images should allow reaching about 0.5 mag deeper.

One way of examining the overall uniformity of the galaxy catalogs is to use the two-point angular correlation function, , as departures from uniformity should affect the correlation function especially at faint magnitudes. The latter should be sensitive to artificial patterns, especially to the imprint of the individual frames, or possible gradients in the density over the field, which could result from large-scale gradients of the photometric zero-point. Note that any residual effect due to the improper association of objects in the border of overlapping frames would lead to a grid pattern (see the weight map in the EIS release page) that could impact the angular correlation function.

Figure 11 shows obtained for different magnitude intervals for both patches, using the estimator proposed by Landy & Szalay (1993). The calculation has been done over the entire area of patch D and most of the area of patch C, with only one subrow (10 consecutive frames) removed according to the discussion above (see section 2). For comparison, computed for the other patches are also shown (papers I and III) from which the cosmic variance can be evaluated directly from the data. As can be seen there is a remarkable agreement for all the magnitude intervals considered. Moreover, the larger contiguous area of patches C and D allows to estimate the angular correlation function out to degree. In all cases is well described by a power law with in the range 0.7-0.8. Note that for patch B the results refer to the galaxy sample obtained after removing the foreground cluster (see paper III). In particular, there is no evidence for any underlying pattern associated with the overlap of different frames. The effect on was evaluated by carrying out simulations by adding to the observed galaxy distribution a grid pattern with different density contrast. It was found that for high contrast this would lead to local depressions in the angular correlation function on scales of half the size of the diagonal of the grid and its multiples, with the depth of depression depending on the relative density. None such features are seen further indicating the uniformity of the derived galaxy catalogs. Finally, note that the good agreement of for the different patches confirms that the observed small-scale linear features associated with the faint light trails, mentioned in section 2, have very little impact in the angular correlation function.
As shown in paper III the dependence of the amplitude of the correlation function on the limiting magnitude of the sample is consistent with earlier estimates based on significantly smaller areas and the recent results reported by Postman et al. (1998). These results show that the EIS galaxy catalogs are spatially uniform and form a homogeneous data set independent of the patch, yielding reproducible results.
Finally, note that even though a single power-law with a slope between 0.7-0.8 gives a reasonable fit for the correlation computed in all magnitude bins, there is some indication that for fainter samples () the angular correlation function may be better represented by two distinct power-laws. On small scales () the slope remains the same while on larger scales it becomes gradually flatter. A similar behavior is seen in the computed for all four patches. This flattening seems to be consistent with earlier claims by Campos et al. (1995) and Neuschaefer and Windhorst (1995) using significantly smaller samples, and more recently by Postman et al. (1998) with a sample of similar size to EIS but covering a single contiguous area.
4 Summary
One year after the first observations, the full data set accumulated by EIS is being made public in the form of astrometrically and photometrically calibrated pixel maps and object catalogs extracted from individual images. In addition, separate papers have presented derived catalogs listing candidate targets for follow-up work. The EIS data set consists of about 6000 science and calibration frames, totaling 96 Gb of raw data and over 200 Gb of reduced images and derived products. All the information regarding these frames are maintained in a continuously growing database. Together with the Science Archive Group a comprehensive interface has been built to provide users with a broad range of products and information regarding the survey.
From the verification of the object catalogs and their comparison against model predictions and other observations, it has been found that the extracted catalogs are reliable and uniform. When all patches are included, the combined EIS galaxy catalog contains about one million galaxies and it is by far the largest data set of faint galaxies currently available in the Southern Hemisphere. The star counts show a good agreement with current galactic models, especially at high-galactic latitudes, and the galaxy counts agree remarkably well with other ground-based observations as well as with the counts derived from HDF. The data from the different patches seem to be rather homogeneous, as strongly suggested from measurements of the angular two-point correlation function which should be sensitive to large-scale gradients in a patch or to relative offsets of the photometric zero-points for the different patches.
As expected EIS-wide has provided large samples (50 to over 200 candidates) of distant clusters of galaxies (Olsen et al. 1998a,b, Scodeggio et al. 1998) and of potentially interesting point sources (Zaggia et al. 1998), more than adequate for the first year of observations with VLT, the main goal of EIS. Some of the targets can also be observed nearly year round. In order to expedite the delivery of the products all the results refer to single exposure frames as discussed in the previous papers of the series. Even though co-addition has been done for all the patches some problems have been uncovered during the verification of the object catalogs extracted from them and require further work. However, the samples already public are sufficiently deep and large for programs to be conducted in the first year of operation of the VLT. The results obtained from the co-added images will become available before the VLT proposal deadline.
This paper completes the first phase of EIS which will now focus on the deep observations of the HDF-south () and AXAF deep () fields. The results presented so far show the value of a public survey providing the community at large with the basic data and tools required to prepare follow-up observations at 8-m class telescopes. The experience acquired by EIS in pipeline processing, data archiving and mining will now be transferred to the Pilot Survey, a deep wide-angle imaging survey to be conducted with the wide-field camera mounted on the ESO/MPIA 2.2m telescope.
Acknowledgements.
We thank all the people directly or indirectly involved in the ESO Imaging Survey effort. In particular, all the members of the EIS Working Group for the innumerable suggestions and constructive criticisms, the ESO Archive Group and the ST-ECF for their support. We also thank the Denis consortium for making available some of their survey data. The DENIS project development was made possible thanks to the contributions of a number of researchers, engineers and technicians in various institutes. The DENIS project is supported by the SCIENCE and Human Capital and Mobility plans of the European Commission under the grants CT920791 and CT940627, by the French Institut National des Sciences de l’Univers, the Education Ministry and the Centre National de la Recherche Scientifique, in Germany by the State of Baden-Wurttemberg, in Spain by the DGICYT, in Italy by the Consiglio Nazionale delle Richerche, by the Austrian Fonds zur Förderung der wissenschaftlichen Forschung und Bundesministerium für Wissenschaft und Forschung, in Brazil by the Fundation for the development of Scientific Research of the State of São Paulo (FAPESP), and by the Hungarian OTKA grants F-4239 and F-013990 and the ESO C & EE grant A-04-046. Our special thanks to the efforts of A. Renzini, VLT Programme Scientist, for his scientific input, support and dedication in making this project a success. Finally, we would like to thank ESO’s Director General Riccardo Giacconi for making this effort possible in the short time available.References
- (1) Campos, A. et al. 1995, Clustering in the Universe, Maurogordato et al. Eds., pp. 403-406.
- (2) Deul et al. 1998, in preparation
- (3) Deul, E., 1998, private communication
- Epchtein et al. (1996) Epchtein, N., et al. , 1996, The Messenger 87, 27
- (5) Landolt, A.U., 1992a, AJ, 104, 340
- (6) Landolt, A.U., 1992b, AJ, 104, 372
- (7) Landy, S.D. & Szalay, A. 1993, ApJ, 494, 1
- (8) Méndez R.A., and van Altena W.F. 1996, AJ, 112, 655
- (9) Neuschaefer, L.W., & Windhorst, R.A., 1995, ApJ, 439, 14
- (10) Nonino, M. et al. , 1998, A&A, in press (paper I)
- (11) Olsen, L.F. et al. , 1998a, submitted A&A; astro-ph/9803338 (paper II)
- (12) Olsen, L.F. et al. , 1998b, submitted A&A; astro-ph/9807156 (paper V)
- (13) Postman, M. et al. 1997, A&AS, 191, 1903P
- (14) Prandoni, I. et al. , 1998, submitted to A&A; astro-ph/9807153 (paper III)
- (15) Renzini, A., & da Costa, L.N. 1997, The ESO Messenger, No 87, p. 23
- (16) Scodeggio, M. et al. , 1998, submitted A&A (paper VII)
- (17) Williams et al. 1996, AJ, 112, 1135
- (18) Zaggia, S. et al. , 1998, submitted A&A; astro-ph/9807152 (paper IV)