ESO Imaging Survey
Abstract
In this paper the list of candidate clusters identified from the I-band data of the ESO Imaging Survey (EIS) is completed using the images obtained over a total area of about 12 square degrees. Together with the data reported earlier the total I-band coverage of EIS is 17 square degrees, which has yielded a sample of 252 cluster candidates in the redshift range . This is the largest optically-selected sample currently available in the Southern Hemisphere. It is also well distributed in the sky thus providing targets for a variety of VLT programs nearly year round.
Key Words.:
Galaxies: clusters: general – large-scale structure of the Universe – Cosmology: observations1 Introduction
The discovery of clusters of galaxies at high redshifts has motivated efforts of compiling lists of candidates for follow-up observations with 8m-class telescopes. The interest in studying these systems spans a broad range of topics and searching for them was identified as one of the primary goals of the ESO Imaging Survey (EIS, Renzini & da Costa 1997), a moderately deep wide-field imaging survey recently conducted at the 3.5m-NTT telescope at La Silla. The main requirements for the cluster search were: 1) to produce a list of candidates large enough to meet the needs of potential VLT programs; 2) to span a broad range of redshifts; 3) to cover a wide range of right ascension thereby allowing the selection of targets year round; 4) to minimize as much as possible spurious detections. These requirements dictated to a large extend the observing strategy adopted by EIS such as the selection of four fields and the preference given to I-band observations in the second-half of the program. While searches in other wavelengths may provide less contaminated and better defined samples (e.g., IR and X-ray searches), optical searches have the advantage of producing large samples at a faster rate than any other search method, especially with the advent of CCD wide-field imagers.
As stated in Olsen et al. (1998a; paper II) the main goal of the EIS cluster search program is to timely provide the astronomical community with a list of cluster candidates that can be used as individual targets for follow-up observations in the Southern Hemisphere, especially with the VLT. It must be emphasized that it is not the intention of the present paper to provide a complete and well-defined sample for statistical studies, since such analysis is beyond the scope of the present effort.
The original aim of EIS was to observe about 20 square degrees in four different patches of the sky as described by Renzini and da Costa (1997) (see also Nonino et al. 1998, paper I), with a significant fraction of the area covered in V and I-bands. However, as described in earlier papers (paper I, Prandoni et al. 1998; paper III) the first-half of the program was severely compromised by bad weather. Therefore, in the second-half, I-band observations covering EIS patches C and D were given priority. The data for these patches are far superior than those of earlier patches and the full coverage of the pre-selected areas was possible, yielding a total area of about 12 square degrees (Benoist et al. 1998, paper VI). In this paper the list of cluster candidates found in these regions by using the cluster finding pipeline described in paper II is presented. The results extend the candidate cluster sample presented in papers II and Olsen et al. (1998b, paper V), providing targets nearly year round.
In section 2 some aspects of the data relevant to the application of the cluster detection algorithm are discussed. In section 3 a list of 198 candidate clusters is presented and the results compared with those of other patches and of the Palomar Distant Cluster Survey (PDCS, Postman et al. 1996), currently the only comparable survey. A brief summary is presented in section 4.
2 Galaxy Catalogs
The generation and the characteristics of the EIS galaxy catalogs in patches C and D have been discussed in paper VI. In that paper they were shown to be considerably more homogeneous than those derived from previous patches, with only small variations in depth. As in previous papers, the odd and even catalogs extracted from single exposure images (paper I and II) were independently used to identify clusters of galaxies. This was done by applying the matched filter algorithm described in paper II to six overlapping sections of approximately the same size covering each of the patches considered. For patch C the sections were chosen to avoid a small ( square degree) shallow region mentioned in paper VI. In order to guarantee a full overlap between the regions covered by the odd and even frames the edges of the patches were also trimmed yielding an effective are of 5.3 and 5.5 square degrees for patches C and D, respectively.
The first set of candidate clusters derived from the even and odd frames consisted of over 100 objects in each patch. However, these included an unusually large number of unpaired highly significant detections. The visual inspection of all candidate clusters, together with the even and odd galaxy catalogs, showed that the observed asymmetries were due to the presence of spurious objects detected in the vicinity of bright, saturated stars. As pointed out in paper VI, the reason for this is possibly an electronic problem of the old EMMI controller, when used in the dual-port readout mode. This problem affected the last three runs of EIS by producing faint light trails associated with saturated stars, when these are located in the lower-half part of the detector. Along the trail a large number of spurious, low surface brightness objects are identified, affecting either the odd or even frames in different parts of the sky, but not both simultaneously for the same star. The fraction of these objects is relatively small and they do not significantly affect the number counts or correlation function. However, they have a significant impact in the performance of the matched-filter algorithm which identifies a large number of cluster candidates near bright stars. Since patches C and D are located at low galactic latitudes, with a large number of saturated stars, the frequency of the problem is large, affecting about 50% of the original detections.
Fortunately, the above problem can be partially overcome taking advantage of the sampling strategy of the survey whereby each position on the sky is sampled at least twice by different parts of the detector (paper I). Since from these single exposures two catalogs are derived, it is possible to overcome the light-trail problem at the catalog level by using, instead of the odd and even catalogs, the catalog which only includes paired galaxies (hereafter, referred to as the paired catalog), detected in both of these catalogs. By construction, this eliminates most spurious objects. The only disadvantage with this procedure is that only one catalog of candidate clusters can be produced and the galaxy sample is slightly shallower. Of course, this solution cannot be applied to samples extracted from the co-added images, which will therefore require some type of correction at the image level. Various alternatives are currently being considered.
3 Catalog of Cluster Candidates
The paired catalogs for the two patches were produced and used as input to the cluster finding pipeline using the same sections and parameters as in the case of the odd/even catalogs. As expected, the use of paired catalogs avoids all cases of cluster candidates that had been detected in the vicinity of light trails and occasionally faint satellite tracks. Note that new candidates are also found, probably because of subtle changes in the background population. It is worth emphasizing that visual inspection of these new candidates shows that they are in general very robust. In order to take advantage of these new detections the final cluster candidate list, shown below, is a combination of all detections derived from the odd/even catalogs, eliminating the spurious detections described in the previous section, supplemented by those derived from the paired catalog.

Table 1 lists 103 cluster candidates in patches C and D detected either at 4 in one or at in both odd/even catalogs. These were the objects considered as “good” candidates in papers II and V. Note that 69% of them were also detected using the paired catalog. Table 2 lists the 56 candidates which were detected at in only one of the even/odd catalogs and in some cases at lower significance in the other. In addition, in contrast to the previous papers, the table also includes 39 candidates, corresponding to 20% of the total sample, which were only detected in the paired catalog. The tables give: in column (1) the identification; in columns (2) and (3) the right ascension and declination in J2000; in column (4) the estimated redshift; in columns (5) and (6) two measures of the cluster richness (see paper II); in columns (7) and (8) the significance of the detection in the even and odd catalogs, respectively; and finally in column (9) the significance of the detection in the paired catalog. In the case of high-z clusters might exceed the limiting magnitude of the catalog, and no estimate of is possible. These cases are indicated by .
In paper II the frequency of noise peaks was estimated to be 0.4 per square degree for the detections and 4.6 per square degree for the detections. Therefore the contamination by spurious detections of the total sample presented in tables 1 and 2 is expected to be 25% with a significantly smaller frequency if only table 1 is considered.
All detections have been visually inspected and nearly all appear to be promising candidates, although the reliability of the low-redshift candidates is usually more difficult to evaluate. As pointed out above, candidates detected in the paired catalog are particularly encouraging. Furthermore, high-redshift clusters are more frequent in the paired catalog than in the odd/even catalogs. This is probably because the galaxy pairing eliminates faint spurious objects. It should be pointed out that there are also cases where a cluster is detected in either one or both odd/even catalogs but is not detected in the paired catalog. This is possibly due to more subtle effects in the background and noise properties of the maximum likelihood maps. In other cases, especially those detected at relatively high significance in one set but not in the other, the center of the candidate cluster and/or the redshift estimate appear to be incorrect. This is most likely due to projection effects of clusters lying along the line-of-sight, which are not well resolved by the searching algorithm. Finally, note that in patches C and D about 90% of the “good” candidates are detected in both the even and odd catalogs, in contrast to the 65% found in patches A and B. This better matching of detections is because the data for patches C and D are significantly more homogeneous than those of previous patches.
Out of the 198 candidates listed in tables 1 and 2, 93 are in patch C and 105 in patch D, over an effective area of 5.3 and 5.5 square degrees, respectively. The implied number density of clusters is about 18.3 clusters/square degree slightly higher than the values found for patch A and by Postman et al. (1996), but similar to the value found for patch B.
The projected distributions of the cluster candidates over the two patches are shown in figure 1. As can be seen in this figure the candidates appear to be distributed uniformly over the whole area of the patches, independently of their significance. Also note that in patch C there are two groupings of cluster candidates, one at , and the other at ,. In the first case there are three detections at and two at . If confirmed the lower redshift system would be an interesting region for follow-up work. The second system corresponds to an overlap of four systems roughly along the same line-of-sight but with redshifts ranging from 0.2 to 0.6. These systems correspond to the cases with large uncertainties in the position of the center and redshift estimate observed during the visual inspection, as discussed in the previous section.
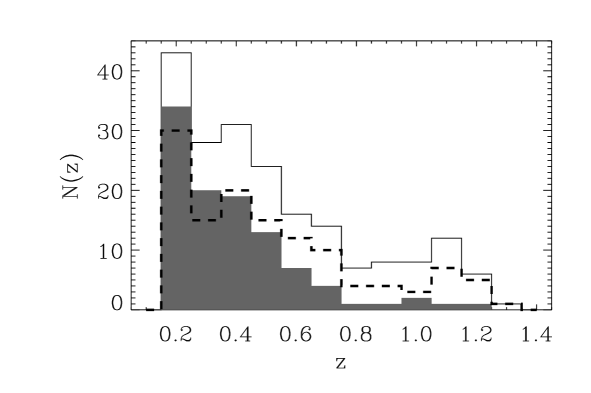
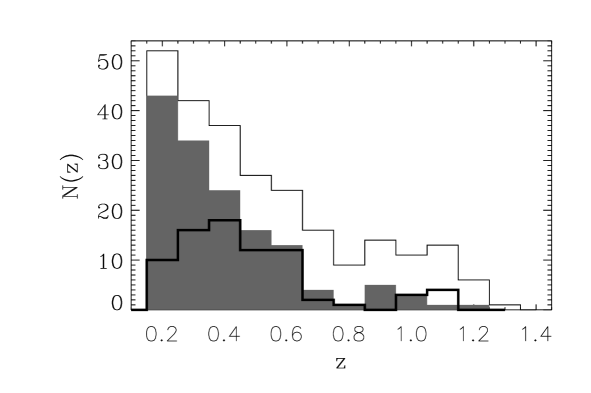
Figure 2 shows the estimated redshift distribution of the combined sample of candidate clusters identified in patches C and D. The median redshift for this sample is 0.4, which is comparable to the values found for patches A and B. Although a similar median redshift is found for the candidates obtained from the paired catalog, their redshift distribution (shown in the figure as the dashed line) shows a tail at the high-redshift end () in contrast to what is seen for the redshift distribution of the good candidates found in the even/odd catalogs (indicated by the shaded area). Recall that the intrinsic uncertainty of the estimated redshifts is no less than 0.1, due to the discreteness of the filter redshift values (paper II). Furthermore, because of the minimal overlap with clusters with known redshift, the absolute accuracy of the redshift estimates, produced by the cluster finding pipeline, cannot be easily quantified. Therefore the current redshift estimates should be considered tentative, until spectroscopic observations become available.
The total sample of EIS cluster candidates, obtained by combining the detections in the four EIS-wide patches, consists of 252 objects in the redshift range . The redshift distribution of the combined sample is shown in figure 3. The median redshift of the distribution is . Note that the EIS redshift distribution differs somewhat from that observed by PDCS, also shown in the figure. The number of EIS candidates decreases monotonically with redshift up to with an extended tail beyond, in contrast to the PDCS which shows a relatively flat distribution peaking at .
4 Summary
This paper completes the presentation of one of the primary products of EIS, namely a large sample of candidate clusters of galaxies spanning a broad range of redshifts, extending to . The candidates were selected in four different patches of the sky covering a large range in right ascension, thereby providing potential targets for VLT which are observable over almost the entire year. Taking all patches together the total sample consists of 252 candidates with about 100 candidates with . This is by far the largest such a sample currently available and should serve as a good starting point for several programs at the VLT. Note that as emphasized in previous papers of this series the selection criteria adopted has been in general conservative and the primary concern has been the reliability of the candidates rather than completeness of the sample. The catalogs of cluster candidates are available at ”http:://www.eso.org/eis” from where image cutouts from the co-added image can be retrieved for evaluation and preparation of follow-up observations.
Recall that the current cluster candidate lists have been prepared based on galaxy catalogs extracted from the single 150 sec exposures. Since these images are being co-added in the near future it will be possible to extract galaxy catalogs which should reach about 0.5 mag deeper. As soon as these catalogs become available they will also be used to search for clusters and it might be possible to extend somewhat the redshift range of the detected cluster candidates and/or confirm previous detections. However, the available sample is sufficiently large and deep to meet most of the scientific needs in the first year of operation of the VLT.
Acknowledgements.
The data presented here were taken at the New Technology Telescope at the La Silla Observatory under the program IDs 59.A-9005(A) and 60.A-9005(A). We thank all the people directly or indirectly involved in the ESO Imaging Survey effort. In particular, all the members of the EIS Working Group for the innumerable suggestions and constructive criticisms. We also thank the ESO Archive Group and ST-ECF for their support. Our special thanks to A. Renzini, VLT Programme Scientist, for his scientific input, support and dedication in making this project a success. Finally, we would like to thank ESO’s Director General Riccardo Giacconi for making this effort possible.References
- (1) Benoist, C., et al. 1998, submitted to A&A; (Paper VI)
- (2) Nonino, M., et al. 1998, submitted to A&A; astro-ph/9803336 (Paper I)
- (3) Olsen, L.F., et al. 1998a, submitted to A&A; astro-ph/9803338 (Paper II)
- (4) Olsen, L.F., et al. 1998b, submitted to A&A; astro-ph/9807156 (Paper V)
- (5) Postman, M., Lubin, L.M., Gunn, J.E., Oke, J.B., Hoessel, J.G., Schneider, D.P., Christensen, J.A. 1996, AJ, 111, 615
- (6) Prandoni, I., et al. 1998, submitted to A&A; astro-ph/9807153 (Paper III)
- (7) Renzini, A. & da Costa, L. N. 1997, Messenger 87, 23
| Cluster name | (J2000) | (J2000) | ||||||||||
|---|---|---|---|---|---|---|---|---|---|---|---|---|
| EIS 05322435 | 05 | 32 | 21.7 | 24 | 35 | 25.3 | 0.4 | 49.2 | 23 | 3.3 | 4.1 | 4.2 |
| EIS 05322428 | 05 | 32 | 55.6 | 24 | 28 | 26.8 | 0.5 | 42.2 | 36 | 4.2 | 2.8 | 3.5 |
| EIS 05332328 | 05 | 33 | 8.9 | 23 | 28 | 54.0 | 0.4 | 60.9 | 62 | 5.3 | 5.5 | 5.6 |
| EIS 05332318 | 05 | 33 | 23.5 | 23 | 18 | 3.8 | 0.4 | 35.8 | 37 | 3.9 | 3.7 | |
| EIS 05332338 | 05 | 33 | 29.9 | 23 | 38 | 33.2 | 0.4 | 49.6 | 45 | 4.5 | 4.4 | 5.2 |
| EIS 05332404 | 05 | 33 | 34.7 | 24 | 4 | 24.1 | 0.4 | 57.9 | 59 | 4.9 | ||
| EIS 05332353 | 05 | 33 | 36.5 | 23 | 53 | 52.9 | 0.7 | 72.0 | 21 | 3.1 | 3.3 | 3.6 |
| EIS 05332320 | 05 | 33 | 37.6 | 23 | 20 | 9.5 | 0.3 | 36.7 | 38 | 4.4 | 4.0 | 4.7 |
| EIS 05342358 | 05 | 34 | 9.2 | 23 | 58 | 59.6 | 0.6 | 71.6 | 22 | 3.6 | 3.9 | 4.2 |
| EIS 05342420 | 05 | 34 | 13.7 | 24 | 20 | 54.5 | 0.2 | 42.1 | 10 | 6.0 | 6.6 | |
| EIS 05342440 | 05 | 34 | 20.1 | 24 | 40 | 35.5 | 0.4 | 54.1 | 54 | 4.5 | 4.5 | 4.6 |
| EIS 05342410 | 05 | 34 | 26.9 | 24 | 10 | 19.1 | 0.3 | 40.2 | 40 | 3.6 | 5.5 | 4.6 |
| EIS 05342400 | 05 | 34 | 48.5 | 24 | 0 | 32.4 | 0.2 | 31.0 | 29 | 5.2 | 5.0 | 5.9 |
| EIS 05342423 | 05 | 34 | 55.0 | 24 | 23 | 45.5 | 0.2 | 41.4 | 26 | 7.9 | 6.4 | 6.9 |
| EIS 05352349 | 05 | 35 | 13.2 | 23 | 49 | 4.2 | 0.4 | 49.1 | 30 | 4.3 | 3.7 | 4.6 |
| EIS 05352436 | 05 | 35 | 41.1 | 24 | 36 | 55.1 | 0.3 | 35.8 | 23 | 3.9 | 4.2 | |
| EIS 05352359 | 05 | 35 | 57.4 | 23 | 59 | 2.7 | 0.8 | 151.5 | 31 | 3.7 | 4.3 | |
| EIS 05362258 | 05 | 36 | 9.4 | 22 | 58 | 3.2 | 1.1 | 210.8 | 99 | 3.8 | 3.0 | 3.1 |
| EIS 05362327 | 05 | 36 | 19.8 | 23 | 27 | 34.5 | 0.3 | 54.4 | 26 | 8.2 | 5.1 | 7.7 |
| EIS 05362320 | 05 | 36 | 46.9 | 23 | 20 | 8.8 | 0.4 | 34.7 | 21 | 3.7 | 3.0 | |
| EIS 05362306 | 05 | 36 | 47.1 | 23 | 6 | 46.6 | 0.2 | 19.7 | 23 | 5.2 | 5.4 | 5.8 |
| EIS 05372429 | 05 | 37 | 39.4 | 24 | 29 | 50.1 | 0.5 | 43.0 | 40 | 3.2 | 3.2 | |
| EIS 05382311 | 05 | 38 | 3.2 | 23 | 11 | 24.2 | 0.6 | 99.3 | 87 | 6.9 | 6.7 | 7.3 |
| EIS 05382438 | 05 | 38 | 12.4 | 24 | 38 | 11.4 | 0.3 | 38.1 | 27 | 4.4 | 4.6 | 5.1 |
| EIS 05382317 | 05 | 38 | 20.6 | 23 | 17 | 20.7 | 0.7 | 81.7 | 109 | 2.9 | 4.2 | |
| EIS 05382348 | 05 | 38 | 33.0 | 23 | 48 | 50.5 | 0.7 | 74.6 | 83 | 4.2 | 3.4 | 3.1 |
| EIS 05382300 | 05 | 38 | 47.1 | 23 | 0 | 26.4 | 0.5 | 44.4 | 19 | 3.0 | 3.5 | 3.9 |
| EIS 05382327 | 05 | 38 | 51.7 | 23 | 27 | 10.4 | 0.2 | 26.8 | 19 | 5.8 | 8.0 | |
| EIS 05392435 | 05 | 39 | 14.0 | 24 | 35 | 30.0 | 0.2 | 32.8 | 19 | 4.6 | 5.1 | 5.0 |
| EIS 05392431 | 05 | 39 | 30.3 | 24 | 31 | 32.2 | 0.4 | 49.9 | 54 | 4.5 | 4.4 | 4.6 |
| EIS 05392334 | 05 | 39 | 36.9 | 23 | 34 | 9.3 | 0.2 | 26.7 | 23 | 5.8 | 5.1 | |
| EIS 05392416 | 05 | 39 | 47.5 | 24 | 16 | 3.8 | 0.3 | 31.5 | 17 | 3.9 | 3.0 | |
| EIS 05392428 | 05 | 39 | 53.3 | 24 | 28 | 57.4 | 0.6 | 71.8 | 24 | 3.7 | 3.8 | 4.3 |
| EIS 05402419 | 05 | 40 | 0.3 | 24 | 19 | 58.6 | 0.2 | 33.7 | 22 | 5.0 | 5.4 | 6.1 |
| EIS 05402420 | 05 | 40 | 14.0 | 24 | 20 | 6.1 | 0.4 | 40.3 | 11 | 4.2 | ||
| EIS 05402330 | 05 | 40 | 23.1 | 23 | 30 | 8.1 | 0.3 | 31.5 | 41 | 4.1 | 3.4 | |
| EIS 05412259 | 05 | 41 | 8.6 | 22 | 59 | 53.0 | 0.2 | 37.5 | 68 | 0.0 | 6.3 | 9.6 |
| EIS 05412440 | 05 | 41 | 32.4 | 24 | 40 | 36.8 | 0.5 | 67.1 | 45 | 4.1 | 3.2 | 3.9 |
| EIS 05412300 | 05 | 41 | 52.6 | 23 | 0 | 25.9 | 0.2 | 32.6 | 37 | 5.7 | 4.5 | |
| EIS 05432322 | 05 | 43 | 8.9 | 23 | 22 | 18.6 | 0.3 | 31.6 | 15 | 4.1 | 3.9 | |
| EIS 05432324 | 05 | 43 | 20.3 | 23 | 24 | 3.5 | 0.2 | 24.2 | 30 | 4.2 | 5.5 | |
| EIS 05432429 | 05 | 43 | 29.9 | 24 | 29 | 38.7 | 0.2 | 30.4 | 36 | 5.3 | 4.7 | 5.8 |
| EIS 05432322 | 05 | 43 | 37.6 | 23 | 22 | 22.9 | 0.7 | 81.5 | 48 | 4.1 | ||
| EIS 05432326 | 05 | 43 | 45.2 | 23 | 26 | 13.1 | 0.6 | 68.9 | 42 | 2.9 | 4.3 | 3.3 |
| EIS 05432322 | 05 | 43 | 58.6 | 23 | 22 | 22.1 | 0.2 | 30.0 | 9 | 5.3 | ||
| EIS 09462029 | 09 | 46 | 12.8 | 20 | 29 | 49.9 | 0.2 | 72.8 | 44 | 9.1 | 8.6 | 8.6 |
| EIS 09462133 | 09 | 46 | 31.1 | 21 | 33 | 10.8 | 0.2 | 33.8 | 21 | 4.5 | 4.9 | 4.4 |
| EIS 09462007 | 09 | 46 | 38.1 | 20 | 7 | 16.0 | 0.5 | 131.1 | 55 | 7.8 | 3.1 | |
| EIS 09472120 | 09 | 47 | 6.9 | 21 | 20 | 55.7 | 0.2 | 43.7 | 50 | 5.8 | 5.5 | 6.2 |
| EIS 09472059 | 09 | 47 | 14.5 | 20 | 59 | 51.0 | 0.3 | 32.5 | 26 | 3.5 | 3.5 | |
| EIS 09472030 | 09 | 47 | 47.3 | 20 | 30 | 4.0 | 1.0 | 133.3 | 23 | 3.1 | 3.2 | 3.6 |
| EIS 09472109 | 09 | 47 | 58.6 | 21 | 9 | 6.2 | 0.2 | 27.2 | 14 | 4.0 | 5.4 | 5.2 |
| EIS 09482044 | 09 | 48 | 8.8 | 20 | 44 | 31.2 | 0.2 | 43.4 | 32 | 5.5 | 5.9 | 6.0 |
| EIS 09482113 | 09 | 48 | 22.1 | 21 | 13 | 55.0 | 0.3 | 41.2 | 53 | 4.7 | ||
| EIS 09482004 | 09 | 48 | 42.5 | 20 | 4 | 12.7 | 1.2 | 257.8 | 99 | 4.1 | 2.6 | 5.3 |
| EIS 09492121 | 09 | 49 | 1.7 | 21 | 21 | 47.2 | 0.4 | 66.7 | 25 | 5.3 | 3.3 | 3.5 |
| Cluster name | (J2000) | (J2000) | ||||||||||
|---|---|---|---|---|---|---|---|---|---|---|---|---|
| EIS 09492139 | 09 | 49 | 7.5 | 21 | 39 | 44.6 | 0.6 | 116.7 | 80 | 5.1 | ||
| EIS 09492101 | 09 | 49 | 22.1 | 21 | 1 | 47.1 | 0.3 | 37.7 | 57 | 3.6 | 3.9 | 4.0 |
| EIS 09492101 | 09 | 49 | 22.9 | 21 | 1 | 50.1 | 0.3 | 29.3 | 25 | 3.5 | 3.2 | 3.7 |
| EIS 09492118 | 09 | 49 | 28.0 | 21 | 18 | 47.6 | 0.4 | 40.7 | 45 | 3.3 | 3.0 | |
| EIS 09492153 | 09 | 49 | 38.0 | 21 | 53 | 44.6 | 0.9 | 129.3 | 32 | 3.6 | 3.3 | 3.4 |
| EIS 09492046 | 09 | 49 | 51.5 | 20 | 46 | 40.6 | 0.2 | 48.8 | 24 | 5.2 | 5.3 | 5.4 |
| EIS 09502129 | 09 | 50 | 16.0 | 21 | 29 | 14.0 | 0.4 | 43.1 | 32 | 3.4 | 3.5 | |
| EIS 09502113 | 09 | 50 | 23.6 | 21 | 13 | 54.3 | 0.4 | 57.3 | 43 | 4.8 | 4.0 | |
| EIS 09502154 | 09 | 50 | 47.9 | 21 | 54 | 39.0 | 0.5 | 69.4 | 33 | 3.5 | 4.2 | 4.0 |
| EIS 09502133 | 09 | 50 | 48.0 | 21 | 33 | 13.1 | 0.2 | 31.5 | 10 | 4.1 | 3.5 | 4.4 |
| EIS 09502138 | 09 | 50 | 53.6 | 21 | 38 | 0.7 | 0.5 | 54.2 | 27 | 4.1 | ||
| EIS 09512052 | 09 | 51 | 8.3 | 20 | 52 | 23.6 | 0.2 | 31.9 | 16 | 3.4 | 3.2 | |
| EIS 09512026 | 09 | 51 | 28.9 | 20 | 26 | 33.0 | 0.2 | 44.2 | 13 | 4.3 | 4.9 | 4.7 |
| EIS 09512145 | 09 | 51 | 46.4 | 21 | 45 | 27.1 | 0.2 | 62.0 | 42 | 8.1 | 7.7 | 7.7 |
| EIS 09522005 | 09 | 52 | 19.3 | 20 | 5 | 4.7 | 0.4 | 65.1 | 37 | 4.5 | 4.4 | 4.5 |
| EIS 09522114 | 09 | 52 | 29.5 | 21 | 14 | 30.6 | 0.3 | 38.7 | 35 | 2.6 | 4.2 | |
| EIS 09522032 | 09 | 52 | 32.6 | 20 | 32 | 40.0 | 0.3 | 106.9 | 156 | 9.0 | 9.7 | 9.3 |
| EIS 09522121 | 09 | 52 | 36.1 | 21 | 21 | 59.6 | 0.4 | 72.8 | 31 | 4.9 | 5.8 | 5.0 |
| EIS 09522138 | 09 | 52 | 37.3 | 21 | 38 | 25.6 | 0.4 | 52.1 | 33 | 4.2 | 4.4 | 4.6 |
| EIS 09522048 | 09 | 52 | 41.1 | 20 | 48 | 25.9 | 0.4 | 55.5 | 37 | 3.0 | 4.5 | |
| EIS 09522150 | 09 | 52 | 46.8 | 21 | 50 | 15.1 | 0.2 | 33.8 | 28 | 2.8 | 4.4 | |
| EIS 09522103 | 09 | 52 | 47.5 | 21 | 3 | 3.1 | 0.2 | 33.4 | 11 | 3.6 | 3.2 | |
| EIS 09532054 | 09 | 53 | 6.0 | 20 | 54 | 17.3 | 0.2 | 50.2 | 6 | 5.4 | 4.9 | |
| EIS 09532024 | 09 | 53 | 15.3 | 20 | 24 | 33.5 | 0.3 | 63.8 | 33 | 6.2 | 6.9 | 6.6 |
| EIS 09532048 | 09 | 53 | 34.6 | 20 | 48 | 51.7 | 0.3 | 46.2 | 49 | 6.2 | 5.5 | |
| EIS 09532154 | 09 | 53 | 35.8 | 21 | 54 | 44.7 | 0.3 | 54.5 | 20 | 4.3 | 5.7 | |
| EIS 09532032 | 09 | 53 | 49.7 | 20 | 32 | 40.0 | 0.3 | 35.1 | 25 | 3.5 | 3.8 | 4.0 |
| EIS 09532114 | 09 | 53 | 52.7 | 21 | 14 | 46.1 | 1.0 | 172.1 | 59 | 3.1 | 3.4 | 3.6 |
| EIS 09532017 | 09 | 53 | 55.5 | 20 | 17 | 20.3 | 0.2 | 36.1 | 14 | 5.2 | 4.6 | 5.6 |
| EIS 09542111 | 09 | 54 | 15.3 | 21 | 11 | 42.1 | 0.5 | 73.2 | 66 | 5.1 | 5.8 | |
| EIS 09542051 | 09 | 54 | 19.5 | 20 | 51 | 57.1 | 0.5 | 62.2 | 34 | 3.9 | 3.2 | 3.6 |
| EIS 09542113 | 09 | 54 | 57.5 | 21 | 13 | 11.2 | 0.5 | 96.5 | 82 | 6.2 | 4.3 | 5.2 |
| EIS 09552123 | 09 | 55 | 2.3 | 21 | 23 | 6.7 | 0.2 | 53.3 | 26 | 6.9 | 7.5 | 7.5 |
| EIS 09552037 | 09 | 55 | 16.9 | 20 | 37 | 4.1 | 0.2 | 37.1 | 37 | 5.3 | 4.1 | 4.7 |
| EIS 09552144 | 09 | 55 | 19.2 | 21 | 44 | 34.5 | 0.6 | 85.0 | 107 | 4.3 | 4.3 | 4.0 |
| EIS 09552013 | 09 | 55 | 30.7 | 20 | 13 | 51.1 | 0.5 | 51.9 | 31 | 3.1 | 3.2 | 3.8 |
| EIS 09562054 | 09 | 56 | 2.7 | 20 | 54 | 8.6 | 0.2 | 38.1 | 28 | 5.5 | 5.0 | 5.6 |
| EIS 09562026 | 09 | 56 | 24.0 | 20 | 26 | 58.7 | 0.2 | 31.8 | 19 | 4.6 | 4.6 | 5.6 |
| EIS 09562101 | 09 | 56 | 24.9 | 21 | 1 | 11.7 | 0.4 | 53.4 | 22 | 4.3 | 4.0 | 4.5 |
| EIS 09562059 | 09 | 56 | 25.2 | 20 | 59 | 49.8 | 0.3 | 39.7 | 37 | 4.7 | 4.5 | 4.8 |
| EIS 09562009 | 09 | 56 | 28.6 | 20 | 9 | 27.4 | 0.5 | 58.2 | 22 | 3.5 | 3.0 | 3.9 |
| EIS 09562050 | 09 | 56 | 42.0 | 20 | 50 | 47.9 | 0.2 | 27.2 | 48 | 2.8 | 6.5 | |
| EIS 09562044 | 09 | 56 | 56.9 | 20 | 44 | 17.7 | 0.5 | 96.0 | 61 | 3.1 | 6.0 | |
| EIS 09562107 | 09 | 56 | 57.9 | 21 | 7 | 33.3 | 0.3 | 30.1 | 51 | 3.0 | 3.6 | 4.0 |
| EIS 09572051 | 09 | 57 | 7.2 | 20 | 51 | 44.3 | 0.2 | 27.9 | 36 | 4.0 | 4.9 | |
| EIS 09572143 | 09 | 57 | 14.5 | 21 | 43 | 27.5 | 0.2 | 51.2 | 23 | 6.0 | 7.2 | 6.7 |
| EIS 09572016 | 09 | 57 | 30.3 | 20 | 16 | 25.5 | 0.6 | 96.7 | 47 | 5.6 | ||
| Cluster name | (J2000) | (J2000) | ||||||||||
|---|---|---|---|---|---|---|---|---|---|---|---|---|
| EIS 05322303 | 05 | 32 | 28.9 | 23 | 3 | 23.1 | 1.1 | 191.5 | 99 | 3.0 | ||
| EIS 05332359 | 05 | 33 | 0.3 | 23 | 59 | 32.5 | 0.7 | 81.0 | 22 | 3.3 | ||
| EIS 05332307 | 05 | 33 | 6.9 | 23 | 7 | 21.1 | 1.2 | 283.7 | 99 | 3.5 | ||
| EIS 05332317 | 05 | 33 | 24.0 | 23 | 17 | 52.3 | 0.7 | 92.1 | 35 | 4.5 | ||
| EIS 05332417 | 05 | 33 | 24.8 | 24 | 17 | 58.1 | 0.4 | 33.0 | 26 | 3.2 | ||
| EIS 05332411 | 05 | 33 | 26.9 | 24 | 11 | 50.3 | 0.5 | 47.7 | 24 | 3.3 | ||
| EIS 05332412 | 05 | 33 | 40.3 | 24 | 12 | 43.8 | 1.1 | 299.2 | 72 | 3.3 | ||
| EIS 05332441 | 05 | 33 | 41.5 | 24 | 41 | 51.8 | 0.7 | 77.2 | 86 | 3.0 | 2.8 | |
| EIS 05332258 | 05 | 33 | 43.2 | 22 | 58 | 45.4 | 0.9 | 107.3 | 46 | 3.1 | ||
| EIS 05332418 | 05 | 33 | 46.0 | 24 | 18 | 52.1 | 0.5 | 70.3 | 66 | 5.2 | ||
| EIS 05332355 | 05 | 33 | 54.4 | 23 | 55 | 33.1 | 0.8 | 86.9 | 84 | 3.5 | ||
| EIS 05342430 | 05 | 34 | 12.5 | 24 | 30 | 17.9 | 1.0 | 173.4 | 99 | 3.0 | 2.9 | |
| EIS 05342405 | 05 | 34 | 55.3 | 24 | 5 | 20.6 | 0.7 | 81.1 | 54 | 3.3 | ||
| EIS 05352402 | 05 | 35 | 7.4 | 24 | 2 | 28.4 | 0.4 | 46.3 | 45 | 2.6 | 3.9 | |
| EIS 05352344 | 05 | 35 | 11.0 | 23 | 44 | 9.6 | 1.2 | 282.6 | 12 | 3.5 | ||
| EIS 05352335 | 05 | 35 | 33.9 | 23 | 35 | 6.2 | 0.3 | 31.5 | 18 | 3.8 | ||
| EIS 05352413 | 05 | 35 | 39.1 | 24 | 13 | 17.0 | 0.5 | 47.8 | 37 | 3.1 | ||
| EIS 05352302 | 05 | 35 | 46.4 | 23 | 2 | 9.2 | 0.3 | 31.6 | 30 | 2.7 | 3.8 | |
| EIS 05362334 | 05 | 36 | 40.4 | 23 | 34 | 39.3 | 0.5 | 42.5 | 29 | 3.3 | ||
| EIS 05372331 | 05 | 37 | 16.8 | 23 | 31 | 1.0 | 0.2 | 44.6 | 31 | 10.2 | ||
| EIS 05372354 | 05 | 37 | 17.9 | 23 | 54 | 46.2 | 0.8 | 83.3 | 29 | 3.7 | 2.6 | 3.4 |
| EIS 05372444 | 05 | 37 | 28.0 | 24 | 44 | 18.8 | 0.3 | 22.6 | 6 | 3.0 | 2.6 | |
| EIS 05382334 | 05 | 38 | 0.1 | 23 | 34 | 33.0 | 1.1 | 173.9 | 99 | 3.0 | ||
| EIS 05382405 | 05 | 38 | 5.1 | 24 | 5 | 6.8 | 0.8 | 100.2 | 44 | 3.0 | 2.8 | 3.2 |
| EIS 05382345 | 05 | 38 | 12.0 | 23 | 45 | 6.2 | 0.9 | 97.5 | 43 | 3.3 | 2.8 | |
| EIS 05382331 | 05 | 38 | 48.0 | 23 | 31 | 41.1 | 0.5 | 37.4 | 16 | 2.8 | 3.1 | |
| EIS 05382304 | 05 | 38 | 49.0 | 23 | 4 | 10.2 | 0.7 | 61.8 | 37 | 2.9 | 3.0 | 3.3 |
| EIS 05382404 | 05 | 38 | 51.0 | 24 | 4 | 53.0 | 1.1 | 255.6 | 99 | 3.5 | ||
| EIS 05392341 | 05 | 39 | 23 | 41 | 31.7 | 0.6 | 47.0 | 38 | 3.2 | |||
| EIS 05392313 | 05 | 39 | 1.8 | 23 | 13 | 56.0 | 0.4 | 31.3 | 17 | 3.7 | ||
| EIS 05392348 | 05 | 39 | 5.8 | 23 | 48 | 5.8 | 0.2 | 64.1 | 23 | 14.6 | ||
| EIS 05402308 | 05 | 40 | 7.6 | 23 | 8 | 10.4 | 0.7 | 87.5 | 56 | 3.7 | ||
| EIS 05402418 | 05 | 40 | 8.5 | 24 | 18 | 19.3 | 0.6 | 83.8 | 40 | 4.9 | ||
| EIS 05402310 | 05 | 40 | 11.4 | 23 | 10 | 48.3 | 0.4 | 30.8 | 37 | 3.4 | ||
| EIS 05402343 | 05 | 40 | 18.5 | 23 | 43 | 13.1 | 0.6 | 64.0 | 12 | 3.4 | ||
| EIS 05402315 | 05 | 40 | 20.8 | 23 | 15 | 11.5 | 0.7 | 79.2 | 32 | 3.3 | ||
| EIS 05402405 | 05 | 40 | 29.4 | 24 | 5 | 50.1 | 0.2 | 27.5 | 17 | 5.0 | ||
| EIS 05402309 | 05 | 40 | 57.1 | 23 | 9 | 4.8 | 0.6 | 60.9 | 36 | 3.3 | ||
| EIS 05412437 | 05 | 41 | 15.2 | 24 | 37 | 32.0 | 0.5 | 48.0 | 63 | 2.5 | 3.0 | |
| EIS 05412432 | 05 | 41 | 16.8 | 24 | 32 | 32.1 | 0.4 | 44.4 | 40 | 3.7 | 2.9 | 3.1 |
| EIS 05412316 | 05 | 41 | 39.0 | 23 | 16 | 6.2 | 0.2 | 38.3 | 25 | 7.3 | ||
| EIS 05412305 | 05 | 41 | 48.6 | 23 | 5 | 35.5 | 0.8 | 89.6 | 52 | 3.1 | ||
| EIS 05412400 | 05 | 41 | 55.8 | 24 | 0 | 36.7 | 1.2 | 489.5 | 99 | 4.7 | ||
| EIS 05422300 | 05 | 42 | 34.3 | 23 | 0 | 20.1 | 0.3 | 35.2 | 21 | 4.8 | ||
| EIS 05422436 | 05 | 42 | 53.6 | 24 | 36 | 57.7 | 0.2 | 34.1 | 13 | 5.8 | ||
| EIS 05432359 | 05 | 43 | 29.6 | 23 | 59 | 51.7 | 1.1 | 243.1 | 99 | 3.2 | 2.9 | 3.9 |
| EIS 05432421 | 05 | 43 | 35.8 | 24 | 21 | 20.3 | 1.0 | 167.7 | 22 | 3.1 | ||
| EIS 05442426 | 05 | 44 | 2.8 | 24 | 26 | 51.0 | 0.2 | 33.3 | 28 | 5.6 | ||
| EIS 09452005 | 09 | 45 | 58.0 | 20 | 5 | 38.5 | 0.9 | 124.2 | 62 | 2.7 | 3.7 | 3.5 |
| EIS 09462103 | 09 | 46 | 2.0 | 21 | 3 | 18.9 | 1.0 | 152.5 | 45 | 3.9 | ||
| EIS 09462053 | 09 | 46 | 5.2 | 20 | 53 | 41.5 | 0.6 | 66.5 | 49 | 3.3 | 2.9 | 3.5 |
| EIS 09462023 | 09 | 46 | 45.4 | 20 | 23 | 54.8 | 0.3 | 36.7 | 30 | 3.9 | ||
| EIS 09472044 | 09 | 47 | 17.4 | 20 | 44 | 5.0 | 0.9 | 103.6 | 39 | 2.7 | 3.4 | 3.3 |
| EIS 09472025 | 09 | 47 | 17.6 | 20 | 25 | 41.8 | 0.9 | 113.9 | 60 | 3.1 | ||
| EIS 09472057 | 09 | 47 | 34.9 | 20 | 57 | 24.3 | 0.4 | 43.9 | 29 | 2.7 | 3.5 | |
| EIS 09482123 | 09 | 48 | 17.5 | 21 | 23 | 33.3 | 0.4 | 40.5 | 26 | 2.9 | 3.0 | 3.1 |
| Cluster name | (J2000) | (J2000) | ||||||||||
|---|---|---|---|---|---|---|---|---|---|---|---|---|
| EIS 09482129 | 09 | 48 | 24.1 | 21 | 29 | 14.8 | 0.7 | 80.7 | 36 | 3.2 | ||
| EIS 09482151 | 09 | 48 | 46.8 | 21 | 51 | 34.7 | 1.0 | 203.7 | 99 | 3.4 | 3.1 | |
| EIS 09492147 | 09 | 49 | 0.0 | 21 | 47 | 10.7 | 1.1 | 239.3 | 76 | 3.4 | ||
| EIS 09492058 | 09 | 49 | 32.6 | 20 | 58 | 29.5 | 0.5 | 58.2 | 63 | 2.9 | 3.3 | 3.2 |
| EIS 09492117 | 09 | 49 | 51.6 | 21 | 17 | 24.1 | 0.5 | 63.1 | 88 | 3.9 | ||
| EIS 09502103 | 09 | 50 | 8.0 | 21 | 3 | 40.7 | 0.2 | 23.8 | 2 | 3.3 | 2.6 | |
| EIS 09502018 | 09 | 50 | 14.4 | 20 | 18 | 39.2 | 1.1 | 170.6 | 99 | 3.5 | ||
| EIS 09502108 | 09 | 50 | 19.9 | 21 | 8 | 12.0 | 1.1 | 192.4 | 40 | 3.1 | ||
| EIS 09502123 | 09 | 50 | 23.5 | 21 | 23 | 58.2 | 0.6 | 60.2 | 39 | 3.2 | ||
| EIS 09512146 | 09 | 51 | 3.8 | 21 | 46 | 8.9 | 0.6 | 53.4 | 20 | 3.3 | 2.7 | 3.3 |
| EIS 09512102 | 09 | 51 | 30.8 | 21 | 2 | 54.4 | 0.4 | 49.4 | 35 | 3.4 | 2.7 | 3.0 |
| EIS 09512046 | 09 | 51 | 31.8 | 20 | 46 | 56.6 | 0.5 | 65.1 | 25 | 3.5 | 2.7 | 3.3 |
| EIS 09512016 | 09 | 51 | 38.1 | 20 | 16 | 2.8 | 1.3 | 321.6 | 99 | 3.7 | ||
| EIS 09522047 | 09 | 52 | 32.5 | 20 | 47 | 34.1 | 0.7 | 79.6 | 49 | 3.1 | ||
| EIS 09522012 | 09 | 52 | 36.3 | 20 | 12 | 57.2 | 1.1 | 168.7 | 99 | 3.4 | ||
| EIS 09522144 | 09 | 52 | 48.7 | 21 | 44 | 32.6 | 0.2 | 36.1 | 41 | 4.7 | ||
| EIS 09522009 | 09 | 52 | 49.0 | 20 | 9 | 27.2 | 0.9 | 93.0 | 17 | 3.2 | ||
| EIS 09532052 | 09 | 53 | 4.4 | 20 | 52 | 48.5 | 0.2 | 38.9 | 19 | 4.2 | ||
| EIS 09532105 | 09 | 53 | 6.3 | 21 | 5 | 29.2 | 1.0 | 186.0 | 99 | 3.8 | ||
| EIS 09532145 | 09 | 53 | 9.0 | 21 | 45 | 49.7 | 0.3 | 31.2 | 14 | 3.4 | ||
| EIS 09532041 | 09 | 53 | 51.5 | 20 | 41 | 52.1 | 0.4 | 41.5 | 49 | 3.6 | ||
| EIS 09542120 | 09 | 54 | 1.2 | 21 | 20 | 3.2 | 0.9 | 110.4 | 42 | 2.5 | 3.1 | |
| EIS 09542011 | 09 | 54 | 32.8 | 20 | 11 | 13.3 | 0.8 | 91.6 | 21 | 3.6 | ||
| EIS 09542023 | 09 | 54 | 47.5 | 20 | 23 | 55.2 | 1.1 | 217.9 | 52 | 3.3 | ||
| EIS 09552033 | 09 | 55 | 15.5 | 20 | 33 | 59.8 | 0.4 | 42.4 | 31 | 3.8 | ||
| EIS 09552137 | 09 | 55 | 19.1 | 21 | 37 | 59.7 | 0.5 | 43.6 | 36 | 3.0 | ||
| EIS 09552113 | 09 | 55 | 32.3 | 21 | 13 | 55.3 | 0.6 | 68.2 | 67 | 3.2 | ||
| EIS 09552008 | 09 | 55 | 36.3 | 20 | 8 | 26.2 | 1.0 | 153.3 | 26 | 3.2 | 2.6 | |
| EIS 09552109 | 09 | 55 | 51.1 | 21 | 9 | 57.4 | 0.7 | 71.5 | 67 | 3.1 | ||
| EIS 09562024 | 09 | 56 | 11.9 | 20 | 24 | 21.2 | 1.2 | 252.7 | 99 | 3.0 | ||
| EIS 09562053 | 09 | 56 | 29.0 | 20 | 53 | 41.6 | 0.4 | 40.3 | 25 | 3.5 | 3.4 | |
| EIS 09562154 | 09 | 56 | 53.6 | 21 | 54 | 36.5 | 0.4 | 35.5 | 15 | 3.3 | ||
| EIS 09572028 | 09 | 57 | 0.6 | 20 | 28 | 42.6 | 0.8 | 85.7 | 40 | 3.2 | ||
| EIS 09572104 | 09 | 57 | 1.0 | 21 | 4 | 37.6 | 1.1 | 188.9 | 25 | 3.1 | ||
| EIS 09572005 | 09 | 57 | 9.6 | 20 | 5 | 29.4 | 1.2 | 256.6 | 99 | 3.2 | 3.7 | |
| EIS 09572038 | 09 | 57 | 11.9 | 20 | 38 | 46.6 | 0.5 | 58.8 | 9 | 3.6 | ||
| EIS 09572044 | 09 | 57 | 15.8 | 20 | 44 | 54.4 | 0.3 | 36.1 | 17 | 3.9 | ||
| EIS 09572013 | 09 | 57 | 26.2 | 20 | 13 | 21.5 | 0.6 | 62.3 | 28 | 3.5 | ||
| EIS 09572132 | 09 | 57 | 31.0 | 21 | 32 | 40.9 | 0.3 | 38.3 | 6 | 4.2 | ||