Heavy obscuration in X–ray weak AGNs
Abstract
We present observations in the 0.1–100 keV spectral band of 8 Seyfert 2 galaxies, obtained by means of BeppoSAX. These sources were selected according to their [OIII] optical emission line flux, to avoid biases against obscuration on the pc scale. All sources were detected. All of them are weak X–ray emitters, and most of them are characterized by prominent iron lines at 6.4–7 keV (EW eV) and by a flat continuum, indicative of heavy obscuration along our line of sight (N cm-2 in most cases). These results 1) provide further evidence in favor of the unified scenario, and 2) indicate that the average obscuration of type 2 AGNs is very likely much higher than deduced by former X–ray surveys. These findings have important implications for the synthesis of the X–ray background.
Key Words.:
X rays: galaxies – Galaxies: Seyfert – Galaxies: active1 Introduction
The spectra of active galactic nuclei (AGNs) at high energies (3 keV) provide important information on the physics of the nuclear region. Unfortunately, the limited sensitivity of current and past X–ray missions has usually restricted the investigation to bright AGNs. Little is known about the hard X–ray properties of low luminosity AGNs. This problem concerns particularly Seyfert 2s, since they are generally weaker than their type 1 counterparts. Yet, the hard X–ray properties of type 2 Seyferts are most interesting, since they provide important information on the obscuration affecting this class of objects.
Several observational data indicate that type 2 Seyfert nuclei suffer significant obscuration along our line of sight. The nature of the obscuring medium is matter of debate. The unified model (Antonucci antonucci (1993)) ascribes the obscuration of Sy2 nuclei to a gaseous pc-scale circumnuclear torus. According to this model Sy1s and Sy2s would be identical physical objects, while the orientation of the line of sight with respect to the torus would be responsible for the obscuration of the BLR and of the nuclear engine (X–UV source) in type 2 Seyferts. Hard X–ray spectra are probably the best observational tool to directly measure the absorption affecting Sy2 nuclei. Indeed, Sy2 spectra in the 2–10 keV range show evidence for a power law component similar to that observed in Sy1s (photon index 1.7) and a cutoff due to photoelectric absorption. The latter indicates absorbing column densities between and cm-2 (e.g. Awaki awaki2 (1991), Ueno et al. ueno2 (1996), Smith & Done smith (1996), Turner et al. 1997a ), often ascribed to the obscuring torus.
In some sources the absorbing column density is so high (Ncm-2) that it is optically thick to Compton scattering. In this case the direct component is completely absorbed in the 2–10 keV range. However, the nuclear radiation can be Compton reflected by cold material surrounding the X–ray source (possibly the same torus responsible for the obscuration) or scattered by free electrons in a highly ionized warm gas. If these media extend outside the absorbing torus, then signatures of the X–ray nuclear activity are observable via the reflected/scattered continuum. Also, the cold reflecting medium produces a fluorescence iron line at 6.4 keV, while He– and H–like iron in the warm scattering medium should emit lines at 6.7 and 6.96 keV. Since the direct continuum is completely suppressed in Compton thick sources, these iron lines are characterized by equivalent widths ( keV) larger than in Sy1s or in Compton thin Sy2s. Until a few years ago NGC1068 was the only Compton thick source known. A few more sources of this class have been discovered recently (see Matt matt_b (1997) for a review).
As anticipated above, Sy2s in early spectroscopic studies were mostly selected from former all–sky X–ray surveys, hence these studies were generally biased for X–ray bright objects. Very likely, this selection criterion resulted in a bias in favor of low NH Sy2s. Later on, hard X–ray spectroscopic studies (mostly by means of ASCA) probed fainter samples of AGNs (e.g. Turner et al. 1997a ). However, many of the Sy2s observed by ASCA were selected amongst sources known to show broad lines in polarized light (Awaki et al. awaki (1997)). This selection criterion might introduce a bias for low NH as well. Heisler et al. (heisler (1997)) showed that the detectability of polarized broad lines is related to the obscuration of the nuclear region.
Summarizing, former X–ray spectroscopic surveys were seriously biased against heavily obscured Sy2s and, therefore, they are not suitable to study the real distribution of the absorbing column densities NH.
The knowledge of the distribution of NH in Sy2s is important to understand the nature of their obscuring medium, which has implications for the unified model. Also, the distribution of NH is relevant to the synthesis of the X–ray background. Indeed, obscured AGNs are thought to contribute to most of the high energy ( 2 keV) extragalactic background (Comastri et al. comastri (1995), Madau et al. madau (1993)).
2 The weak Sy2 BeppoSAX core program
We have undertaken a program of observations with BeppoSAX, the Italian–Dutch X–ray satellite, aimed at studying the hard X–ray properties of weak Sy2s and at assessing the “real” distribution of their absorbing column densities.
As described in the next section, BeppoSAX is an excellent tool to pursue this goal, since it combines high sensitivity (required to observe weak AGNs) and a wide spectral coverage (0.1–300 keV, required to identify and disentangle various spectral components).
Sy2s suitable for this study were drawn out of Maiolino & Rieke’s (maiolino_a (1995)) sample. This sample is extracted from the Revised Shapley-Ames (RSA) catalog of galaxies (that is limited to magnitude , Sandage & Tammann sandage (1987)), and Seyfert galaxies are selected according to their optical lines. As discussed in Maiolino & Rieke, this sample is much less biased than others, both in terms of luminosity of the Seyfert nuclei and in terms of properties of their host galaxies. Out of the 54 Sy2s in the Maiolino & Rieke sample 22 have already been observed by ASCA. We selected 8 of the remaining 32 Sy2s, based on their [OIII]5007Å(narrow) line flux: to maximize the chances of detection we chose the sources showing the highest [OIII] flux. Maiolino & Rieke also show that, although the [OIII] line is emitted on scales much larger than the putative pc-scale torus, the [OIII] is not a completely isotropic indicator of the nuclear luminosity, for the host galaxy disk might obscure part of the NLR. However, once the [OIII] flux is corrected for the extinction deduced from the Balmer decrement, it should provide an indication of the nuclear activity that is independent of the pc-scale obscuration due to the torus. As a consequence, although our [OIII]-based selection criterion might introduce a bias in our sample for intrinsically luminous sources, it avoids biases against highly obscured Sy2 nuclei, thus overcoming limitations of former surveys.
Preliminary results of this survey were published in Salvati et al. (salvati (1997), salvati2 (1998)). In this paper we report and discuss results of BeppoSAX observations for all of the 8 Seyfert 2s in our [OIII] selected sample. A more thorough statistical analysis, obtained by merging our BeppoSAX data with data in the literature, is presented in Bassani et al. (in prep.).
3 Observations and data reduction
A description of the BeppoSAX observatory is given in Boella et al. (1997a ). The payload instruments include four co–aligned narrow field instruments: a Low Energy Concentrator Spectrometer (LECS, Parmar et al. parmar (1997)), three Medium Energy Concentrator Spectrometers (MECS, Boella et al. 1997b ), a High Pressure Gas Scintillation Proportional Counter (HPGSPC, Manzo et al. manzo (1997)) and a Phoswich Detector System (PDS, Frontera et al. frontera (1997)). Both LECS and MECS spectrometers have imaging capabilities (angular resolution 1.2 arcmin, FWHM) and cover the 0.1–10 keV and 1.5–10 keV spectral bands, respectively (in the overlapping spectral region the MECS are three times more sensitive than LECS). Their energy resolution is about 8% at 6 keV. HPGSPC and PDS operate in the 4–120 keV and 15–300 keV spectral bands, respectively. In the overlapping region the PDS is more sensitive (by a factor of 4–8), while the HPGSPC has superior energy resolution.
Table 1 lists the sources observed in our program so far, along with the on–source total integration time and net count rate (i.e. background subtracted) for each instrument. One of the MECS units stopped working in May 1997, as a consequence MCG-05-18-002 was observed with two MECS units only.
| Source | Observation start | LECS (0.1-4keV) | MECS (1.65-10.5 keV) | PDS (15-100 keV) | |||
|---|---|---|---|---|---|---|---|
| Date | Durationa | net countsb | Durationa | net countsb | Durationa | net countsb | |
| NGC1386 | 10/12/96 | 10.3 | 518.6 | 30.2 | 15842 | –c | –c |
| NGC2273 | 22/02/97 | 10.0 | 309 | 24.2 | 31823 | 12 | 1150 |
| NGC3081 | 20/12/96 | 8.9 | 5212 | 15.4 | 24120 | 7 | 870 |
| NGC3393 | 08/01/97 | 6.4 | 610 | 14.7 | 8115 | 6 | 1509492 |
| NGC4939 | 27/01/97 | 13.6 | 12816 | 33.3 | 60830 | 15.8 | 3542823 |
| NGC4941 | 22/01/97 | 14.3 | 4814 | 28.8 | 24523 | 14 | 1325642 |
| NGC5643 | 01/03/97 | 7.4 | 528 | 10.4 | 23718 | 5 | 430 |
| MCG-05-18-002 | 21/11/97 | 3.6 | 167 | 8.9d | 6011d | 4 | 690 |
The uncertainties on the fluxes are 1. Notes:
-
a In ksec.
-
b (Source – background) .
-
c During the observation of NGC 1386 the PDS beam (1.4∘ wide) also included NGC 1365; the detected flux is dominated by the latter (Maiolino et al. in preparation).
-
d This observation was performed with two MECS units only.
For all sources, but NGC 5643, LECS and MECS spectra were extracted from an aperture of 8′ and 4′ in radius, since these apertures were found to optimize the signal–to–noise ratios for these faint sources. For NGC 5643 we chose an extraction radius of 1′, since outside of this radius the observed flux is affected by the emission of a nearby galaxy cluster (see Sect. 4.4). Another exception is NGC 1386, where we used for the LECS the same extraction aperture used for the MECS (i.e. 4′ in radius) to avoid different contributions to the soft X–ray flux from the surrounding Fornax cluster. The background was extracted by using the same apertures in blank sky observation files.
The PDS consists of four phoswich units, two pointing at the source and the other two 210′ away. The two pairs switch on and off source every 96 seconds. The net count rate is obtained by subtracting the “off” counts from the “on” counts.
We rebinned the spectra to have a minimum of 10 counts per channel (source background), so that statistics can be treated in the Poissonian limit and the energy resolution is not affected significantly.
We did not detect short term variability in any of our sources. However, the signal–to–noise is too low to provide stringent constraints since these sources are weak and the integration times relatively short.
4 Spectral analysis and constraints on NH
4.1 Continuum fitting
We used three models to fit the observed continuum.
-
1.
Transmission model (Compton thin). It consists of a power law (similar to that observed in Sy1s) transmitted through an absorbing cold medium.
-
2.
Warm scattering model (Compton thick). This model assumes that the primary power law is completely absorbed along our line of sight by a medium that is thick to Compton scattering. However, the primary radiation is scattered into our line of sight by a warm, highly ionized gas located outside the absorbing medium. As a consequence, this model consists of a power law with no absorption in excess of the Galactic value.
-
3.
Cold reflection model (Compton thick). As in model 2, here the primary radiation is completely absorbed along our line of sight by Compton thick material. However, in this model the primary radiation is Compton reflected into our line of sight by a cold, neutral material in the circumnuclear region, possibly identified with the same torus responsible for the obscuration. In this case, the spectral model consists of the “hump” characteristic of the cold reflection. In the 2–10 keV range, the continuum is much flatter than the primary radiation.
Since the sources in our sample are weak, several of our spectra have low signal–to–noise ratio in the continuum. Therefore, we reduced to the minimum possible the number of free parameters. In particular, we froze the photon index of the continuum to 1.7 in all models. This is the average photon index in Sy1 galaxies and it is thought to arise from a primary power law with photon index 1.9 flattened, in the 2-20 keV range, by a cold reflection component due to reprocessing by the accretion disk (Nandra & Pounds nandra (1994); Nandra et al. nandra2 (1997)).
However, to allow for a comparison with other studies in the literature where is a free parameter, in the Appendix we also report results of transmission model fits with this additional degree of freedom.
In most cases the extrapolation of the continuum model fitted at high energies ( keV) falls short of accounting for the emission in the soft X–ray range ( keV). Therefore, we also introduced a black body component (kT a few 0.1 keV) to account for this “soft excess”. The black body is just an analitical form that fits nicely the spectrum below keV, but it does not necessary reflect the real nature of this flux; this will be discussed in Sect. 5.4.
However, only data above 3 keV were used to statistically discriminate between the transmission, warm scattering and cold reflection models, so that the were little affected by the soft excess.
In all models, Galactic photoelectric absorption is included.
4.2 The Fe line
The hard X–ray spectrum of Seyfert galaxies is usually characterized by a fluorescent line at 6.4 keV produced by low ionization iron (i.e. iron with no vacancies in the L shell, and then less ionized than Fe xvii). Also, in some cases (e.g. NGC 1068, Ueno et al. ueno (1994)) recombination/resonant emission from He–like (6.7 keV) and H–like iron (6.96 keV) is observed.
Our fit includes an unresolved gaussian, whose central energy is left free, to account for the iron line. In some cases there are indications that the iron line is resolved; in these cases we tried to fit the line with two gaussians centered at 6.4+6.7 keV (neutral and He–like iron) or at 6.4+6.96 keV (neutral and H–like iron). The two-components fit was considered significant only if the probability improved at a confidence level of at least 90% .
The equivalent width (EW) of the fluorescence 6.4 keV Fe K line provides useful information to constrain the column density that absorbs the continuum and, in some cases, to distinguish between the Compton thick and the Compton thin cases. This fluorescence line is thought to arise from the accretion disk (Lightman & White lightman (1988); Fabian et al. fabian (1989)) and, possibly, from the torus as well (Ghisellini et al. ghisellini (1994)), with EW(Fe K) 200–300 eV. Cold absorbing column densities Ncm-2 do not change significantly the observed EW(Fe K), since the photoelectric cutoff occurs at energies lower than 6 keV. The presence of an absorbing medium with N depresses the continuum beneath the iron lines and, if the line is produced by material more extended than the obscuring medium, the EW increases. Moreover, line photons are produced in the absorber itself, whose EW may be significant provided that the covering factor is large enough. EW(Fe K) 1 keV is characteristic of purely reflected/scattered spectra and, therefore, indicates complete absorption of the primary radiation, and then is used to identify Compton thick candidates. Interpreting EW(Fe K) 1keV with a Compton thin, low absorption model would require an iron gas abundance several times higher than the cosmic value (e.g. Matt et al. 1997a ).
The K lines from He– and H–like iron (6.7 and 6.96 keV respectively) are emitted from highly ionized gas. Their EW with respect to the scattered component can be as high as a few keV (Matt et al. matt_a (1996)), while, if the primary radiation is visible, they are likely to be diluted to invisibility. Therefore, detection of lines with EW(Fe6.7+6.96) 1 keV is a clue that the primary radiation is heavily absorbed, i.e. Ncm-2. However, determining the properties of the obscuring material and of the scattering medium from the EW of these high ionization lines presents more uncertainties than the 6.4 keV line. Indeed, the intensity of the He– and H– lines depends non linearly from the optical thickness of the scattering gas. Also, starburst activity can increase the intensity of these lines. On the other hand cases where the 6.7–6.96 keV lines dominate are rare: in most Sy2s the 6–7 keV region is dominated by the line at 6.4 keV (Turner et al. 1997a , also this paper Sect. 4.4).
Finally, we should mention that, both in terms of EW (Fe K) and continuum shape, objects obscured by a column density Ncm-2 look like purely reflected sources in the 2–10 keV range (ASCA); however, their Compton thickness, even if larger than unity, is still small enough to permit transmission of a significant fraction of photons in the 10–100 keV range. So far, only NGC4945 and Mkn3 are known to belong to this class (Done et al. done (1996), Turner et al. 1997b ). Such class of objects would be readily recognized in the 10–100 keV range of BeppoSAX data (PDS).
4.3 Other nuclear absorption indicators
Various authors have also used other methods to determine the nuclear absorption along our line of sight and, specifically, to distinguish between Compton thin and Compton thick sources. By assuming the unified model correct, the ratio between the hard X–ray luminosity and an isotropic indicator of the intrinsic luminosity should provide indications on the amount of absorption affecting the nuclear X–ray source. The luminosity of the [OIII] line can be considered an isotropic indicator of the nuclear intrinsic luminosity, though caveats discussed in Sect. 2 must be taken into account (in particular the [OIII] luminosity must be corrected for the NLR extinction as deduced from the Balmer decrement). The effect of a high absorbing column density is to lower the LX(2-10keV)/L[OIII] ratio with respec to Sy1s. The reduction is at most by a factor of when N a few times cm-2, and by about two orders of magnitude when Ncm-2.
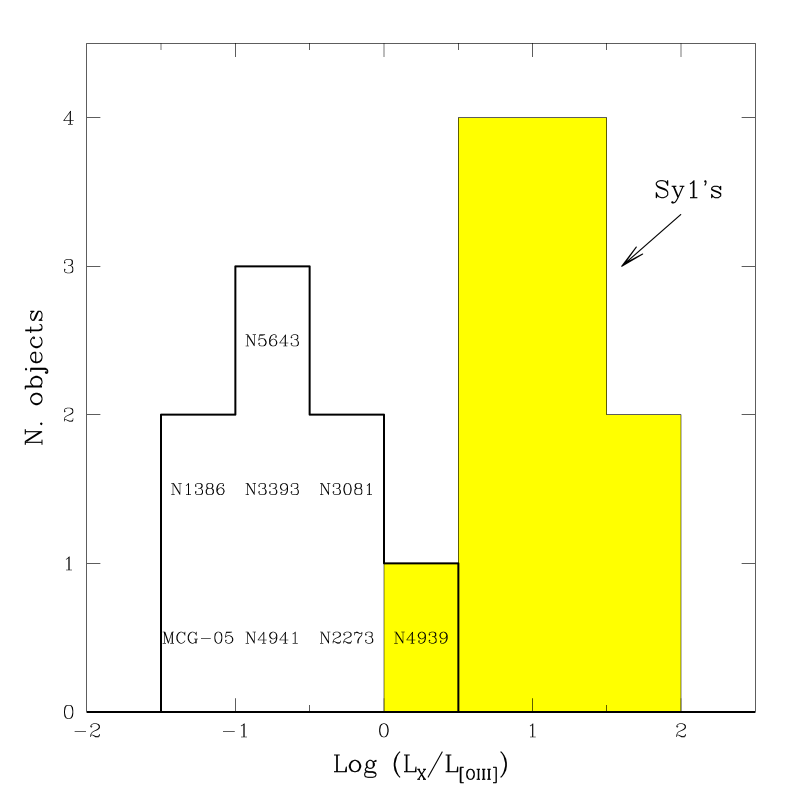
Mulchaey et al. (mulchaey (1994)) and Alonso-Herrero et al. herrero (1997) used the LX(2-10keV)/L[OIII] ratio to identify absorption effects in Sy2s. They do not find significant differences between Sy2s and Sy1s (except for NGC1068). However, their Sy2 sample is seriously biased toward X–ray bright source (see Sect. 1 and Sect. 2), hence little absorbed; also, they do not correct L[OIII] for extinction. Turner et al. (1997b ) adopt this method on a better selected sample (by including weaker sources with respect to the Mulchaey et al. sample). As a result, they identify some Sy2s that are suspected to be reflection dominated, based on a LX(2-10keV)/L[OIII] much lower than observed in Sy1s. We will use the LX(2-10keV)/L[OIII] ratio (where L[OIII] is corrected for extinction in the narrow line region) as an aid to identify heavily absorbed sources. The distribution of LX(2-10keV)/L[OIII] for the sources in our sample, compared to a sample of Sy1s, is shown in Fig.3 ([OIII] data are from Dadina et al. dadina (1998)). A more thorough analysis of the LX(2-10keV)/L[OIII] ratio for a large sample of Sy2s, including the ones presented in this paper, is discussed in Bassani et al. (in prep.).
Mulchaey mulchaey (1994), Mas-Hesse et al. mas_hesse (1995) and Awaki (awaki2 (1991)) use also the Far–IR (FIR) emission (as deduced from the 60 and 100 IRAS data) as isotropic indicator of the intrinsic nuclear luminosity, hence the LX(2-10keV)/LFIR as indicator of nuclear absorption. However, in these low luminosity AGNs the FIR luminosity is often dominated by star formation in the host galaxy (Maiolino et al. maiolino_b (1995)). Therefore, we do not consider the FIR emission a reliable indicator of the AGN luminosity.
Rapid variability (on scales of a few 10 ksec) of the X–ray continuum is indicative that the observed radiation is primary emission seen directly and not reprocessed by pc–scale reflecting media, i.e. that the source is Compton thin. Unfortunately, as discussed in Sect. 3, our data do not provide good constraints on the short term variability. Yet, the lack of significant long term variability (i.e. on a time scale of a few years) is in favor of a reprocessed origin of the observed emission.

[
]Spectral fits
Cold reflection dominated models (Compton thick,
N1025cm-2)a
Source
kT
Fe Line
F0.5-2keV
F2-10keV
F20-100keV
/d.o.f.
Energyb
Normaliz.
EW
(keV)
(keV)
(10-5ph/cm2/s)
(keV)
(10-13erg/cm2/s)
*NGC 1386
0.36
2.87
2.40
–
33.2/38
*NGC 2273
0.58
–
9.93
–
30.7/39
*NGC 3393
0.30
–
3.9
54
20.1/19
*NGC 4939
0.14
3.92
14.2
234
83.0/94
NGC 4941
0.19
6.4c
1.20
1.35
2.3
6.23
–
34.3/47
6.96a
0.89
1.35
NGC 5643
0.73
6.46
1.75
1.41
2.32
13.5
–
35.6/31
Warm scattering dominated models (Compton thick,
N1025cm-2)a
Source
kT
Fe Line
F0.5-2keV
F2-10keV
F20-100keV
/d.o.f.
Energyb
Normaliz.
EW
(keV)
(keV)
(10-5ph/cm2/s)
(keV)
(10-13erg/cm2/s)
NGC 1386
0.35
3.15
2.18
–
35.3/38
NGC 2273
–
–
9.54
–
36.2/41
NGC 3393
0.22
–
3.12
2.6
24.7/19
NGC 4941
–
1.75
5.42
–
39.6/47
*NGC 5643
–
4.48
11.2
–
32.4/33
Transmission models (Compton thin)
Source
kT
NH
Fe Line
F0.5-2keV
F2-10keV
F20-100keV
/d.o.f.
Energyb
Normaliz.
EW
(EWcorr)
(keV)
(1023cm-2)
(keV)
(10-5ph/cm2/s)
(keV)
(10-13erg/cm2/s)
NGC 1386
0.37
2.60
2.60
–
33.12/37
*NGC 3081
0.46
1.51
13.3
–
40.8/37
NGC 3393
0.36
–
3.85
12.5
21.2/18
NGC 4939
0.40
2.05
15.0
61.5
123/93
*NGC 4941
0.25
2.08
6.63
–
34.9/46
In these models the photon index of the primary radiation is frozen to
1.7. Bold face entries (also marked with an asterix)
indicate sources for which the model provides
the best fit, both in terms of and in terms of EW(Fe) and
LX/L[OIII] properties (see text). Spectral models that are
inconsistent with the data at a high significance level are not reported.
MCG-05-18-002 was not fitted with any of these models because of the low
signal–to–noise; for this source we only report a simple power law fit
in Table 3. The cold reflection spectrum was modeled with
the XSPEC routine PEXRAV.
Notes:
a In the case of NGC1386 the Compton thick model constrains only N
1024cm-2 (see text);
b rest frame;
c frozen parameter.
4.4 Results on single objects
In this section we describe the results of spectral fits for the objects in our sample. Also, we apply the considerations discussed in the former sections to each single object.
Table 2 shows the parameters of the three fitting models for each of the sources in our sample. Bold face entries (also marked with an asterix) indicate sources for which the corresponding model provides the best fit, according to the considerations discussed below. Instead, spectral fits that are inconsistent with the data at a high significance level are not reported. The second column (kT) indicates the temperature of the black body used to fit the soft excess. As for the Fe line we report line energy, normalization and equivalent width. In the transmission models we also report the EW(Fe) once the underlying continuum is corrected for the absorbing column density N, listed in column 3 (EWcorr): this value provides a lower limit to the absorption corrected EW(Fe), since it does not take into account the absorption affecting the Fe line itself; if this lower limit turns out to be higher than about 500 eV (i.e. significantly higher than the eV observed in Sy1s) this would indicate that the Compton thin model is little plausible on physical grounds. All errors are at the 90% confidence level for one interesting parameter. The last column indicates the /degrees of freedom for the whole fit, i.e. including the low energy data and the black body component. However, when discussing various spectral models in the following sections, we will often refer to differences relative to the high energy (3keV) data alone.
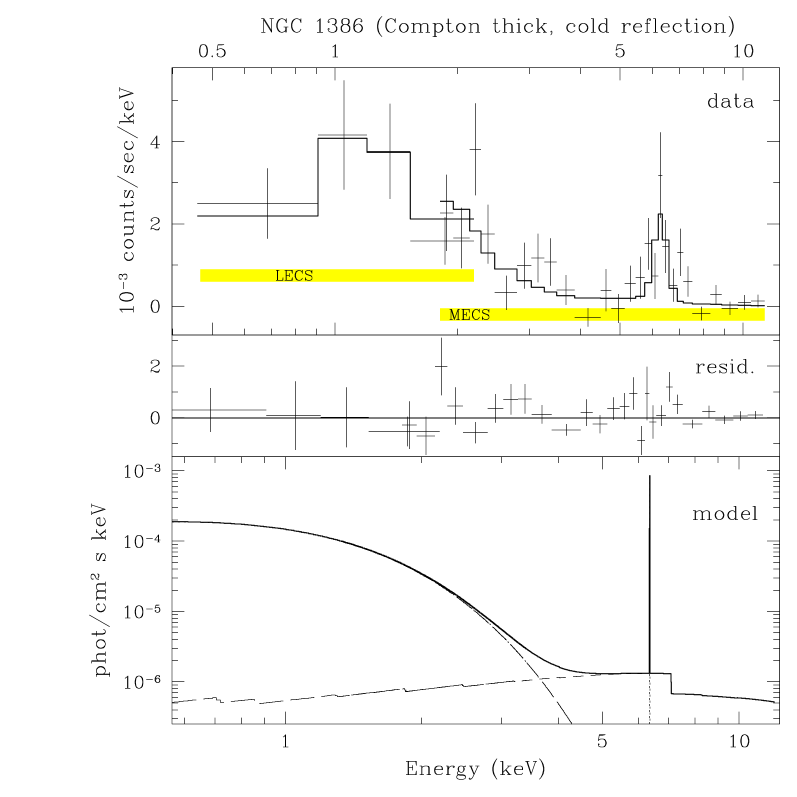
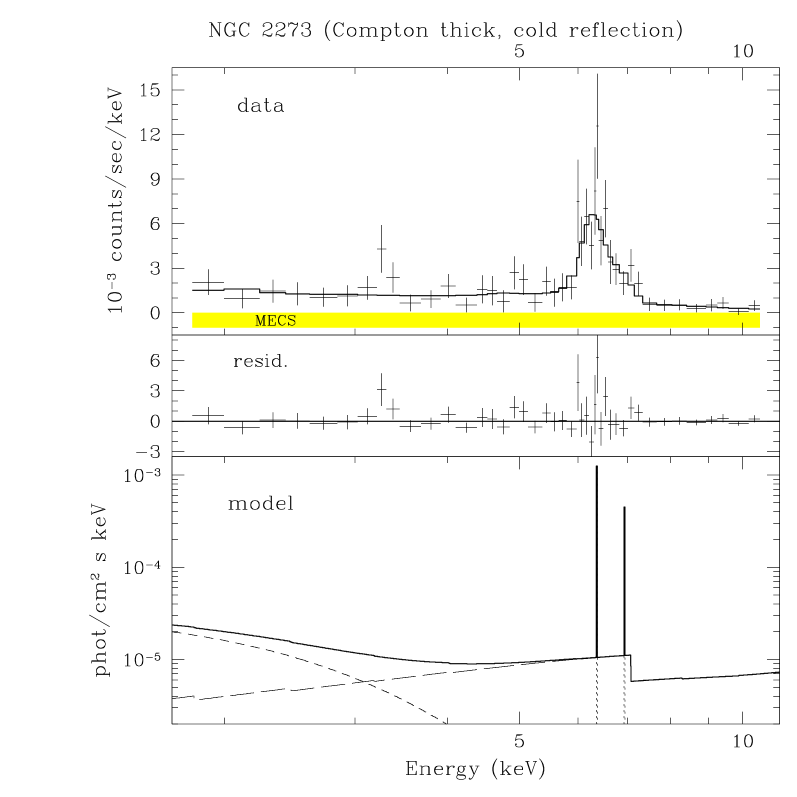
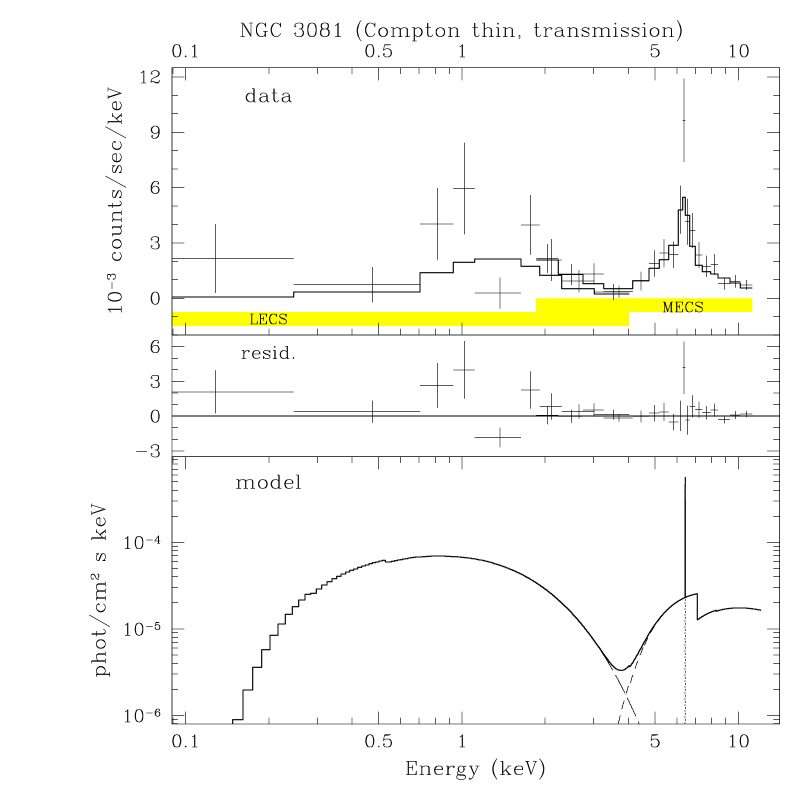
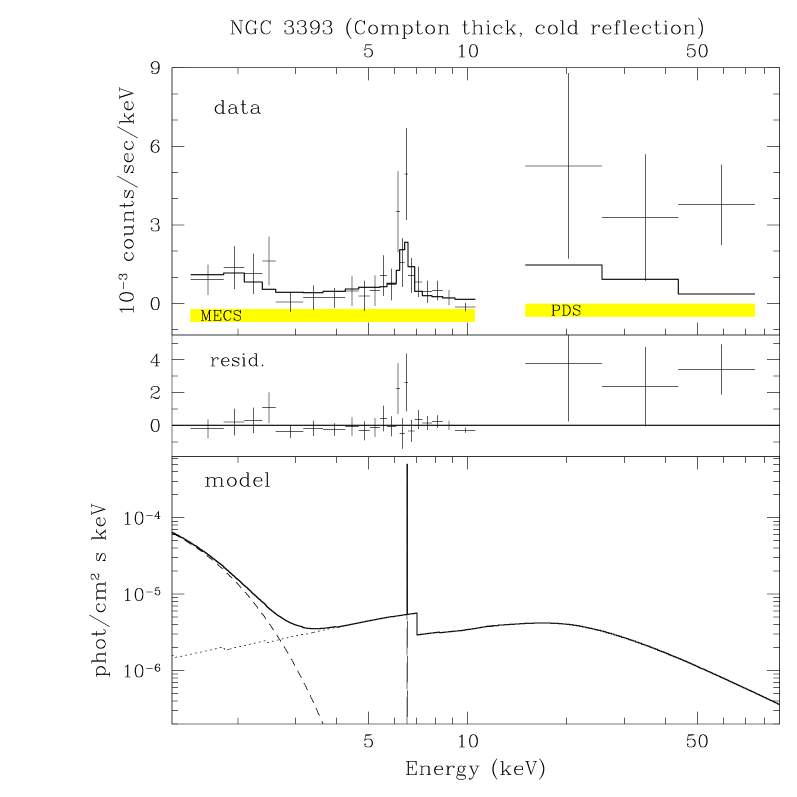
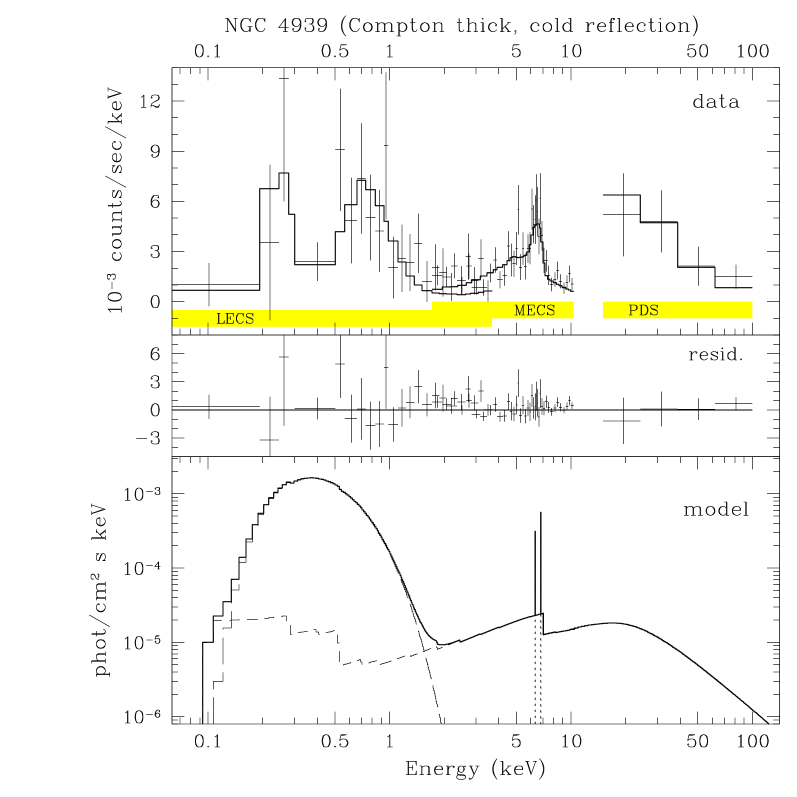
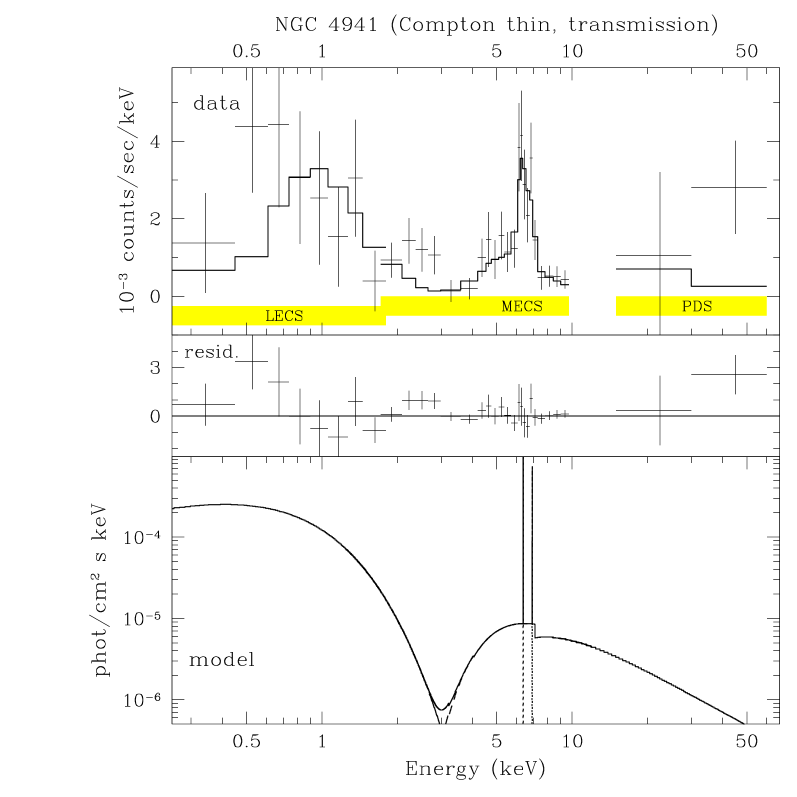
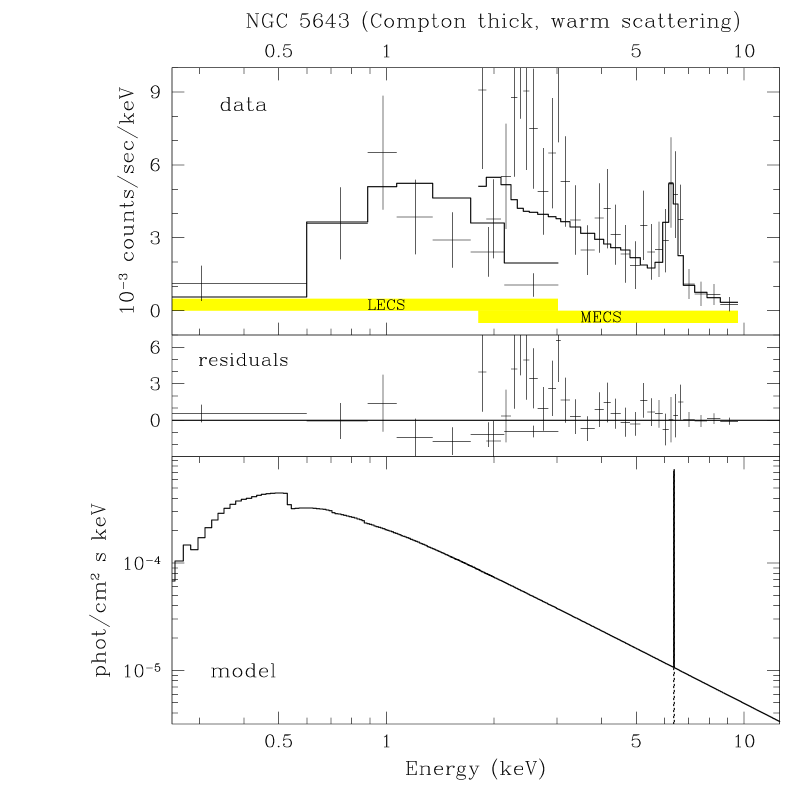
Figures 1 and 2 show the data along with the folded best fit models, the residuals from the model and the unfolded models. Hereafter we discuss each object individually.
4.4.1 NGC 1386
This source was detected also in the 20–100 keV spectral region by the PDS. However, further analysis indicated that most of the flux is due to a nearby Seyfert galaxy (NGC1365) that happens to be located at the edge of the PDS beam. As a consequence, we could not use the PDS data to constrain the X–ray properties of the source.
The MECS spectrum is characterized by a prominent iron line and a very low continuum level. The low continuum makes estimates of the EW(Fe K) very uncertain, since the latter becomes very sensitive to the continuum fit. However, we could set a 90% confidence lower limit of 2 keV to the EW(Fe K), that strongly supports the Compton thick nature of this source.
The Compton, cold reflection model provides the best fit to the high energy ( 3 keV) data. However, from a statistical point of view this model is only marginally better than the warm scattering model: with the same number of degrees of freedom. The main problem is that the low continuum level makes difficult discriminating different continuum shapes.
On the other hand, the Fe K line center is consistent with 6.4 keV, and it is not consistent with 6.7 or 6.96 keV at a high confidence level. There is no evidence for additional components at 6.7 or 6.96 keV. This result provide further support to the cold reflection model with respect to the warm scattering model.
As discussed above, the PDS data cannot be used to constrain the emission in the 20–100 keV range of NGC 1386. As a consequence, in Compton thick models we cannot rule out an absorbing colummn density in the range cm-2 that would provide an excess of emission in the PDS band with respect to the MECS flux. Therefore, in Compton thick models we can only determine a lower limit of cm-2 for the absorbing column density.
In the Compton thin, transmission model the absorbing column density NH is indetermined. A value of N cm-2 provides a fit that statistically is not significantly worse than the cold reflection model. The Compton thin model is ruled out on physical grounds because of the large EW(Fe K). Even the EW computed by correcting the continuum for absorption (EWcorr) has still a 90% lower limit of 600 eV.
The Compton thick model is also supported by the LX/L[OIII] ratio which, as shown in Fig. 3, is about two orders of magnitude lower than in Sy1s.
NGC 1386 has been observed also by ASCA on 1995 January 26, with a similar integration time as our SAX observation. We reduced and analyzed the ASCA data and found that both flux and spectral shape of the ASCA spectrum are consistent with our data within the uncertainties. This indicates that the source does not show evidence for long term variability in excess of about 25% , that is our uncertainty on the flux. This is consistent with the idea that the observed flux is not seen directly, but is reprocessed by a large scale ( 1 pc) medium.
The ASCA data of NGC 1386 were also analyzed by Iyomoto et al. (iyomoto (1997)) who interpret the observed spectrum with a Compton thin transmission model (Ncm-2). As discussed above, statistically the transmission model would fit also our data, but is inconsistent with the large EW(Fe K).
Finally, we estimated the contribution to the soft X rays from the Fornax cluster thermal emission by extracting the spectrum in two regions of the sky located at the same distance from the cluster center, and by using the same aperture size. The contribution from the cluster to the observed soft X–ray flux turns out to be about one third of the total observed in NGC 1386.
4.4.2 NGC 2273
The Compton thick, cold reflection model fits the high energy data better than the warm scattering model at a high confidence level: above 3 keV, with the same number of degrees of freedom. The Compton thin, transmission model indicates N cm-2 and is worse than the cold reflection model only at the 70% confidence level (same with only one degree of freedom less). However, the Compton thick nature of this spectrum is supported by the large EW of the iron line(s). Also, if in the transmission model the photon index is thawed (see Appendix) the best fitting value is , much flatter than expected for the intrinsic spectrum, thus further supporting the Compton thick, cold reflection model.
In Compton thick models the upper limit provided by the PDS in the 20–100 keV range rules out an absorbing column density in the range cm-2, otherwise the observed 20-100 keV flux would be significantly higher than our upper limits. Therefore, if the Compton thick model is valid the column density along our line of sight must be larger than cm-2.
The fit of the iron line improves significantly (99% confidence level) by splitting the line in two components at 6.4 and 6.96 keV. The bump at 3.1 keV observed in the residuals could be interpreted as a line of ArXVII, but by adding a gaussian at this location the fit does not improve significantly.
4.4.3 NGC 3081
The Compton thin, transmission model (N cm-2) fits the high energy data better than the Compton thick models at a high confidence level (the latter ones have reduced ). The absorbing column density is very large, and is responsible for making the observed EW(Fe K) intermediate between typical Compton thin sources and Compton thick ones.
4.4.4 NGC 3393
The MECS data of this source were already presented in Salvati et al. (salvati (1997)), in this paper we include the PDS detection in the 20–100 keV range.
As discussed in Salvati et al. (salvati (1997)), statistically the Compton thick, cold reflection model is only marginally better than the transmission model: the latter (Ncm-2) fits the data with a with respect to the former, at the expense of only one extra degree of freedom. However, the data above 10 keV are reasonably consistent with cold reflection, while the transmission model falls short of accounting for the high energy data. If in the transmission model the photon index is thawed (see Appendix) the best fitting value of is negative, that is certainly not acceptable for the intrinsic spectrum. The EW(Fe K) is large even when the continuum is corrected for the absorbing column deduced by the transmission model. Both findings are in favor of the Compton thick interpretation (with N cm-2). The warm scattering model is ruled out at a confidence level larger than 90% and, in particular, falls short of accouting for the PDS flux.
4.4.5 NGC 4939
The Compton thick, cold reflection model (with Ncm-2, i.e. reflection throughout the PDS range) provides the best fit to the data in the 3–100 keV spectral range. The warm scattering model is ruled out at a high significance level (reduced ); the Compton thin, transmission model (N cm-2) is worse than the cold reflection model at a confidence level larger than 90% (above 3 keV, with only one degree of freedom less); both alternatives are especially bad in the 10–100 keV band, where they fall short of accounting for the observed flux. As in the case of NGC2273, if in the transmission model the photon index is thawed (see Appendix) the best fitting value is 0.7, adding further support to the Compton thick, cold reflection interpretation.
The iron line appears to contain a H–like component at 6.96 keV that is as strong as the neutral-fluorescence line at 6.4 keV. Perhaps a warm scattered component is present at lower energies (i.e. NGC 4939 might be similar to NGC 1068, Matt et al. 1997b ), but the signal–to–noise in our data is not high enough to detect any additional component of the continuum.
We should note that the EW of the 6.4 keV line is only 400 eV and that the LX/L[OIII] only about one order of magnitude lower than the average in Sy1s (Fig. 3). As a consequence, the preference for the cold reflection, Compton thick model over a transmission model with Ncm-2 is still questionable.
4.4.6 NGC 4941
The MECS data of NGC 4941 were also presented in Salvati et al. (salvati (1997)). In this paper we include the LECS data and a marginal PDS detection in the 30–60 keV range. However, the latter datum was not used during the fitting procedure because of its low statistical significance (though it is plotted in Fig. 2). The transmission model (Ncm-2) provides the best fit to the data above 3 keV. The Compton thick warm scattering model is ruled out at a high confidence level, and the Compton thick, cold reflection model is also worse than the transmission model (though at a lower confidence level: above 3 keV with only one degree of freedom less). The EW(Fe6.4keV) is high, but consistent with 300 eV at the 90% level once the effects of absorption are taken into account. Summarizing, although the transmission scenario is preferred, we consider the nature of this spectrum still uncertain.
4.4.7 NGC 5643
This source is close to a cluster of galaxies. To avoid contamination we reduced the extraction radius to 1′. We also checked the level of contamination by extracting the spectrum of two regions located at the same distance from the cluster as NGC5643 and found that the flux from the cluster contributes a negligible fraction of the total flux observed in NGC5643.
A simple power law with , and no excess absorption with respect to the Galactic value (Ncm-2) fits the continuum significantly better than the cold reflection model. Both the absence of an absorption cutoff, in addition to the Galactic one, and the large EW of the iron line strongly support the idea that the source is Compton thick, and warm scattering dominated.
If this were the case, ionized iron lines would be expected. The best fit energy of the gaussian in the rest frame of the galaxy is 6.46, i.e. the iron is less ionized than Fe xxii. These ions can still emit a significant line by fluorescence and resonant scattering; lighter elements are highly ionized so that the scattered spectrum is not dramatically distorted in shape with respect to the incident one.
NGC 5643 has been observed also by ASCA for ksec on 1996 February 21. The 2–10 keV flux observed by ASCA is about 30% lower than that derived from our data, while there is agreement on the EW and the energy of the Fe line. Above 3 keV the slope of the power law in the ASCA spectrum is flatter than that observed in the BeppoSAX spectrum. The difference in flux is puzzling, calibration problems might have occurred. The difference in slope could be ascribed to the low statistics in both spectra (actually an intermediate model could fit them both with a reduced .), but it calls into question our interpretation of the spectrum as warm scattering dominated. However, be it warm scattering or cold reflection dominated, the Compton thick nature of the source is supported by both ASCA and BeppoSAX data.
As discussed previously, the upper limit provided by the PDS requires an absorbing column density higher than cm-2.
4.4.8 MGC-05-18-002
This source was observed after the failure of one of the three MECS units. Both the reduced effective area and the short integration time are responsible for the low signal–to–noise ratio of its spectrum.
In this case we only used a simple power law fit (Table 3). Although a detailed analysis cannot be performed, both the very flat spectrum (Tab. 3) and the very low LX/L[OIII] ratio (two orders of magnitude lower than the average Sy1, as shown in Fig. 3) strongly suggest that this is another Compton thick source, probably cold reflection dominated, and with Ncm-2 because of the lack of detection in the PDS range. Higher signal–to–noise data are required to confirm this interpretation.
5 Discussion
5.1 Probing X–ray weak AGNs
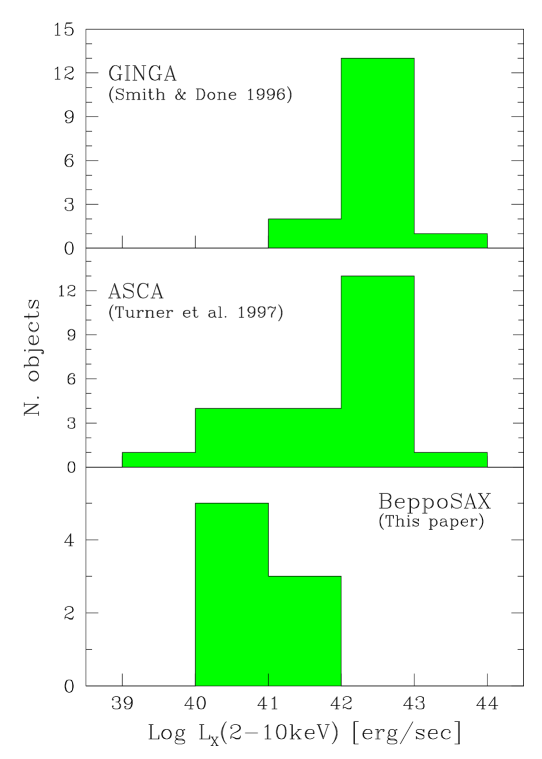
As discussed in Sect. 1 most of the former hard X–ray spectroscopic surveys of Sy2s were seriously biased for X–ray bright sources. This is illustrated in Fig. 4. The observed 2–10 keV luminosity in the Sy2 (and Sy1.9) galaxies surveyed by GINGA, most of which are reported in Smith & Done (smith (1996)), has an average . Turner et al. (1997a ,1997b ) studied lower luminosity Sy2s by using ASCA data: their sample has a mean , but it includes some objects with luminosity lower than erg/sec.
Our sample was not selected according to the X–ray flux. Also, we avoided objects for which hard X–ray spectroscopic data were already available. As a consequence, our survey samples Sy2s with X–ray fluxes significantly lower than in former studies, although at similar distances. Indeed, in our sample .

These X–ray weak AGNs have spectral properties similar to the bright ones: a relatively flat continuum and the presence of the Fe K emission line blend, generally dominated by the neutral component at 6.4 keV. The main difference between the X–ray properties of the sources in our sample and bright AGNs is that the former have observed spectra that are generally flatter (see Appendix) and are characterized by Fe lines with larger EW; as discussed in Sect. 4.4, these differences are very likely due to heavy obscuration along our line of sight for the sources in our sample.
Although these sources are characterized by apparently low luminosities, most of them are Compton thick, i.e. their intrinsic luminosity must be much higher than observed (by perhaps two orders of magnitude). Yet, NGC 4941 is Compton thin and its intrinsic luminosity (obtained by correcting for the estimated NH) is only erg/sec, similar to some LINER nuclei.
It should be noted that about half of the Seyferts in the Maiolino and Rieke’s (maiolino_a (1995)) sample have [OIII] luminosities lower than NGC 4941, and have not been studied in the X rays. Therefore, the hard X–ray spectral properties of the lowest luminosity AGN population have still to be probed.
5.2 The distribution of absorbing column densities
The most remarkable result of our survey is that all the objects are heavily obscured with Ncm-2 and, in particular, 6 out of 8 objects are Compton thick. More specifically NGC2273, NGC3393, NGC4939, NGC5643 and MCG-05-18-002 were identified as Compton thick with Ncm-2, NGC1386 is Compton thick with Ncm-2, while NGC3081 and NGC 4941 were identified as Compton thin with Ncm-2. However, the nature of NGC4939, NGC4941 and MGC-05-18-002 is still questionable.
This result has to be compared with former spectral surveys. Smith & Done (smith (1996)) studied the spectra of a sample of type 2 and 1.9 Seyferts observed with Ginga, that were probably selected amongst bright X–ray sources. The distribution of NH in their sample is shown in Fig. 5. The average absorbing column density is about cm-2. Turner et al. (1997a ,1997b ) analyzed the spectra of a sample of Sy2s from the ASCA archive. The latter sample includes a larger fraction of weak Sy2s with respect to the Ginga survey (see discussion in the former section). As a consequence, it contains a larger fraction of heavily absorbed Sy2s, as shown in Fig. 5. 111In this Figure we consider NGC4945 and Mk3 as having Ncm-2 (Done et al. done (1996), Turner et al. 1997b ), NGC1068 with Ncm-2 (Matt matt_b (1997), Matt et al. 1997b ), Mk463E and NGC6240 with Ncm-2, though the column density absorbing the latter two objects is still matter of debate (a more detailed discussion is given in Bassani et al. in prep.).
Our sample was selected by means of an isotropic indicator of the nuclear luminosity, the dereddened [OIII] flux, and therefore is not biased against obscuration on the pc scale. Thus, it contains a larger portion of heavily obscured Sy2s. In particular, our survey doubles the number of known Compton thick Seyferts: before this study only 6 sources were surely known to be Compton thick, namely NGC 1068, Circinus, NGC4945, NGC 6240, NGC 6552, NGC7674 (the latter identified by means of BeppoSAX as well, Malaguti et al. malaguti (1998)).
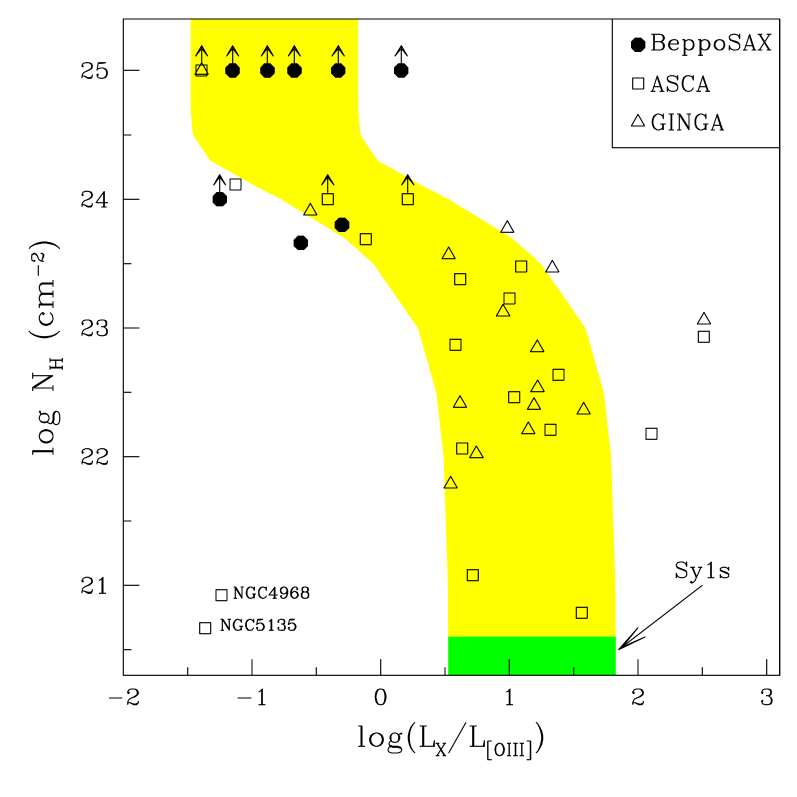
It is interesting to compare the properties of our sources with respect to former surveys also in terms of their location on the NH vs. LX/L[OIII] diagram, as shown in Fig.6222In Fig.6 we have excluded NGC2992, NGC1667 and NGC1808, for long term variability affects the LX/L[OIII] ratio in these objects, as discussed in Bassani et al. (in prep.). The values of L[OIII] are taken from Dadina et al. (dadina (1998)).. As expected (see discussion in Sect.4.3), NH correlates with the LX/L[OIII] ratio. The shaded region indicates the expected correlation by assuming that LX (2–10 keV) is absorbed by the NH reported on the Y-axis, starting from the average LX/L[OIII] ratio observed in Sy1s (the width of the shaded region reflects the dispersion of the LX/L[OIII] distribution in Sy1s) and by assuming a 1% reflected component. The observed distribution is in agreement with what expected from the simple model outlined above, especially if allowance is made for an efficiency of the reflected component different from what assumed. Two objects, namely NGC4968 and NGC5135, are clearly out of the correlation; however, as discussed in detail in Bassani et al. (in prep.), these two sources are very likely Compton thick with N1024cm-2. All of the Sy2s in our sample (filled circles) lie in the high–NH and low–LX/L[OIII] region of the distribution, while most of the Sy2s in former ASCA (open squares, Turner et al. 1997a ) and GINGA (open triangles, Smith & Done smith (1996)) surveys are in the low–NH and high–LX/L[OIII] region.
One of the consequences of our result is that the average absorbing column density in Sy2s turns out to be higher than what was estimated in the past. However, the NH distribution in our sample alone does not necessary reflect the real distribution. Indeed, our sample is not biased against heavily absorbed nuclei, but is probably biased against little absorbed Sy2s, since we avoided Sy2s already observed in previous surveys (i.e. generally X–ray bright sources). The issue of the real distribution of NH is tackled in Bassani et al. (in prep.), where the spectra of several Sy2s (including the ones in this paper) are collected and analyzed.
5.3 Warm scattering versus cold reflection
In Compton thick Seyferts the nuclear continuum can be observed only when scattered by a warm, highly ionized mirror, or Compton reflected by a cold neutral medium (possibly the molecular torus). Since our survey has significantly enlarged the number of known Compton thick Sy2s, it is now possible to statistically assess the relative importance of the cold versus warm scattering in this class of objects.
By merging our sample with Compton thick sources previously reported in the literature, we found that most of the Compton thick Seyferts are cold reflection dominated. More specifically, out of 12 Compton thick Seyferts 7 are cold reflection dominated (namely NGC 1386, NGC 2273, NGC 3393, NGC 4939, Circinus, NGC 6552, NGC 7674), in 3 sources warm scattered and Compton reflected components contribute to a similar extent (namely NGC 1068, NGC 6240, and NGC4945), and only one source (NGC 5643, though to be confirmed) appears to be warm scattering dominated; the nature of the scatterer in MGC-05-18-002 is still uncertain.
The apparent overabundance of cold reflection dominated Compton thick sources must probably be ascribed to the low efficiency of the free electron scattering process. Indeed, in the latter case the fraction of scattered light is given by
| (1) |
where is the free electron column density and is the solid angle subtended by the warm mirror. The average opening angle of the light cones in Sy2s is (Maiolino & Rieke maiolino_a (1995)). If we assume that the warm mirror in Sy2s is the analogous of the warm absorber observed in Sy1s, then cm-2 (Reynolds reynolds (1997)). According to Eq. 1 this implies that the scattering efficiency of the warm mirror is only , i.e. significantly lower than the typical efficiencies observed in Compton thick sources. The Compton cold reflection efficiency can be as high as 16% in the 2–10 keV range, though geometry dependent absorption effects (e.g. torus self shielding) can lower this value to a few percent.
Those (few) Compton thick objects whose spectrum shows evidence for a warm scattered component could either be characterized by an anomalously high column density of the warm mirror, or the Compton reflected component could be significantly absorbed along our line of sight; the latter case might occur if the putative torus is edge–on.
5.4 The soft excess
Most of the objects in our sample show an emission below keV in excess of the extrapolation of the high energy spectrum. Such soft X–ray excesses are commonly observed in type 2 Seyferts and have been studied by several authors. This component is usually not observed in type 1 Seyferts, presumably because the low absorption affecting them makes their flat power law component overwhelming. The nature of the soft excess in type 2 Seyferts is not clear yet. There are two possible origins: 1) thermal emission from hot gas in the Narrow Line Region, or 2) emission associated to starburst activity in the host galaxy (X–ray binaries, supernova remnants, starburst driven superwinds). The possibility that the observed soft excess is due to the primary AGN radiation scattered by a warm medium is not favored based on energy budget arguments (Wilson & Elvis wilson (1997)).
Our data are not well suited to study the emission below 3 keV, since at low energies other satellites (ROSAT, ASCA) are much more sensitive. However, the wide spectral coverage of our BeppoSAX data enables us to determine what fraction of the soft X–ray emission is contributed by the flat AGN component extrapolated to low energies, and what fraction, instead, is actually due to an extra component. In other words, by means of our fits in Sect. 4.4 we can derive the flux of the black body component alone.
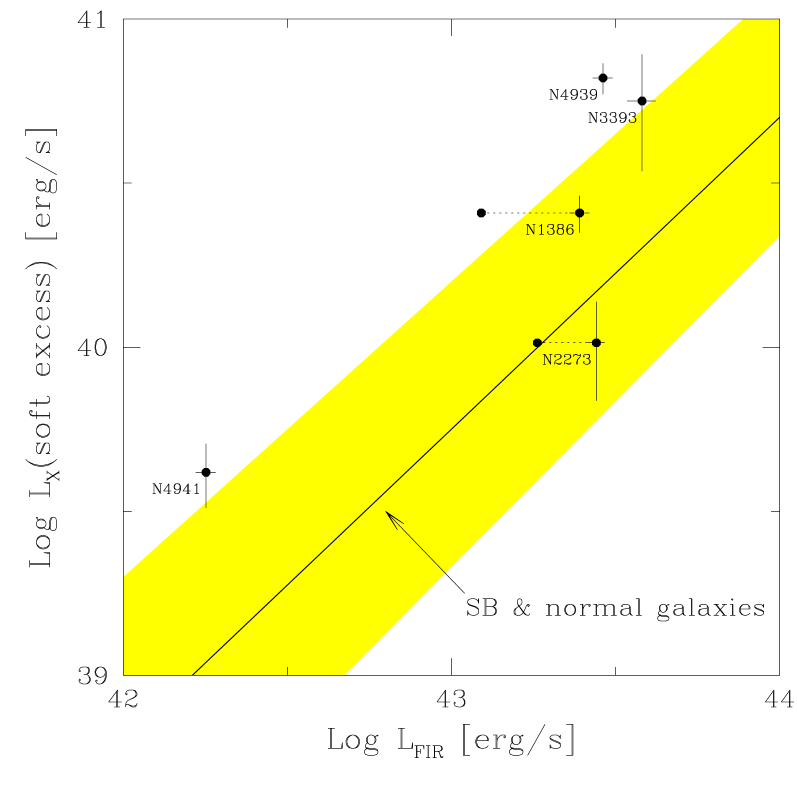
In these low luminosity Seyfert nuclei most of the Far–IR luminosity can be ascribed to star formation in the host galaxy (star forming activity is much more effective than the AGN in powering the FIR emission). So, the FIR luminosity can be used to estimate the level of star formation, and to determine the contribution of the latter to the observed soft excess. David et al. (david (1992)) derived an empirical relationship between L0.5-4.5keV and LFIR in starburst and normal galaxies. This relation is shown in Fig. 7 by means of a thick solid line, while the shaded region indicates the 90% confidence area. The same Figure shows the location of the objects in our sample (NGC3081 and MGC-05-18-002 do not have available IRAS data, while NGC5643 does not show evidence of a soft X–ray excess). NGC 2273 seems to follow the relation for SB and normal galaxies, thus in this object most of the excess can be completely ascribed to the starburst. Most of the other objects show indications of 0.5–4.5 keV emission in excess of what would be expected from the starburst activity alone, although NGC3393, NGC 1386 and NGC4941 are also consistent with the upper limit of the SB/normal galaxies’ distribution, when allowance is made for uncertainties. NGC4939 (which also has the highest signal–to–noise spectrum) is the object for which is strongest the evidence for an extra contribution to the observed soft X–ray excess, i.e. emission related to the AGN.
We should mention that, although weak, these Seyfert nuclei might contribute some of the FIR luminosity. In the latter case the observed FIR luminosity provides an upper limit to the contribution from the starburst. Maiolino et al. (maiolino_b (1995)) addressed the issue of the relative importance of the IR emission from AGNs and from star forming activity in their host galaxies. Two of the objects in our sample, namely NGC 2273 and NGC 1386, were also studied in Maiolino et al. (maiolino_b (1995)). By using their results we could provide lower limits for the starburst contribution to the FIR luminosity in these two objects; they are indicated by points connected by dotted lines in Fig. 7. In the case of NGC 2273 the lower limit indicates that the soft X–ray excess is fully consistent with it being originated by the starburst activity. In the case of NGC 1386 it provides further support to the idea that a fraction of the soft excess comes from the AGN (NLR) component.
6 Conclusions
We presented X–ray observations in the 0.1–100 keV spectral band of 8 Seyfert 2 galaxies. The sources were selected from the Maiolino & Rieke (maiolino_a (1995)) Seyfert sample (limited in B magnitude of the host galaxy) according to their [OIII] flux, that should deliver a sample not biased against heavily absorbed nuclei on the pc scale. Also, we avoided sources already observed in former hard X–ray surveys, generally X–ray bright. As a result, most of the sources in our sample are relatively X–ray weak.
We detected all of our targets in the 2–10 keV range, and two of them also in the 20–100 keV range. Most of these X–ray weak AGNs are characterized by prominent iron lines (at 6.4–7 keV) and flat observed continua, indicating that they are powered by the same kind of engine that powers X–ray bright AGNs. However, these X–ray weak AGNs are characterized by larger EW(Fe K) and flatter observed continua.
All of these sources are absorbed by column densities larger than cm-2 along our line of sight. Most of them appear to be thick to Compton scattering with N cm-2. In the latter cases the observed continuum can generally be ascribed to Compton reflection by cold material.
These findings support the unified model, and point to an average absorbing column density in Sy2s that is much higher than presumed on the basis of previous X–ray surveys. The latter result has important implications for the synthesis of the X–ray background.
Finally, in some of these sources there is indication that the soft X–ray excess cannot be fully ascribed to starburst activity in the host galaxy, and a significant fraction of it is probably related to the active nucleus itself.
Acknowledgements.
We thank the referees I. Lehmann and G. Hasinger for helpful comments. This research made use of SAXDAS linearized and cleaned event files produced at the BeppoSAX Science Data Center. This work was partially supported by the Italian National Research Council (CNR) and by the Italian Space Agency (ASI). In particular MS, RM, and GR acknowledge the partial financial support from ASI through grant ARS–96–66, while GZ acknowledges financial support from ASI through grants 95–RS–152 and ARS–96–70.| Source | NH | Fe Line | F2-10keV | /d.o.f. | |||
| Energyb | Normaliz. | EW | |||||
| (1023cm-2) | (keV) | (10-5ph/cm2/s) | (keV) | (10-13erg/cm2/s) | |||
| NGC 2273 | 9.49 | 34.2/38 | |||||
| NGC 3081 | 13.2 | 40.7/38 | |||||
| NGC 3393 | 3.83 | 15.2/19 | |||||
| NGC 4939 | 15.3 | 85.4/92 | |||||
| NGC 5643 | 13.3 | 30.8/32 | |||||
| MCG-05-18-002 | – | – | – | – | 7.7 | 12.9/9 | |
Notes:
-
a frozen parameter;
-
b rest frame.
Appendix A Spectral fit models with a thawed photon index
In Sect. 4.4 we froze the photon index to 1.7 to reduce the number of free parameters; this was required by the low statistics of the continuum data points in most of the spectra. However, many authors often fit hard X–ray data with transmission models whose photon index is left free. To allow for a fair comparison of our data with these studies, here we report the results obtained by fitting such transmission models to our data (Table 3). The only exceptions are NGC1386 and NGC 4941, whose NH and turn out to be completely indetermined once is thawed.
It is worth noting that most of the sources are characterized by a very flat photon index (); this result supports our interpretation that the sources are Compton thick, dominated by a cold reflection component. The only exceptions are NGC3081, that we indeed identified as Compton thin, and NGC5643, that is thought to be Compton thick, warm scattering dominated.
References
- (1) Alonso-Herrero A., Ward M.J., Kotilainen J.K., 1997, MNRAS 288, 977
- (2) Antonucci R.R.J, 1993, ARA&A 31, 473
- (3) Awaki H., 1997, In: Peterson B.M., Cheng F.,-Z., and Wilson A.S. (eds.), ASP Conference Series, 113, Emissionl ine in Active Galaxies, p. 44
- (4) Awaki H., Koyama K., Inoue H., Halpern J.P., 1991, PASJ 32 195
- (5) Boella G., Butler R.C., Perola G.C., Piro L., Scarsi L., and Bleeker J., 1997a, A&AS 122, 299
- (6) Boella G., Chiappetti L., Conte G., et al., 1997b A&AS 122, 327
- (7) Comastri A., Setti G., Zamorani G., Hasinger G., 1995, A&A 296, 1
- (8) Dadina M., Bassani L., Maiolino R., Risaliti G., Della Ceca R., Matt G., 1998, ApJS, submitt.
- (9) David L.P., Jones C., Forman W., 1992, ApJ 388, 82
- (10) Done C., Madejski G.M., Smith D.A., 1996, ApJ 463, L63
- (11) Fabian A.C., Rees M.J., Stella L., White N.E., 1989, MNRAS 238, 729
- (12) Frontera F., Costa E., Dal Fiume D., et al., 1997, A&AS 122, 357
- (13) Ghisellini G., Haardt F., Matt G., 1994, MNRAS 267, 743
- (14) Heisler C.A., Lumsden S.L., Bailey J.A., 1997, Nat 385, 700
- (15) Iyomoto N., Makishima K., Fukazawa Y., Tashiro M., Ishisaki Y., 1997, PASJ 49, 425
- (16) Lightman A.P., White T.R., 1988, ApJ 335, 57
- (17) Madau P., Ghisellini G., Fabian A.C., 1995, ApJ 410, L7
- (18) Maiolino R., Rieke G.H., 1995, ApJ 495, 95
- (19) Maiolino R., Ruiz M., Rieke G.H., Keller L.D., 1995, ApJ 446, 561
- (20) Malaguti G., Palumbo G.G.C., Cappi M., et al. 1998, A&A 331, 519
- (21) Manzo G., Giarusso S., Santangelo A., et al., 1997, A&AS, 122 341
- (22) Mas-Hesse J.M., Rodriguez-pascual P.M., Sanz Fernandez de Cordoba L., et al., 1995, A&A 298, 22
- (23) Matt G., 1997, In: Comastri A., Venturi T., Bellazzini M. (eds.), From micro to mega parsec, Mem. SAIt. Vol.68 N.1, 127
- (24) Matt G., Brandt W.N., Fabian A.C., 1996, MNRAS 280, 823
- (25) Matt G., Fabian A.C., Reynolds C.S., 1997a, MNRAS 289, 175
- (26) Matt G., Guainazzi M., Frontera F., et al., 1997b, A&A 325, L13
- (27) Mulchaey J.S., Koratkar A., Ward M., et al. 1994, ApJ 436, 586
- (28) Nandra K., Pounds K.A., 1994, MNRAS 268, 405
- (29) Nandra K., George I.M., Mushotzky R.F., Turner T.J., Yaqoob T., 1997, ApJ 476, 70
- (30) Parmar A.N., Martin D.D.E., Bavdaz M., et al., 1997, A&AS 122, 309
- (31) Reynolds C.S., 1997, MNRAS 286, 513
- (32) Salvati M., Bassani L., Della Ceca R., et al., 1997, A&A 323, L1
- (33) Salvati M., Bassani L., Dadina M., et al., 1998, In: the active X–ray sky: results from BeppoSAX and Rossi-XTE. Mem. SAIt. in press
- (34) Sandage A., Tammann G.A., 1987, “A revised Shapley-Ames catalog of bright galaxies”, Carnegie Institution of Washington Publication, Washington D.C.
- (35) Smith D.A., Done C., 1996, MNRAS 280, 355
- (36) Turner T.J., George I.M., Nandra K., Mushotzky R.F., 1997a, ApJS 113, 23
- (37) Turner T.J., George I.M., Nandra K., Mushotzky R.F., 1997b, ApJ 488, 164
- (38) Ueno S., Mushotzky R.F., Koyama K., Iwasawa K., Awaki H., Hayashi I., 1994, PASJ 46, L71
- (39) Ueno S., Koyama K., Awaki H., 1996. In: Zimmermann H.U., Trümper J., Yorke H. (eds.) MPE Publication Series, Röntgenstrahlung from the Universe, p.517
- (40) Wilson A.S., Elvis M., 1997, Ap&SS 248, 141