An Ultraviolet-Selected Galaxy Redshift Survey: New Estimates of the Local Star Formation Rate
Abstract
We present the first results of an ongoing spectroscopic survey of galaxies selected in the rest-frame ultraviolet (UV). The source catalogue has been constructed from a flux-limited sample of stars, galaxies and QSOs imaged at 2000 Å in Selected Area 57 with the FOCA balloon-borne imaging camera (Milliard et al. 1992). Accurate positions for the UV sources have been obtained by matching with optical counterparts using APM scans of the Palomar Sky Survey limited at =20.5. Here we present results derived from optical spectroscopy conducted with the WIYN and WHT telescopes for 142 faint sources. The redshift distribution for this UV-selected sample extends over and a high fraction of the sources show intense nebular emission lines and UV-optical colours bluer than normal Hubble sequence galaxies. Such UV-selected surveys are thus a very efficient way to locate and study intermediate redshift galaxies undergoing intense star formation. Although our sample is currently small, we derive a rest-frame UV luminosity function with a steep faint end slope consistent with that found for late-type galaxies in optical samples. However, the integrated luminosity density derived implies a volume-averaged star formation rate higher than other recent estimates, assuming a normal initial mass function. If representative of other UV fields, as suggested by UV number count studies, our data implies the local abundance of star-forming galaxies may have been underestimated and consequently claims for strong evolution in the global star formation rate in the range 01 overstated. An intensive study of a large UV-selected sample is likely to reveal important information on the declining population of star-forming galaxies of all types.
keywords:
cosmology: observations - galaxies: galaxies - evolution, spectroscopy1 Introduction
The ultraviolet (UV) spectral region remains one of the last astronomical windows to be systematically explored, particularly for normal galaxies at low and intermediate redshift. Since the pioneering work of Pence (1976) and Coleman, Wu and Weedman (1980), good progress has been made in deriving the UV spectral energy distribution of bright galaxies via the International Ultraviolet Explorer (IUE, Ellis et al. 1982, King & Ellis 1985, Burstein et al. 1988, Kinney et al. 1993, 1996; Schmitt et al. 1997) and the Hopkins Ultraviolet Telescope (HUT, Brown et al. 1997). However, in these studies, only optically-selected sources have been chosen for UV follow-up. There remains no systematic census of the local universe conducted in the UV. Paradoxically, more is known about the UV properties of distant galaxies through the study of very faint, redshifted sources. Indeed, in interpreting distant sources, considerable reliance is placed on our scant knowledge of the UV properties of nearby galaxies.
The need for a comprehensive survey of the UV universe has become more acute as a result of recent progress made towards constraining the star formation history of normal field galaxies (see Madau et al. 1996, Madau 1997). The rapid increase in the rest-frame blue luminosity density to redshifts 1 (Lilly et al. 1995, Ellis et al. 1996) contrasts with the modest density of star-forming systems selected using Lyman-limit techniques at 2.3 (Steidel et al. 1996, Cowie & Hu 1998). It is tempting to connect these results and infer a low mean redshift of star formation consistent with QSO absorber estimates of gas depletion and chemical enrichment rates (Fall et al. 1996) and theories based on dark matter halos which merge hierarchically (Kauffmann et al. 1994, Cole et al 1995, Baugh et al. 1997).
Although the latter result seems appealing, it remains unclear whether the various star formation rates (SFR) that have been used to construct this empirical result are being inferred consistently. The different diagnostics include nebular emission lines (Gallego et al. 1995, Tresse & Maddox 1997) and the near UV continuum flux (Lilly et al. 1995, Ellis et al. 1996, Steidel et al. 1996). In most cases, these estimates are based on only the bright portion of the relevant luminosity function (LF), or on samples short of those ideally suited to the task. Moreover, the vexing question of dust extinction remains unclear, particularly at high redshift where there is conflicting evidence on the corrections necessary (Pettini et al 1997, Meurer et al. 1997). Preliminary observations by the ISO satellite (Rowan-Robinson et al. 1997) and by sub-mm detectors (Smail et al. 1997) suggest significant corrections may also be necessary to account for obscured sources.
The existing and forthcoming data from various sources could be better interpreted if there was a greater overlap between the low/moderate and high SF diagnostics. Of particular importance is the very dramatic evolution in the observed luminosity density, , for the redshift interval 01 — — which corresponds to an order of magnitude decline in the volume-average SFR (Lilly et al 1996). To understand the physical significance of such a rapid fading in the UV light of the Universe requires independent and more sensitive data at moderate redshift.
This paper presents the first results from an ongoing deep UV-selected galaxy redshift survey designed to span the redshift range 00.5. The overall aim is to provide an independent measure of the declining SFR and a robust estimate of the present star formation density. The selection of galaxies in the far UV (at 2000 Å) leads to a much greater sensitivity to the instantaneous star formation than is the case with optically-selected samples. Moreover, the greater sensitivity to extinction at short wavelengths is advantagous in constraining the possible effects of dust in the star-forming population.
Progress on these questions has been hindered by the absence of any wide-field facility with which to conduct deep UV field surveys. Neither IUE, HUT nor the Hubble Space Telescope (HST) can be efficiently used in a survey mode. However, using the FOCA balloon-borne camera, Milliard et al. (1992) have constructed the first deep galaxy survey at 2000 Å. The availability of the FOCA dataset has encouraged us to conduct a systematic UV-selected galaxy redshift survey to address the above questions. We begin here with a concerted attack on the field Selected Area 57 which contains some of the deepest and most complete FOCA photomotric data.
A plan of the paper follows. In 2 we discuss the construction of the photometric and astrometric database and the spectroscopic exposures and associated data reduction which lead to a redshift catalogue. In 3 we discuss the UV-optical colour distributions and compare these with expectations based on the optical -corrections in current use. In 4 we construct the rest-frame UV luminosity function and use it to provide an estimate of the volume averaged star-formation rate over the redshift interval 00.5. In 5, we summarise our principal conclusions.
2 The Data
Our redshift survey is based on images taken and analysed by the FOCA balloon-borne wide-field UV camera. Further details of the instrument can be found in Milliard et al. (1992). Briefly, the experiment consists of a 40-cm Cassegrain telescope equipped with an image intensifier coupled to a IIaO photographic emulsion. The telescope is flown on a stratospheric gondola stabilised to within a radius of 2 arcsec rms. The impressive feature of the experiment is the field of view (2.3∘ in its f/2.56 wide-field mode) which, together with the depth attained in 3000 sec exposures, makes it ideal for this programme. Photometric selection via the FOCA 2000 filter whose spectral response approximates a Gaussian centred at 2015 Å with a FWHM of 188 Å . The 2000 Å galaxy count slope based on data taken in 4 fields is surprisingly steep suggesting either recent evolution for some fraction of the population (Armand & Milliard 1994) or a significant error in the mean -correction in current use. One of the most intriguing features of this unique dataset is the high fraction of UV-selected galaxies that are much bluer in UV-optical than can be accounted via normal Hubble sequence galaxies (Donas et al. 1995).
The most suitable field for study from Milliard et al’s series of 4 exposures was considered to be Selected Area 57 (SA57). This field, centred at RA=13 03 52.61 Dec=+29 20 30.07 (1950.0), has been studied with both the FOCA 1000 (f/2.56, 2.3∘) and FOCA 1500 (f/3.85, 1.55∘) modes ensuring the deepest, most reliable and widest-field (2.3∘) catalogue. The limiting magnitude is =18.5 which corresponds to for late-type galaxies. The present results are derived from multi-fibre spectroscopic exposures for SA57 taken in March 1996 with the Hydra instrument on the 3.5m WIYN telescope111The WIYN Observatory is a joint facility of the University of Wisconsin-Madison, Indiana University, Yale University, and the National Optical Astronomy Observatories. and, later, in April 1997 with the WYFFOS facility on the 4.2m William Herschel Telescope.
Both the WIYN and WHT instruments offer 100 fibres over a 1 degree diameter field, and since the surface density of galaxies at =18.5 is 200 deg-2, there is no shortage of sources for study. However, the imaging resolution of the UV data is only 10/20 arcsec FWHM depending, respectively, on whether the FOCA 1500/1000 catalogues are used. The astrometric precision is therefore typically 3-4.5 arcsec rms and insufficient for defining a spectroscopic target list. Furthermore, the UV data cannot, on its own, be used to discriminate between stars and galaxies. Accordingly, to overcome these limitations, we have matched the FOCA catalogues for SA57 with Automated Plate Measuring (APM) machine scans of the Palomar Observatory Sky Survey (POSS) 103a-O and 103a-E plates.
After eliminating the periphery of the FOCA images where the source detection is less reliable, the FOCA 1500 catalogue consists of 643 sources with 18.5 whereas the FOCA 1000 covers a wider field and contains 805 sources. All sources were matched with APM scans of the Palomar Sky Survey limited at =20.5 using a search radius of 10 arcsec when detected by FOCA 1500 and 20 arcsec when detected by FOCA 1000 only.
Locating the appropriate optical counterpart for each UV source proved occasionally troublesome on two accounts. Firstly, some of the faintest UV detections have no obvious optical counterpart. Only 6% of the FOCA 1000 sources are so affected but the fraction rises to 30% for the deeper FOCA 1500 list. Clearly some fraction of the faintest UV detections are either spurious or their optical magnitudes lie fainter than =20.5. We will return to this point in 3.
The second problem is that, in many cases, more than one optical identification lies within the UV error circle. It is not obvious which is the correct target, or whether the UV flux arises from a combination of more than one source. This is most problematic for the FOCA 1000 catalogue where a search radius of 20 arcsec is necessary. 60% of the FOCA 1000 sources have more than one possible APM counterpart. This fraction reduces to only 9% when using a 10 arcsec search radius. For the FOCA 1500 sources 13% have two APM counterparts and 1% have three counterparts.
In cases of multiple identifications, we selected the optical source closest to the UV position. For the region where the FOCA 1000 and FOCA 1500 images overlap we checked the validity of this approach by matching common sources and obtaining improved positions. We found that selecting the optical ID closest to the FOCA 1000 position was generally quite reliable. In practice the main confusion arising from this problem is therefore the possibility of contamination of the UV signal from more than one source.
Ideally, it would be desirable to spectroscopically study all sources, regardless of whether they appear to be stars or galaxies. For example, there might be a significant population of compact star-forming galaxy lost by applying standard optical star/galaxy separation criteria. In practice, however, for the exploratory survey discussed here, this approach was not considered practical because of the high fraction (30%) of likely stars. Star/galaxy classification was thus attempted both using the APM algorithms and via visual inspection. The final image classifications were merged and disputed cases included as potential galaxies. It should be noted that the possibility of further extragalactic UV sources would only strengthen the principal conclusion of this paper.
The FOCA photometry is discussed in detail by Milliard et al. (1992) and is defined according to a scheme similar, but not exactly equivalent, to the ST system. Following Donas et al (1995), = - 2.5 log ( - 21.175, where is in cgs units. The UV zero point is based on earlier stellar photometry in the range 1013 conducted using the SCAP 2000 experiment (Donas et al. 1987) and is accurate to better than 0.2 mag. Given the low UV background, the principal uncertainty in the relative galaxy photometry arises from possible non-linearities in the photometric system and this is unlikely to dominate the photon statistics. It is estimated that total photometric error of the UV data may reach 0.3-0.5 close to the limit of our survey (Donas et al. 1995). The detected UV background is sufficiently faint that the FOCA magnitudes represent isophotal values at a surface brightness of =27 arcsec-2, i.e. sufficiently close to total for the sources of interest in this paper.
The optical and photographic photometry was taken directly from the POSS database and includes corrections for photographic saturation and isophotal losses (McMahon, personal communication). Given the poor angular resolution of the FOCA data, the UV-optical colours may be subject to a possible systematic offset compared to their idealised (aperture) equivalents. We discuss this question further in 3 when presenting the distribution of UV-optical colours.
To commence the survey, we were allocated queue-scheduled time with the Hydra multi-fibre spectrograph on the 3.5m WYIN telescope. The target list of 71 galaxies (drawn from the FOCA 1000 list with 18.5) and 13 sky fibres was configured using the WHYDRA utility. The WIYN spectroscopic exposures of SA57 were taken on February 28 and 29 1996 in service mode. The multi-fibre spectrograph was used with the Simmons Camera, the blue fibre cable and the Tek 2KC CCD. The 400-line grating was used offering a wavelength range 3500-6600 Å and a spectral resolution of 7 Å. On each night three 1800 s field exposures were taken and these were bracketed with CuAr lamp calibrations. The seeing was 1 arcsec throughout. The spectroscopic data was processed within IRAF using the DOHYDRA package. Dark frames were subtracted and dome flatfielding performed using combined exposures taken on the same night supplied with the service data. The spectral data has not been flux calibrated.
In April 1997, we were allocated queue-scheduled time with the WYFFOS multi-fibre spectrograph at the prime focus of the 4.2m William Herschel Telescope. In this case, the target list was configured for the Autofib2 fibre positioner using the program. Targets were selected from an improved FOCA list determined from the merger of the FOCA 1000 and FOCA 1500 catalogues (as described above) after eliminating those with successful WIYN redshifts. In this case we used a 300-line grating with the Tek6 1K CCD giving a wavelength range of 3500-9000 Å and a spectral resolution of 10 Å. The greater wavelength coverage enabled the location of both [O II] and H emission in many of the spectra. A 41800s spectroscopic exposure was taken and a second exposure was begun with an independent Autofib2 configuration but the latter sequence was curtailed after one hour due to poor weather conditions. The WHT spectroscopic data was processed within IRAF using the package purposely written for WYFFOS. Figure 1 presents a selection of the WHT and WYIN spectra.

Redshifts were measured by visual inspection and [O II] and H equivalent widths determined using the facility within IRAF. From the 3 exposures, reliable spectra were obtained for 142 sources to =18.5. As expected, the incompleteness is unacceptably high in the second, shorter, WHT exposure and so the bulk of the analysis that follows has been conducted using the other two exposures yielding a total of 128 spectra and an identification completeness of 90%. Of the 14 unidentified spectra in these two fields, 6 suffered from technical difficulties in extraction unrelated to the signal/noise. The formal incompleteness within these two fields is thus only 8/122 viz. 6%. Within this complete sample of 122 sources, we found 103 galaxies, 5 broad-line AGN and 6 stars. A further 12 galaxies and 2 stars were identified from the second WHT exposure.
The modest but non-zero contamination of our sample by AGN and stars (8% of the total sample) is a good indication that we have been appropriately over-cautious in our star/galaxy classification procedure. Without any star/galaxy separation the stellar fraction to =18.5 would have been 30% (Milliard et al. 1992). At first it seems perhaps surprising that that such a high fraction of the compact contaminants are AGN. However, our spectroscopic AGN have optical magnitudes and redshifts in the ranges 18.2 20.4 and 0.71.5 respectively and the expected number of UVX QSO’s in this magnitude range is 23 deg2 (Boyle, Shanks & Peterson 1988) i.e. 10% of the UV galaxy density to our limit.
For the remaining galaxies with redshifts, we can further restrict the sample into those for which there is a reliable UV flux from both the FOCA 1000 and 1500 catalogues and an unambiguous optical ID with no confusion. Starting from a maximal sample of 115 galaxies across all 3 exposures (103 if we restrict to the two well-exposed fields), 11 were retrospectively determined to have unreliable UV fluxes and have been discarded from the analysis. 19 galaxies belong to the double counterpart category and 2 are triple counterpart cases. The most secure analysis we can consider is therefore based on what will refer to as the restricted sample of 84 galaxies with measured redshifts (75 in the two well-exposed fields). We will explore the effect of including the multiple counterpart cases in the discussion below. The larger sample of 104 galaxies (115 less 11 sources with poor UV fluxes) across all 3 fields will be referred to as the full spectroscopic sample.
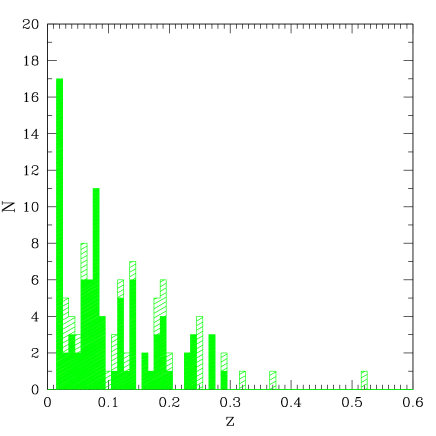
A large fraction of the spectra reveal strong emission lines as expected if the bulk of the UV-selected sources are star-forming galaxies. 46% of the galaxies have [OII]15Å, compared to in optically-selected samples of comparable depth (Peterson et al. 1986, Broadhurst, Ellis & Shanks 1988, Heyl et al. 1997). Figure 2 indicates the overall redshift distribution of the sample where the presence of the Coma supercluster (=0.023) can be seen. Table 1 presents the final spectroscopic catalogue separately for the galaxies and other sources. Multiple counterpart cases are identified via the column labelled ‘OC’.
3 Optical-Ultraviolet Colour Distributions
We now wish to explore the extent to which the UV-optical colour distribution observed for our UV-selected sample is consistent with that expected on the basis of models used in conventional analyses of the optical galaxy data (c.f. review by Ellis 1997). This is equivalent to addressing the question of whether the mean optical -correction in current use are appropriate. Although extensive spectral energy distributions (SEDs) are available for individual galaxies of known Hubble class from optically-selected samples (c.f. Kinney et al. 1996), we have little idea whether the available SEDs span the full range of the UV-emitting population and hence whether the UV-optical colour distribution is correctly inferred using optical data.
In fact, there have already been several indications that some galaxies exist with significantly stronger UV fluxes than would be expected from the normal range of optical SEDs. Armand & Milliard (1994) found that the FOCA counts across several fields have a steeper slope and higher normalisation than popular ‘no evolution’ models would predict. This is surprising considering the modest redshift range probed in our survey. Moreover, Donas et al. (1995) found a significant population of sources in their FOCA image of the Coma cluster with UV excesses of as much as 1-2 magnitudes compared to standard models that account for a range of optical colours. Fioc & Rocca-Volmerange (1997) have postulated a connection between these UV-strong sources and the abundant population of emission line galaxies seen in deep redshift surveys. They suggest that sudden bursts of star formation superimposed on normally-evolving population may be needed to account for the anomalously strong UV flux.
The availability of redshifts for a complete sample of UV-selected galaxies enables further progress to be made on these and related questions. For comparison with our UV-optical colours we will refer to the model SEDs published by Poggianti (1997). These are particularly well-suited to the question at hand because Poggianti selects her model SEDs to match the observed broad-band colour data of galaxies of various Hubble types (in contrast to Kinney et al. (1996) who use empirical aperture spectrophotometry).
UV-optical colours have been predicted for the various Poggianti SEDs as a function of redshift using the appropriate filter functions for the FOCA 2000 Å filter and for the Palomar photographic systems (hereafter and ). In comparing these predictions with our UV-optical colours it is necessary to take account of the fact that the UV photometry is defined on its own, non-standard system (see 2, Donas et al 1995) whereas our optical photometry is based on the normal -Lyrae system. In order to maintain consistency with earlier UV papers, we have chosen to reduce both our model predictions and optical data to the same UV-based system. The correction for the APM -magnitudes (defined in the -Lyrae system) amounts to 0.37 mag in the sense = - 0.37.
The UV colour-redshift distribution for the full spectroscopic sample is shown in Figure 3 together with, suitably corrected, predicted colours from the SEDs of Poggianti (1997). The two bluest predictions (labelled SB) are examples of starburst models kindly supplied by Dr Poggianti specifically for this comparison. Type SB1 (the redder case) assumes a burst of star formation of duration year immediately prior to the epoch of observation involving 30 % of the galactic mass. Type SB2 (the bluer case) assumes a shorter year burst involving 80 % of the galactic mass. The star formation history prior to these bursts is that of a passively evolving system. These models provide a good illustration of the range of UV-optical colours expected for normal initial mass functions.

The most obvious, and puzzling, feature of the distribution is that a significant fraction () of UV sources have colours up to 2 magnitudes bluer than even the strongest starburst SED. This phenomenon is not associated solely with faint sources or those which suffer confusion in their optical identifications. The discrepancy is more striking when it is realised that the model SEDs are unreddened. Comparisons with other SEDs, such as the empirical set produced by Kinney et al. (1996) produce larger discrepancies.
Before interpreting this figure it is appropriate to return to the question of a possible systematic offset between the UV and optical photometric systems. Such an offset would work in the sense of generating galaxies with too much UV flux if, for example, the UV system referred to a deeper isophote than is the case in the optical. Whilst this is undoubtedly a possibility, it is difficult to imagine effects of greater than 0.2-0.3 mag (Metcalfe et al. 1995). Similarly, a zero point offset or scale error in either photometric system would yield an offset, again typically of no more than 0.2 mag (c.f. 2) and, in the case of scale errors, anomalous sources would primarily be at the faint end of the apparent magnitude range in the offending system. The trends we seek to explain have signatures that are much greater than the possible 0.2-0.3 mag uncertainties.
Concerning the accuracy of the optical photometry, it is conceivable that some of the anomalously UV bright sources represent cases where the POSS magnitudes are poorly determined. We consider this to be unlikely given that, to reconcile the colours with normal SEDS, the true optical magnitudes for these sources would have to be 19-20 where the reliability of the POSS photometry is usually fairly good.
Importantly, however, the presence of some UV strong sources with UV- implies that our optical magnitude limit of =20.5 may be inadequately shallow and that this intriguing population of UV-strong sources is underestimated in our survey. This is relevant in further consideration of the 30% of FOCA 1500 catalogue limited at =18.5, which has no optical counterpart. Deeper imaging is required to understand whether a significant proportion of these are genuine sources. Of course this becomes increasingly difficult to use as the surface density of optical sources (and the likelihood of false associations) increases.
Regardless of the true number of sources with anomalous colours to =18.5, we seek a physical explanation for these extreme objects. Three explanations occur to us. Firstly, the model SEDs produced by Poggianti refer to calculations based on time steps of 107 years or greater using normal mass function and solar metallicity. With a similar IMF and metallicity, a 1 Myr old starburst can be somewhat bluer (Leitherer & Heckman 1995). Stronger UV continua can also be produced for a limited duration in intense short-lived bursts with lower metallicity (Charlot 1996). The abundance of UV strong sources (which may be underestimated in the present sample) would then imply a larger population of sources undergoing such activity. Explanations based on abnormal IMFs are obviously possible though impossible to verify without UV spectra.
Secondly, conceivably some fraction of the UV light of these galaxies arises from a non-thermal source. Tresse et al. (1996) has argued that between 8-17% of a sample of 0.3 22 galaxies have emission line ratios consistent with Seyfert2 or LINERs. Although there is no indication of broad emission lines in those UV sources in question, conceivably this is masked by a strong star-forming component as well as by the overall poor signal/noise in the exposures which precludes precise line ratio measurements. Again, only UV spectra could clarify this possibility.
Alternatively, it is conceivable that the UV emission is somehow independent of the optical radiation. A mismatch of apertures seems unlikely for such a high fraction of our sample. It is interesting to note, however, that the correlation between the UV- colour and equivalent widths of the nebular emission lines is not that strong (Figure 4). Although the galaxies with the most intense emission lines are generally stronger in the UV, there is a large amount of scatter. This is probably due to the fact that the equivalent widths are poorly determined in all but the best spectra.

In summary, no single convincing physical explanation can yet be found for these UV-strong sources and, perhaps most importantly, their numbers may be underestimated in the current sample in view of the magnitude limit of the optical data.
The effect of this population on the UV luminosity function (LF) will be discussed in detail in 5 but the mismatch between our expectations based on optically-selected samples and the current results can also be judged by comparing the relative UV- colour distribution for our 18.5 sample with that expected on the basis of the King & Ellis (1985) optical LFs differentiated by spectral class and coupled to -corrections based on the Poggianti SEDs (Figure 5).
Such model predictions are the norm for optical work (Ellis 1997) and can provide good matches to the optical colour distributions of moderately faint samples (Metcalfe et al. 1991). However, as Figure 5 shows, these optically-based predictions cannot account for the full extent of the UV- colour distribution. The model also underestimates the observed number of UV galaxies brighter than 18.5 by a factor which depends on the absolute normalisation of the optical LF (c.f. Ellis 1997) but which is at least 2-3.
It is also interesting to consider whether this discrepancy can be resolved by adopting a steeper faint end slope for the optical luminosity function for late type star forming galaxies as proposed by Marzke & Da Costa (1997) on the basis of their Southern Sky Redshift Survey. Adopting a faint end Schechter slope of =-1.5 for this subset of the population (c.f. -1.0 for the King & Ellis LF), and arbitrarily giving all of these sources the UV- colours of starburst galaxies, it is possible to boost the number density of UV-selected objects by a considerable factor close to the observed level. However, as Figure 5 shows, the colour distribution would then be considerably skewed to blue sources. Even allowing for the possibility that the bluest sources are under-represented, this prediction is incompatible with the observed colours. Regardless of the final solution to this dilemma, it is clear that the optically-based data cannot easily reproduce the UV colour distribution and counts.

One advantage of the slow change in predicted UV- colour with redshift (Figure 3) is that it allows us to reliably use the observed colour to infer a spectral class for each galaxy essential for inferring a UV -correction necessary for deriving the rest-frame UV luminosity function (4). Admittedly, this assumes that reddening is not significant in the interpretation of our colours, a point we return to in 4. In practical terms, we allocated a spectral class according to the scheme (E/S0, Sa, Sb, Scd, SB) using Poggianti’s SEDs. The absolute magnitude then follows using:
| (1) |
where is the luminosity distance at redshift . We assume and in all calculations.
The UV -corrections are quite small () and almost type-independent for the spiral classes which dominate the sample. This is because of the narrowness of the FOCA 2000 Å filter response function and the slowly-changing SEDs in both wavelength regions for galaxies with weak Balmer discontinuities.
4 The UV Luminosity Function and Local Star Formation Density
We now turn to the determination of the rest-frame UV luminosity function (LF). Before doing so we need to issue some important caveats. Firstly, clearly with only a single selected area, the current results must be regarded as preliminary. Secondly, it must be remembered that the LF is strictly that derived for a selection criterion which includes an optical limit of 20.5. A significant proportion of sources with 18.5 have no optical IDs; these will generally be the bluest sources and thus the LF derived may not be truly representative of that for a strict UV-limited sample even when normalised to the total counts. Similarly by eliminating the multiple counterparts we may likewise be biasing the LF against certain classes of sources such as interacting galaxies. We can investigate some of these biases but it is not yet possible to correct for them properly in the analysis.
We adopt the traditional method for the LF derivation (e.g. Felten 1977). The number density of galaxies with magnitude is given by:
| (2) |
where the sum is extended over all galaxies with magnitude , and is the maximum volume in which type galaxies with absolute magnitude are observable, i.e. satisfying in Eq. 1. As is customary for small samples, the normalisation of the LF is adjusted to fit the observed number counts (Milliard et al. 1992) assuming the restricted sample is representative of the entire source distribution. Since the mean counts represent the average of FOCA exposures for several fields, this enables us to minimise uncertainties in normalisation which would otherwise be based on a single field.
As our sample extends over a significant redshift range, prior to deriving a single LF, it is worth considering whether there is an evolutionary trend. Such a trend might be expected from the results of Ellis et al. (1996) where a significant change in the star forming component of the optical LF was detected. An important advantage of the UV selection over that in the optical (and apparent in Figure 3) is that the apparent mixture of spectral classes is unlikely to be significantly different at c.f. =0. Accordingly, a simple distribution can be used to determine whether an unevolving LF is an appropriate representation of the data gathered so far (or conversely, assuming no evolution, whether the sample is statistically representative and complete). The resulting distribution of is shown in Figure 6 for the two substantially complete fields, after subtracting those sources lying in the redshift range of the Coma cluster (). Although the samples are small and the mean values somewhat uncertain, there is clearly no evidence for strong evolution in the distribution. Rather, the mean values for both fields are slightly less than 0.5. The overall mean is 0.420.03, i.e. non-uniform with a marginal significance. This effect appears to arise primarily from the WIYN field where the incompleteness is a bit worse and where the selection was based on the inferior FOCA 1000 photometry.

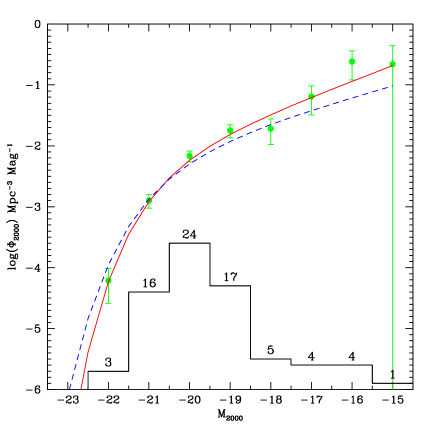
The derived UV luminosity function (assuming kms s-1 Mpc-1) is presented in Figure 7 together with the best fit Schechter (1976) function with the following parameters (errors represent formal statistical uncertainties):
| (3) |
i.e. .
The faint end slope of the UV LF is significantly steeper than that of the overall optical equivalent (-1.1 c.f. Ellis 1997) but comparable to some estimates of that for the star-forming late-type galaxies (Marzke et al. 1994). We tested the robustness of this result by excising low redshift sources with 0.0255 in case additional large scale structure might produce this effect. In this case the slope decreased to 1.52, i.e. within the error bars of the above estimate. Adding the Coma members raises the slope to 1.76 (again within the error bars).
Turning to the normalisation we obtain if we adopt the 18.5 surface density of Milliard et al. (1992). This is shown as the solid line in Figure 7. The dashed line indicates the model UV LF assuming all of the Marzke et al. late type galaxies have UV-optical colours of SB galaxies. Although an adequate representation of the data, as we saw in 3, the colour distribution predicted by such a model is too blue.
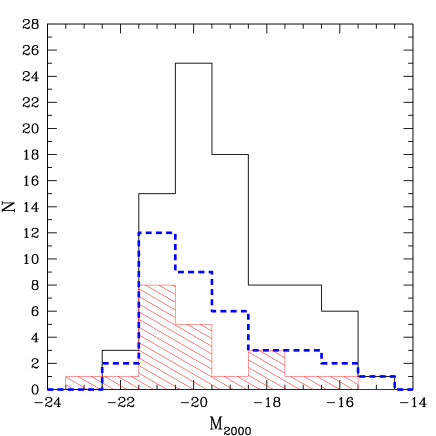
Addressing the question of the effect of an optical pre-selection (20.5) on the UV survey, Figure 8 compares the absolute magnitude distribution of the restricted sample (i.e. UV sources having a unique optical counterpart) with that for the bluest sources (UV- corresponding to Scd and later) and that for the multiple counterpart objects in the full spectroscopic sample. As the relative distributions are similar, this would appear to indicate the main effect of omitting fainter optical sources and multiple counterparts is recovered in the final normalisation, i.e. the shape of the LF will be unaffected.
Integrating the measured luminosity function over the observed range, , yields a ‘resolved’ luminosity density at 2000 Å of:
| (4) |
Integrating the steep LF beyond the measured range increases this estimate by 20 %:
| (5) |
The starburst population, defined again as galaxies with UV- (cf. Figs. 4), contributes 40% of the total light density. These estimates take into account the fact that some proportion of the UV sources were not observed due to a lack of any optical ID brighter than 20.5 provided their distribution in luminosity is no different from those present in the restricted sample (Fig. 8).
As dust may absorb a significant fraction of the UV photons within the galaxies, the observed UV luminosity density clearly represents a lower limit to that emitted. Whereas optically-selected galaxies are only moderately affected by dust, starburst galaxies such as those dominating the present sample may be more obscured. From a sample of local starburst galaxies for which UV to FIR photometric data are available, Buat & Burgarella (1997) have derived a mean extinction of mag at 2000 Å (although with a large dispersion). Likewise, Pettini et al. (1998) estimate similar amounts of dust extinction in high redshift starbursts. Applied to each UV galaxy, such extinction would amount to increasing the observed luminosity density by a factor of over 2.5. Other authors have argued for even greater absorption factors (e.g. Meurer et al. 1997). However, for the purpose of comparison with other measurements as presented by Madau (1997), we adopt a correction factor of 1.8. This corresponds to the value found by interpolating the more modest corrections applied by Madau to the luminosity densities observed at 2800 and 1500 Å respectively.
The UV continuum emission in all but the oldest galaxies is dominated by short-lived massive main sequence stars of spectral class late-O/early-B and, modulo the effects of dust, provides one of the most direct measures of the instantaneous star-formation rate (SFR) (Madau 1997). For a Salpeter IMF extending from 0.1 to 125 , and assuming solar metallicity, the SFR in units of , uncorrected for dust extinction, is:
| (6) |
Assuming a Scalo IMF, which is significantly less rich in massive stars, increases this value by +0.3 dex (Madau 1997).
In the approximation of instantaneous recycling (Tinsley 1980), the ejection rate of newly synthesized heavy elements () is directly proportional to the star formation rate. The conversion factor is very sensitive to the slope and lower-mass cutoff of the IMF. With our present assumption of a Salpeter IMF, a mass range and initial solar metallicity, our dust-corrected estimate yields:
| (7) |
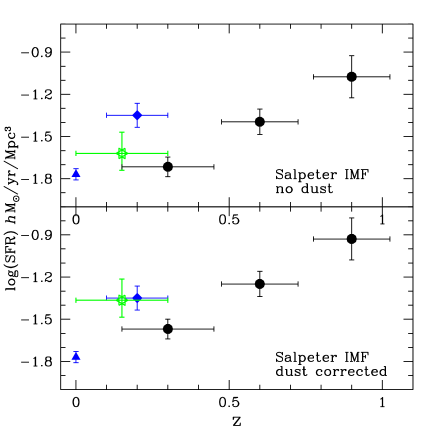
Figure 9 shows recent estimates of the volume-averaged SFR at low redshifts derived from various UV and H measurements. The upper panel shows the ‘raw’ estimates, whilst in the lower panel the UV data (this work and that based on the rest-frame 2800 Å flux density of Lilly et al. (1997)) has been corrected for a modest amount of dust extinction following the discussion of Madau (1997). In both panels the other estimates based on fluxes (Tresse & Maddox 1997, Gallego et al. 1995) are as discussed by Madau. Our dust-corrected value is in good agreement with the Tresse & Maddox determination, but a factor of higher than the Lilly et al. estimate and a factor of higher than the local H estimate of Gallego et al. Clearly there is growing evidence that the local density of star formation has been underestimated and this upward trends reduces the strength of the evolution claimed. The point is reinforced to some extent by the absence of any strong evolutionary trend within our own data. Ultimately, with a larger sample and better quality spectra, it will be profitable to compare the results obtained from the UV continuum and emission on a one-to-one basis.
5 Conclusions
We present the first results of a ongoing spectroscopic survey of galaxies selected in the rest-frame ultraviolet. The source catalogue for this survey was constructed from a flux-limited sample of stars, galaxies and QSOs imaged at 2000 Å with the FOCA balloon-borne camera (Milliard et al. 1992). Optical spectroscopy was conducted with the WIYN and WHT telescopes for 142 faint sources in Selected Area 57.
The redshift distribution extends over , with mean redshift . A high fraction (46%) of the sources shows intense nebular emission lines with [OII]3727Å 15 Å, and about 10% show ultraviolet-optical colors up to 2 magnitudes bluer than expected for normal Hubble sequence galaxies.
Our data suggests that optically-selected samples used for deriving -corrections are deficient in star-forming galaxies. The additional star-forming galaxies may contribute to the apparent excess of faint blue sources observed in deep optical sky surveys and will reduce the strength of the claimed evolution in blue luminosity density to 1.
The UV-optical colour distribution and UV number counts cannot easily be reconciled via minor adjustments to the optical luminosity distributions. In general, it seems the statistical properties of galaxies in the UV cannot be accurately predicted from limited UV data for optically-selected samples.
We have derived the rest-frame ultraviolet galaxy luminosity function at the mean redshift of the sample. We find a faint end slope considerably steeper than that of the local optical luminosity function.
Adopting a Salpeter IMF and a modest amount of dust reddening, we use the integrated UV light detected to estimate the local volume averaged star formation rate. Our value is in good agreement with the recent estimate of Tresse & Maddox (1997), derived from H line measurements at similar redshifts, but a factor of 1.6 higher than the low-redshift estimate of Lilly et al. (1996), based on optical data colour shifted in the near UV.
ACKNOWLEDGEMENTS
We thank the referee, Dr Gerhardt Meurer, for his valuable comments and for pointing out an inconsistency in our original manuscript. We thank Richard McMahon for invaluable assistance in matching the UV data with APM catalogues and Di Harmer for the charm and efficiency with which she helped us secure the WIYN data. We acknowledge generous assistance from support staff at La Palma and useful discussions with Tom Broadhurst, Max Pettini and Laurence Tresse.
References
- [] Baugh, C., Cole, S. & Frenk, C.S. 1996, MNRAS 282, 27.
- [] Boyle, B.J., Shanks, T., & Peterson, B.A. 1988 MNRAS 235, 935.
- [] Burstein, D., Bertola, F., Buson, L.M., Faber, S.M. & Lauer, T.R. 1988, Ap J 328, 440.
- [] Broadhurst, T.J., Ellis, R.S. & Shanks, T. 1988 MNRAS, 235, 827.
- [] Brown, T.M., Ferguson, H.C., Davidsen, A.F., Dorman, B. 1997 Ap J, 482, 685.
- [] Buat, V. & Burgarella, D. 1998, A&A, in press.
- [] Charlot, S. 1996, in ’From Stars to Galaxies’, ASP Conf. Series 98, p. 275.
- [] Cole, S., Aragon-Salamanca, A., Frenk, C.S., Navarro, J.F. & Zepf, S.E. 1994 MNRAS, 271, 744.
- [] Coleman, G.D., Wu C-C & Weedman, D. 1980 Ap J Suppl, 43, 393.
- [] Cowie, L. & Hu, E. 1998, astro-ph/9801003.
- [] Donas, J., Deharveng, J.M., Laget, M., Milliard, B. & Huguenin, D. 1987, A&A, 180, 12.
- [] Donas, J., Milliard, B., Laget, M. 1995, A&A, 305, 661.
- [] Ellis, R.S., Gondhalekar, P. & Efstathiou, G. 1982 MNRAS 201, 223.
- [] Ellis, R.S., Colless, M., Broadhurst, T.J., Heyl, J. & Glazebrook, K. 1996, MNRAS 280, 235.
- [] Ellis, R.S. 1997 Ann Rev Astron Astrophys, 35, 389.
- [] Fall, S.M., Charlot, S. & Pei, Y.C., 1996, Ap J, 464, L43.
- [] Felten, J.E. 1977, AJ 82, 861.
- [] Fioc, M. & Rocca-Volmerange, B. 1997, A&A 326, 950.
- [] Gallego, J., Zamorano, J., Aragon-Salamanca, A. & Rego, M. 1995, Ap J Lett, 361, L1.
- [] Heyl, J.S., Colless, M., Ellis, R.S. & Broadhurst, T.J. 1997 MNRAS 285, 613
- [] Kaufmann, G., Guiderdoni, B. & White, S. 1994, MNRAS 267, 981.
- [] King, C.R. & Ellis, R.S. 1985 Ap J, 288, 456.
- [] Kinney, A.L., Bohlin, R.C., Calzetti, D., Panagia, N., Wyse, R.F.G. 1993 Ap J Suppl., 86, 5.
- [] Kinney, A.L., Calzetti, D., Bohlin, R.C., McQuade, K., Storchi-Bergmann, T. & Schmitt, H.R. 1996 Ap J 467, 38.
- [] Leitherer, C. & Heckman, T. 1995, ApJ 96, 9.
- [] Lilly, S.J., Tresse, L., Hammer, F., Crampton, D. & LeFevre, O. 1995, Ap J, 455, 108.
- [] Lilly, S.J., LeFévre, O., Hammer, F. & Crampton, D. 1996, Ap J Lett, 460, L1.
- [] Madau, P, Ferguson, H C, Dickinson, M E, Giavalisco, M, Steidel, C C & Fruchter, A 1996, MNRAS 283, 1388.
- [] Madau, P 1997, preprint (astro-ph/9709147).
- [] Marzke, R., Huchra, J.P., Geller, M.J., Huchra, J.P. & Corwin, H.G. 1994 A J, 108, 437.
- [] Marzke, R. & Da Costa, L. 1997, AJ 113, 185.
- [] Metcalfe, N., Shanks, T., Fong, R. 1991, MNRAS 249, 498.
- [] Metcalfe, N., Fong, R. & Shanks, T. 1995, MNRAS 274, 769.
- [] Meurer, G., Heckman, T., Lehnert, M.D., Leitherer, C., Lowenthal, J. 1997, A J, 114, 54.
- [] Milliard B, Donas J, Laget M, Armand C, & Vuillemin A, 1992, A&A 257, 24.
- [] Pence, W D 1976 Ap J 203, 39.
- [] Peterson, B.A., Ellis, R.S., Shanks, T., Bean, A.J., Fong, R., Efstathiou, G. & Zou, Z-L. 1986, MNRAS 221, 233.
- [] Pettini, M., King, D., Smith, L. & Hunstead, R. 1997 ApJ 478, 536.
- [] Poggianti, B. 1997 Astr Astrophys Suppl, 122, 399.
- [] Rowan-Robinson, M. et al. 1997, MNRAS 289, 482.
- [] Smail, I., Ivison, R.J., Blain, A.W. 1997, Ap J, 490, L5.
- [] Steidel, C.C., Giavalisco, M., Dickinson, M. & Adelberger, K.L., 1996, Ap J. Lett, 462, L17.
- [] Schechter, P. 1976, ApJ 203, 297.
- [] Schmitt, H. R., Kinney, A.L., Storchi-Bergmann, T. & Antonucci, R. 1977 A J, 114, 592.
- [] Tinsley, B. 1980, Fundamentals of Cosmic Physics, 5, 287.
- [] Tresse, L., Rola, C., Hammer, F., Stasinska, G., Le Fevre, O., Lilly, S.J., Crampton, D. 1996, MNRAS 281, 847.
- [] Tresse, L. & Maddox, S. 1997, ApJ 495, 691.
| sample | OC | RA DEC | UV | OII | H | T | Comments | ||||
|---|---|---|---|---|---|---|---|---|---|---|---|
| WIYN | 1 | 13:06:01.14 29:21:14.7 | 18.53 | 19.29 | 0.2407 | 0 | 0 | 4 | -0.19 | -20.69 | HK,Hd |
| 1 | 13:04:31.58 28:48:55.0 | 17.68 | 10.72 | 0.0206 | 0 | 0 | 1 | 0.15 | -16.43 | HK,abs | |
| 1 | 13:05:01.02 29:03:43.2 | 17.75 | 18.54 | 0.1146 | 3 | 0 | 5 | -0.13 | -19.86 | OII, HK | |
| 1 | 13:06:27.79 29:09:09.3 | 16.77 | 14.77 | 0.0800 | 4 | 0 | 2 | 0.24 | -20.41 | OII,HK | |
| 1 | 13:06:08.41 29:16:38.7 | 18.19 | 18.69 | 0.0249 | 16 | 0 | 5 | -0.02 | -16.17 | OII, OIII | |
| 1 | 13:07:29.10 28:38:54.5 | 15.23 | 11.00 | 0.0231 | 0 | 0 | 1 | 0.16 | -19.15 | HK, abs | |
| 1 | 13:06:13.24 28:56:47.1 | 18.20 | 18.31 | 0.1222 | 15 | 0 | 4 | -0.13 | -19.56 | OII,HK,abs | |
| 1 | 13:05:13.62 28:44:45.9 | 18.15 | 18.65 | 0.0686 | 22 | 0 | 4 | -0.05 | -18.40 | OII,Hb,OIII | |
| 2 | 13:06:29.96 28:50:03.5 | 18.27 | 19.97 | 0.1849 | 6 | 0 | 6 | -0.20 | -20.34 | OII,HK,abs | |
| 1 | 13:06:26.18 28:50:23.5 | 17.22 | 17.30 | 0.0886 | 41 | 0 | 4 | -0.08 | -19.87 | OII,Hb,OIII | |
| 2 | 13:05:51.61 29:00:17.8 | 18.38 | 0.00 | 0.1053 | 0 | 0 | 0 | -0.11 | -19.06 | HK | |
| 1 | 13:05:50.11 29:06:51.2 | 16.36 | 13.28 | 0.0544 | 0 | 0 | 2 | 0.18 | -19.91 | HK, abs | |
| 1 | 13:05:08.45 28:44:10.1 | 17.32 | 16.91 | 0.0685 | 11 | 0 | 3 | -0.03 | -19.25 | OII, abs | |
| 2 | 13:03:57.96 28:52:18.3 | 18.04 | 20.91 | 0.1865 | 47 | 0 | 8 | -0.29 | -20.50 | OII, OIII | |
| 1 | 13:05:13.02 28:41:19.4 | 18.51 | 19.82 | 0.0770 | 42 | 0 | 6 | -0.07 | -18.28 | OII, Hb, OIII | |
| 1 | 13:03:47.89 29:02:28.4 | 17.49 | 19.26 | 0.0836 | 42 | 0 | 7 | -0.11 | -19.44 | OII, OIII | |
| 1 | 13:07:03.27 28:59:17.8 | 17.99 | 19.03 | 0.0376 | 23 | 0 | 6 | -0.03 | -17.26 | OII, Hb | |
| 1 | 13:06:04.40 28:36:59.0 | 17.53 | 16.60 | 0.0237 | 25 | 0 | 3 | 0.00 | -16.74 | OII, Hb, OIII | |
| 1 | 13:07:40.56 28:56:33.1 | 18.21 | 19.46 | 0.1220 | 11 | 0 | 6 | -0.14 | -19.53 | OII, HK, abs | |
| 1 | 13:06:20.66 29:09:25.9 | 16.93 | 17.00 | 0.0612 | 35 | 0 | 4 | -0.04 | -19.38 | OII,Hb,OIII | |
| 1 | 13:06:14.98 29:10:25.8 | 16.59 | 17.55 | 0.0395 | 28 | 0 | 6 | -0.03 | -18.77 | OII,Hb,OIII | |
| 3 | 13:04:19.78 29:00:26.9 | 17.46 | 18.34 | 0.1127 | 18 | 0 | 5 | -0.12 | -20.12 | OII,Balmer,Hb,OIII | |
| 1 | 13:04:52.46 28:41:20.3 | 17.71 | 19.17 | 0.0698 | 17 | 0 | 6 | -0.06 | -18.87 | OII,Hb,OIII | |
| 2 | 13:04:45.12 28:41:37.3 | 18.04 | 18.59 | 0.0346 | 19 | 0 | 5 | -0.03 | -17.03 | OII | |
| 1 | 13:03:55.90 28:44:11.1 | 17.40 | 18.92 | 0.2379 | 30 | 0 | 6 | -0.21 | -21.77 | OII,Balmer,Hb,OIII | |
| 1 | 13:05:45.10 29:18:35.4 | 16.59 | 17.14 | 0.0587 | 21 | 0 | 5 | -0.05 | -19.62 | OII,HK,Hb,OIII | |
| 2 | 13:07:05.25 29:11:28.7 | 16.82 | 17.77 | 0.0627 | 25 | 0 | 5 | -0.05 | -19.53 | OII,Hb,OIII | |
| 1 | 13:04:06.93 28:53:34.4 | 17.84 | 18.20 | 0.1866 | 5 | 0 | 4 | -0.18 | -20.81 | OII,HK,Hb,OIII | |
| 1 | 13:05:39.01 29:18:05.9 | 18.12 | 20.25 | 0.1443 | 32 | 0 | 7 | -0.22 | -19.92 | OII,OIII | |
| 1 | 13:05:54.39 28:57:38.7 | 16.57 | 19.25 | 0.0804 | 13 | 0 | 8 | -0.13 | -20.26 | OII,OIII | |
| 1 | 13:05:42.91 29:22:52.8 | 17.49 | 19.34 | 0.0525 | 6 | 0 | 7 | -0.06 | -18.47 | OII,OIII | |
| 1 | 13:06:03.73 28:50:27.4 | 16.41 | 16.29 | 0.0700 | 25 | 0 | 4 | -0.05 | -20.19 | OII,Balmer,Hb,OIII | |
| 1 | 13:06:49.06 28:43:19.2 | 17.91 | 18.59 | 0.0789 | 26 | 0 | 5 | -0.07 | -18.93 | OII, OIII | |
| 1 | 13:06:23.77 29:05:09.9 | 17.19 | 20.72 | 0.1384 | 31 | 0 | 8 | -0.23 | -20.74 | OII,Hb,OIII | |
| 1 | 13:07:26.48 29:14:32.2 | 16.79 | 19.89 | 0.1222 | 12 | 0 | 8 | -0.21 | -20.88 | OII | |
| 1 | 13:04:48.14 28:41:26.5 | 17.95 | 18.92 | 0.0179 | 30 | 0 | 6 | -0.01 | -15.70 | OII, OIII | |
| 1 | 13:04:33.35 28:48:11.3 | 18.23 | 20.08 | 0.1589 | 0 | 0 | 6 | -0.19 | -20.05 | HK | |
| 2 | 13:03:43.12 28:59:41.0 | 18.24 | 0.00 | 0.3712 | 11 | 0 | 0 | -0.40 | -21.76 | OII | |
| 1 | 13:05:52.13 29:17:22.0 | 16.82 | 16.90 | 0.0206 | 25 | 0 | 4 | -0.01 | -17.13 | OII,Hb,OIII | |
| 1 | 13:05:41.78 28:58:41.9 | 16.51 | 15.64 | 0.0800 | 4 | 0 | 3 | -0.04 | -20.39 | OII,HK,abs | |
| 1 | 13:05:16.20 29:17:05.5 | 18.04 | 17.17 | 0.1235 | 4 | 0 | 3 | -0.10 | -19.77 | OII,HK,abs | |
| 1 | 13:06:32.30 28:51:22.4 | 18.27 | 20.00 | 0.0696 | 33 | 0 | 6 | -0.06 | -18.31 | OII,Hb,OIII | |
| 2 | 13:08:00.21 28:54:33.6 | 17.61 | 18.60 | 0.1223 | 11 | 0 | 5 | -0.14 | -20.13 | OII,HK | |
| 1 | 13:07:39.47 29:07:24.7 | 18.06 | 20.28 | 0.2348 | 14 | 0 | 7 | -0.28 | -21.01 | OII,HK | |
| 1 | 13:04:05.73 28:41:24.0 | 17.89 | 19.09 | 0.0695 | 23 | 0 | 6 | -0.06 | -18.68 | OII,HK | |
| 1 | 13:05:58.96 28:47:52.5 | 18.25 | 19.91 | 0.1993 | 8 | 0 | 6 | -0.21 | -20.52 | OII,HK | |
| 1 | 13:05:40.90 29:15:52.3 | 16.20 | 14.49 | 0.0242 | 23 | 0 | 3 | -0.01 | -18.11 | OII,Hb,OIII | |
| 1 | 13:04:57.97 29:15:45.5 | 17.81 | 19.25 | 0.1894 | 26 | 0 | 6 | -0.20 | -20.85 | OII,OIII | |
| 1 | 13:04:14.54 29:07:00.6 | 14.26 | 0.00 | 0.0160 | 24 | 0 | 0 | -0.01 | -19.14 | OII,Hb,OIII | |
| 1 | 13:06:34.50 28:59:59.0 | 17.60 | 12.18 | 0.0560 | 0 | 0 | 1 | 0.31 | -18.86 | HK, abs | |
| 1 | 13:06:28.46 28:53:45.1 | 16.16 | 13.63 | 0.0227 | 17 | 0 | 2 | 0.10 | -18.12 | OII,Balmer,OIII | |
| 1 | 13:06:24.43 28:53:25.3 | 16.66 | 17.33 | 0.1893 | 79 | 0 | 4 | -0.19 | -22.02 | OII,Hb,OIII | |
| 1 | 13:04:25.09 28:59:31.8 | 18.09 | 17.83 | 0.0565 | 5 | 0 | 3 | -0.02 | -18.06 | OII,HK | |
| 1 | 13:06:32.05 29:07:04.6 | 17.66 | 17.78 | 0.0794 | 4 | 0 | 4 | -0.06 | -19.20 | OII,HK, abs | |
| 1 | 13:04:14.22 28:51:15.7 | 17.26 | 16.82 | 0.1225 | 0 | 0 | 3 | -0.10 | -20.53 | HK,abs |