2.5–11.6 spectrophotometry and imaging of the CfA sample
Abstract
We present low resolution spectrophotometric and imaging ISO observations of a sample of 54 AGN’s over the 2.5–11 range. The observations generally support unification schemes and set new constraints on models of the molecular torus.
ISO Science Operations Centre, Astrophysics Division, ESA Space Science Dept.,P.O. Box 50727, 28080 Madrid, Spain
1. Introduction
According to the so-called “unified model” of Active Galactic Nuclei (AGN), Seyfert 1 and Seyfert 2 galaxies (hereafter Sf1 and Sf2, respectively) are essentially the same objects viewed at a different angle: Sf1’s are observed close to face-on such that we have a direct view to the Broad emission Line Region (BLR) and to the accretion disk responsible for the strong UV-Optical-X-ray continuum, whereas Sf2’s are seen at an inclination such that our view is blocked by an optically thick dusty torus which surrounds the disk and the BLR (e.g. Antonucci 1993). This model makes specific predictions. In particular, the UV photons from the disk which are absorbed by the grains in the torus should be re-emitted as dust thermal emission in the IR. Several observational arguments constrain the torus inner radius to be of the order of 1 pc in which case the gas and dust temperature should peak to about 700–1000 K and give rise to a thermal emission “bump” with a maximum between 7 and 15 depending on the torus inclination (Pier and Krolik 1992). This model also predicts that the silicate 9.7 feature should appear preferentially in absorption in Sf2’s and in emission in Sf1’s. In order to test these predictions and better constrain the model, we initiated a programme of mid-IR observations of a large sample of AGN’s. Throughout we use .
2. Observations
A sample of 54 Active Galactic Nuclei (AGN) was observed with the PHT (Lemke et al. 1996) and CAM (Cesarsky et al. 1996) instruments on board the Infrared Space Observatory (ISO; Kessler et al. 1996). The sample is drawn from the CfA hard X-ray flux limited complete sample but lacks the most well known objects (e.g. NGC 4151) which were embargoed by ISO guaranteed time owners. On the other hand, the sample was enriched in bright Sf2’s. We therefore caution that our sample is by no mean “complete” in a statistical sense. It is about equally divided into Sf1’s (26 sources) and Sf2’s (28), where we define Sf1’s as all objects of type 1.5 and Sf2’s those whose type is 1.5. The mean and redshift are and for Sf1’s and Sf2’s, respectively.


For each object, the data-set consists of CAM images obtained through filters at 6.75 and 9.63 and at a magnification of 3” per pixel, together with 2.5–11.6 spectra obtained immediately after with the PHT-S low resolution () spectrograph. The images consists of arrays of pixels (i.e. ”) with an effective resolution (FWHM) of 3.8” and 4.5”, for the 6.75 and 9.63 filters, respectively. The exposure times were 200 s, sufficiently long to ensure stabilisation of the detectors. For the spectra, on-source measurements were alternated with sky measurements at a frequency of 1/256 Hz, with a chopper throw of 300”. The on-source exposure times varied between 512 s and 2048 s, depending on the source brightness. The spectrograph aperture is square. In all cases, the array or spectrograph was centered at the nominal position of the nucleus to within 2”.
3. Calibration and data reduction
The CAM images were reduced and calibrated using standard procedures of the CAM Interactive Analysis (CIA) package. Nuclear fluxes were obtained by integrating all the emission in a circle of 5–6 pixels radius (15–18”). Their accuracy, mainly limited by flat-fielding residuals, is %. Radial profiles were also computed and compared to that of point-like calibration stars. For all sources but 4, we verified that the AGN are unresolved at the ” resolution of ISOCAM.
Because PHT-S was operating close to its sensitivity limit, special reduction and calibration procedures had to be applied. After a change of illumination, the responsivity of the Si:Ga photoconductors immediately jumps to an intermediate level. This initial jump is followed by a characteristic slow transient to the final level. At the faint flux limit, this time constant is extremely long, and in practice only the initial step is observed in chopped-mode. The spectral response function for this particular mode and flux-level was derived directly from observations of a faint standard star HD 132142 whose flux ranges from 0.15 to 2.54 Jy. The calibration star observation was performed with the same chopper frequency and readout-timing as the astronomical observations. The of the PHT-S spectra was considerably enhanced by two additional measures that deviate from the standard reduction procedure. ) the long integration ramps (32 s each) were divided into sub-ramps of 2 sec and no de-glitching (removal of cosmic ray hits) was performed at ramp-level ) after slope-fitting and de-glitching at slope-level, the maximum of the distribution of the slopes was determined by fitting a gaussian to the histogram. The resulting PHT-S fluxes should be accurate to within %.
For all sources but 4, the agreement between the CAM and the PHT-S fluxes is excellent which confirms the reliability of our calibration. The 4 mismatches correspond to those cases where the source is spatially resolved and contribution from the underlying galaxy is visible in the CAM image (see above).
4. The difference between Sf1 and Sf2
As illustrated in fig 1, the mid-IR spectrum of a typical Sf1 (Mrk 509, left) is markedly different from that of a Sf2 (NGC 5953, right): Sf1’s have a strong continuum well approximated by a power-law () of average index and dispersion and weak emission features. By contrast, Sf2’s display only a weak and ill-defined continuum together with very strong emission features. These features have well defined peaks at at 6.2, 7.7 and 8.6 , and in many Sf2’s, a weaker feature can also be seen at 3.3 . These features are ubiquitous in many galactic and extragalactic sources, in particular HII regions and starburst galaxies (see Genzel et al 1998 for instance). They are usually ascribed to Polycyclic Aromatic Hydrocarbon (PAH) bands. In many galaxies of adequate and redshift, the blue side of the strong 11.3 PAH feature is also detected as a sharp rise in flux toward the long wavelength end of the PHT-S array (see e.g. fig 3.b).


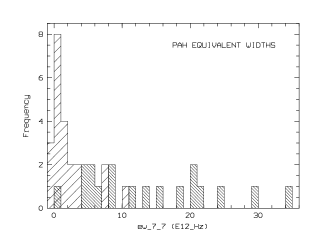
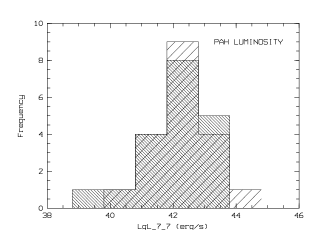
The PAH fluxes and Equivalent Widths (EW) were computed by integrating all the emission above the best-fit power-law continuum. The resulting EW distribution of the strongest PAH bands at 7.7 is shown in fig 2.a. It clearly illustrates that the PAH in Sf1’s are systematically weaker than in Sf2’s where EW’s extend up to . A two-tail KS test confirms that Sf1’s and Sf2’s have statistically different EW distributions at the confidence level. The mean () PAH equivalent widths of Sf1’s is , nearly 7 times smaller than that of Sf2’s, . As can be seen from fig 2.b, the distribution of the 7.7 PAH luminosities is however the same in Sf1’s and Sf2’s, at the 22 % confidence level (KS test). The mean () PAH luminosity of Sf1’s is , not statistically different (at the 92.9 % confidence level from a Student-t test) from that of Sf2’s, .
5. Implication for unification schemes
The continuum flux at a fiducial wavelength of 7 was read-out from the best-fit power-law. The resulting mean () continuum logarithmic luminosities for Sf1’s and Sf2’s are and , respectively, implying that the mid-IR continuum of Sf2’s is 8 times less luminous, on the average, than that of Sf1’s. This ratio is very close to the Sf2/Sf1 EW ratio. Altogether, these results imply that the prime distinguishing feature of Sf2’s in the mid-IR is that their continuum is depressed relative to that of Sf1’s.
The above result is broadly consistent with unification schemes in that the mid-IR continuum, which is directly visible in face-on objects (i.e. Sf1’s), is largely extinguished in edge-on objects (i.e. Sf2’s). It further implies that the torus is largely opaque to its own mid-IR radiation. Assuming that face-on objects suffer zero extinction, one can use the average ratio of PAH EW in Sf1’s and Sf2’s to infer the mean 7.7 extinction along the direction perpendicular to the torus symmetry axis (i.e. radially). The average ratio is , where the error quoted reflects the r.m.s. dispersion of Sf2 EW’s (we have neglected the scatter in Sf1’s EW’s). This implies that the Sf2 continuum suffers on the average from magnitudes of extinction at 7.7 , i.e. magnitudes (Rieke and Lebofsky 1985). For a normal gas to dust ratio, this corresponds to an average X-ray absorbing column along one torus radius, (Gorenstein 1975). The latter is in good agreement with the mean absorbing column of 8 Sf2’s (excluding the lower limits on NGC 1068 and NGC 7582) as measured directly from X-ray data, (Mulchaey et al. 1992).
It also suggests that PAH emission is isotropic and arises from outside the torus, either in the Narrow Line Region or in the ISM of the bulge. To check the origin of the PAH features in Sf2’s, we have observed the nucleus of the “normal” (i.e. non active) SB galaxy NGC 701. Its PHT-S spectrum is plotted in fig 3.a together with that of the Sf2 nucleus NGC 5953. The two spectra are virtually indistinguishable. As a matter of fact, the EW of the PAH 7.7 feature in NGC 701, 4.2 and its luminosity are in the middle of the range of Sf2’s. We therefore conclude that the PAH emission is unrelated to the active nucleus and arise from the ISM in the bulge.
As can be seen from fig 3.a, the continuum of NGC 5953 is also indistinguishable from that of NGC 701. This further suggests that in Sf2’s with PAH EW’s in excess of , the torus emission is completely suppressed, at least up to 11 , and the faint residual mid-IR continuum arises entirely from outside the active nucleus, i.e. from stars at wavelengths shorter than and from small ISM dust particles at longer wavelengths. In such objects, the PAH EW only provides a lower limit to and . Hence, our previous estimate of the average extinction in Sf2’s is probably underestimated. From the 28 Sf2’s, 8 have . This suggests that about 30 % of Sf2 suffer from extinction in excess of 125 visual magnitudes and have hydrogen columns larger than . These extreme Sf2’s probably correspond to NGC 1068-type objects where the absorbing column is so large as to block all hard X-rays.
6. The Silicate 9.7 features and further constraints on the torus
Fig. 3.b shows the weighted mean Sf1 spectrum obtained by averaging the rest wavelength spectra of all 26 type galaxies. The Silicate 9.7 feature is present in emission with an equivalent width . This immediately rules out models with very large torus optical depths. In the model of Pier and Krolik (1992) for instance, the strength of the Silicate feature is calculated as a function of inclination and of the vertical and radial Thomson optical depth and , respectively. Reading from their figure 8, models with and/or are ruled-out as they would predict the Silicate feature in absorption. For an average Sf1 inclination , the best fit to suggests and . A unit Thomson optical depth corresponds to a column density . While these figures are somewhat uncertain and model dependent, it is reassuring that the inferred range in column densities agrees with our previous estimate based on the Sf2 extinction.
We are not able to state whether the Silicate feature is present in Sf2’s. As a matter of fact, the PAH bands at 7.7, 8.6 and 11.3 are so strong that placing the continuum at 9.7 becomes a rather subjective decision. In the absence of longer wavelengths data, the best we can do is set a provisional upper limit of 1 to the Silicate EW in Sf2’s, whether in absorption or in emission.
7. Energy distribution of Seyfert 1’s
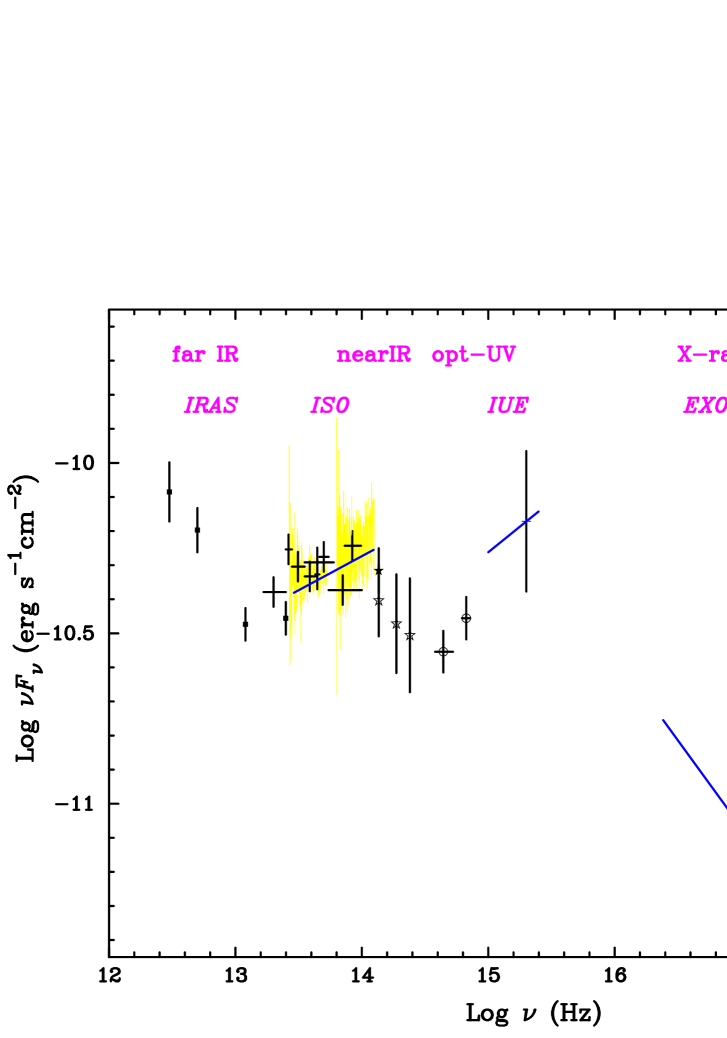
The SED of Mrk 279 is shown in fig 4. This Sf1 galaxy was also the subject of an ISO monitoring campaign the result of which will be presented elsewhere (Santos-Lléo et al., 1998). Its spectral index and PAH 7.7 EW () are fairly typical of Sf1’s. The Mrk 279 SED was assembled from published data as explained in Santos-Lléo et al. The average IUE flux is plotted with its mean spectral index and range of variability. The PHT-S spectrum is shown together with the best fit power-law continuum and the ISOCAM photometric data-points. Beside the usual “big blue bump” and the far-IR () rise due to cool dust emission from the large scale ISM, the Mrk 279 SED shows a third excess in the range 1.25–15 . As noted by Santos-Lléo et al., the spectral shape of this “mid-IR bump” is strikingly similar to the theoretical emission spectrum of a face-on torus as computed by Pier and Krolik (1992). A detailed comparison with the model is beyond the scope of this paper, but we take this match as a further confirmation that unification schemes are correct, at least to a first order approximation, and that a molecular torus exists in at least some AGN’s. On the other hand, it is not clear that all Sf2’s are obscured by a thick torus. Indeed, those Sf2’s with small PAH EW – similar to those of Sf1’s (see fig-2.a) – could well be genuine Sf1’s where our line of sight intercepts a foreground dust screen in the general ISM of the host galaxy.
Discussion
Dr. Deborah Dultzin-Hacyan: Have you compared the properties of Sf2’s with starburst galaxies ?
Jean Clavel: Unfortunately there were no starburst galaxies in our sample. However, Genzel et al (1998) have observed a sample of 12 starburst galaxies with PHT-S. They define a“PAH strength” as the ratio of the flux at the peak of the 7.7 feature to the underlying continuum flux. The mean ( r.m.s.) strength for their starburst’s sample is , almost identical to that of our Sf2 sample, .
Dr. Bev Wills: Are your results consistent with the findings of Roche and Aitken who concluded that the 10 (20 ?) features were present in Sf2’s, but absent in Sf1’s and that this may indicate destruction of the carrier by exposure to the AGN continuum ?
Jean Clavel: Roche et al. (1991) observed a sample of 60 IR bright galaxies – starburst’s and AGN’s – in the 8–13 range. A direct comparison with their results is difficult given the small overlap in wavelengths between the two data-set. Their and resolution was also lower than ours. One of Roche et al’s conclusion was that, in AGN’s, the PAH features “are seen only rarely, but the silicate absorption band is present in about half of the sample and is more prevalent in the lower luminosity objects”. This clearly conflicts with our results which show that PAH features are present in all AGN’s but are definitely weak in Sf1’s, probably too weak to be detected from the ground. The other problem with the Roche et al. data was their restricted wavelength range which did not allow them to properly define a baseline continuum. This is probably the reason why they wrongly identified a gap between the strong PAH 7.7/8.6 emission blend and the 11.3 PAH feature as due to silicate 9.7 absorption.
References
Antonucci, R. 1993, ARA&A, 31, 473
Cesarsky, C.J., et al. 1996, A&A, 315, L32
Genzel, R. et al. 1998, ApJ, in press (MPE Preprint 426)
Gorenstein, P. 1975, ApJ, 198, 95
Kessler, M.F., Steinz, J.A., Anderegg, M.E., et al. 1996, A&A, 315, L27
Lemke, D., Klaas, U., et al. 1996, A&A, 315, L64
Mulchaey, J.S., Mushotzky, R.F. & Weaver, K.A. 1992, ApJ, 390, L69
Pier, E.A. & Krolik, J.H. 1992, ApJ, 401, 99
Rieke, G.H. & Lebofski, M.J. 1985, ApJ, 288, 618
Roche, P.F. et al. 1991, MNRAS, 248, 606.
Santos-Lléo, M. et al. 1998, in preparation