SYNCHROTRON EMISSION FROM THE GALAXY
Galactic synchrotron emission is a potentially confusing foreground, both in total power and in polarization, to the Cosmic Microwave Background Radiation. It also contains much physical information in its own right. This review examines the amplitude, angular power spectrum and frequency spectrum of the synchrotron emission as derived from the presently available de-striped maps. There are as yet no maps at arcminute resolution at frequencies above 2.4 GHz. This incomplete information is supplemented with data from supernovae, which are thought to be the progenitors of the loops and spurs found in the Galactic emission. The possible variations of the frequency spectral index from pixel to pixel are highlighted. The relative contributions of free-free and synchrotron radiation are compared, and it is concluded that the free-free contribution may be smaller than had been predicted by COBE. New high resolution polarization surveys of the Galactic plane suggest detail on all scales so far observed. At high latitudes the large percentage polarisation means that the foreground contamination of the polarised CMB signal will be more serious than for the unpolarized radiation.
1 Introduction
Galactic emission at radio wavelengths is important to understand in its own right. Moreover it is crucial to be able to quantify and remove this component as a foreground to the cosmic microwave background (CMB). Both synchrotron and free-free emission contribute to this foreground, with the synchrotron emission dominating at low frequencies (1 GHz).
The synchrotron emissivity is a function of both the relativistic (cosmic ray) density and the local magnetic field strength. The luminosity at frequency is given by
| (1) |
where is the density of relativistic electrons, is the emission depth, is the magnetic field and the relativistic electron energy spectrum is given by . The radio spectral index is in energy terms or when expressed as a brightness temperature . Within the interstellar magnetic field of 2 to 5 microgauss, emission at GHz frequencies is characteristically from relativistic electrons with an energy of 1 to 10 GeV. Both and , as well as , will vary from point to point in the Galactic disk and nearby halo. The cosmic ray electrons are thought to originate mainly in supernovae then diffuse outwards in the expanding remnant. Structure will be formed in the remnant as it collides with the non-uniform ambient medium. The magnetic field will be likewise amplified in compression regions and vary in strength and direction. The net effect is to produce elongated synchrotron emission structures on a wide range of scales. The spectral index of the emission will vary with position for two reasons. Firstly the electron spectral index varies from one supernova to another and secondly the spectrum steepens () with time due to radiation energy loss thus giving an age-dependent spectral index.
This paper will describe the synchrotron features in and near the Galactic plane which are believed to give rise to the structures seen at higher galactic latitudes. All-sky and large area surveys are assessed to give information about the amplitude and spectrum of the high latitude emission which is a potential confusing foreground to the CMB. Comments are given about the role of synchrotron polarization and of free-free emission.
2 Large area surveys at low frequencies
Radio surveys at frequencies less than 2 GHz are dominated by synchrotron emission. The well-known survey by Haslam et al. at 408 MHz is the only all-sky map available. Large-area surveys with careful attention to baselines and calibration have also been made at 1420 MHz and most recently at 2326 MHz . All these investigations have been made with FWHP beamwidths of less than 1∘. Before these surveys can be used to derive the angular power spectrum and the emission (frequency) spectral index, it is necessary to remove the baseline stripes in the most commonly used radio maps at 408 and 1420 MHz. These stripes contain power on angular scales of a few to ten degrees. Lasenby has used the 408 and 1420 MHz surveys to estimate the spatial power spectrum of the high latitude region surveyd by the Tenerife CMB experiments; he found an angular power spectrum somewhat flatter than the law derived for HI and for IRAS far infrared emission.
The spectral index of Galactic synchrotron emission can be readily determined at frequencies less than 1 GHz where the observational baselevel uncertainty is much less than the total Galactic emission. Lasenby used data covering the range 38 to 1420 MHz to determine the spectral index variation over the northern sky. Clear variations in spectral index of at least 0.3 about a mean value of 2.7 were found. There was a steepening in the spectral index at higher frequencies in the brighter features such as the loops and some SNRs. Up to 1420 MHz, no such steepening was found in the regions of weaker emission. At higher Galactic latitudes where no reliable zero level is available at 1420 MHz, an estimate can be made of the spectral index of local features by using the T-T technique. The de-striped 408 and 1420 MHz maps gave spectral indices of = 2.8 to 3.2 in the northern galactic pole regions .
The de-striped 408 MHz map shows there are substantial areas ( in RA Dec) in both the northern and southern skies which are devoid of appreciable synchrotron structure and can be used for CMB studies. The Tenerife experiments have been based on the northern low emissivity band centred on Dec = 40∘, RA = 130∘ to 250∘ where the rms Galactic emission in a 5∘ beam is K at 33 GHz .
3 What we know from SNRs
Supernovae are probably the progenitors of the main structures in the Galactic radio emission at intermediate latitudes. The supernova remnants (SNRs) are the easily recognisable early stages of the expansion phenomenon. A supernova releases about ergs into the interstellar medium (ISM). This passes through the free expansion phase, then after it has encountered its own mass in the ISM it moves into the Sedov (adiabatic) phase. The SNR shock ultimately disappears when the expansion velocity slows to the local sound velocity. This process takes to years to reach the point where the remnant is not clearly recognizable as a single entity but will still give rise to synchrotron emission from the residual CR electrons and magnetic fields.
An examination of statistics and structure of SNRs will give some indication of the properties of the emission from their residual structures. Firstly, it is possible to recognise the various evolutionary phases in the SNR phenomenon in individual remnants. Objects like Cas A and the Crab Nebula (500 to 1000 years old) are in the early free expansion stage while the Cygnus Loop (15 to 20,000 years old) is losing energy in multiple shocks. Secondly, the statistics of the spectral index of the integrated emission show a spread of of about the mean value of 0.7 , with some objects such as the Crab Nebula ( = 0.3) having more extreme indices. This spread will presumably result in a spread in the spectral indices of their residual structures.
The Cygnus Loop provides an excellent case study of an SNR in its late phase of evolution. High sensitivity maps of arcmin resolutions are available at a range of frequencies. This remnant is 3.∘5 x 2.∘5 (30 pc 20 pc) in diameter lying at l = 74∘, b = -8.∘5 and at a distance of 500-800 pc. The 1.4 GHz synthesis map by Leahy, Roger and Ballantyne made with a 1x1 arcmin2 beam shows both filamentary and diffuse structure on angular scales from a few to 30 arcmins. By comparing maps at 0.408 and 2.695 GHz Green finds significant variations (0.3) in spectral index between the major features of the remnant.
4 What we know from spurs and loops
Large features with a synchrotron spectrum extend far from the Galactic plane. The most prominent of these are the spurs and loops which describe small circles on the sky with diameters in the range 60∘ to 120∘ . Because of their association with HI and, in some cases, with X-ray emission, they are believed to be low surface brightness counterparts of the brighter SNRs seen at lower latitudes. Other more diffuse structure at higher latitudes may be even older remnants. Reich and Reich find that the Loops I (the North Polar Spur) and II have a steeper spectrum than the average Galactic emission. Between 408 MHz and 1420 MHz these two loops have temperature spectral indices of 2.93 and 2.85 respectively. Using T-T plots Davies, Watson and Gutierrez derived a spectral index of = 3.2 for the brightest part of Loop I. Lawson et al. claim that most of the large structures seen on the maps are related to Loops I and III suggesting that they are the evidence of diffusive shock acceleration of the CR electrons derived from the supernova. They derive a distance for Loop I of 130 75 pc and a radius of 115 68 pc; Loop III is thought to be of similar size.
A revealing high sensitivity survey of a substantial part of the southern Galactic plane (l = 238∘ to 365∘, b = -5∘ to +5∘) has been made with a resolution of 10 arcmin at 2.4 GHz by Duncan et al. . These authors found a large amount of structure and detail including many low surface brightness loops and spurs. They also list over 30 possible SNR candidates, a number of which have angular diameters of about 10∘. Many of the spurs can be traced even further from the plane in the 2.326 GHz survey of Jonas, Baarth and Nicolson . The spectral index of these new spurs has still to be determined.
5 Higher frequency surveys at Jodrell Bank and Tenerife
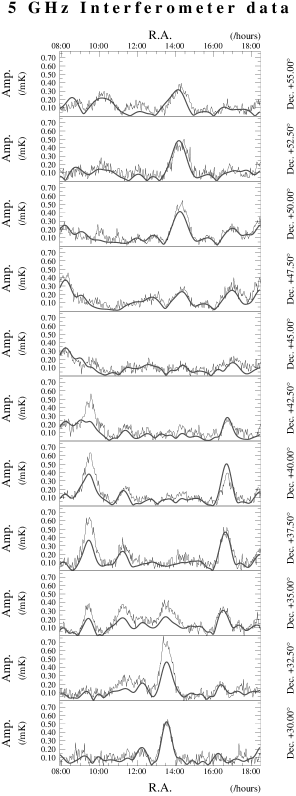
It is important to make Galactic surveys at intermediate and high latitudes at frequencies closer to those at which the CMB structure is being investigated. Because of the variation of spectral index from one region to another, the structure at 408 MHz will be quite different from that at 10 or 30 GHz. Two separate experiments have been established to address this problem. The first is a high sensitivity short baseline interferometer operating at 5 GHz at Jodrell Bank (Fig. 1). By making observations at a range of baselines the point source and the Galactic contribution to the microwave background can be separated. After correction for the point sources the Galactic emission at 5 GHz can be compared with the published 408 MHz survey. The spectral index of Galactic features in the survey was found to be about 3.0 at intermediate and higher Galactic latitudes.
The 10, 15 and 33 GHz beamswitching radiometers at Teide Observatory Tenerife are scaled to give the same resolution (5∘ FWHP beamswitched 8∘). Comparison of the surveys at the three frequencies should allow the Galactic emission to be separated from the intrinsic CMB component. Observations already available from this experiment can constrain the Galactic contribution at 33 GHz. The observed rms fluctuation level at 10 GHz in the Dec = +40∘ scan between RA = 160∘ and 230∘ is 29 +20/-30 K . This rms level will include both a Galactic and CMB contribution. Using a 2 upper limit and subtracting quadratically the detected CMB signal (54 K) we derive an upper limit for the Galactic emission at 10 GHz of 43 K. This would produce an upper limit at 33 GHz of 2 K if it were synchrotron with = 3.0 and an upper limit of 4 K if it were free-free emission with = 2.1. Hancock et al. derive a spectral index for Galactic emission at the 3 frequencies of = 3.1.
6 Synchrotron versus free-free
Free-free emission is not easily identified at radio frequencies except near the Galactic plane. At higher latitudes it must be separated from synchrotron emission by virtue of its different spectral index. At higher frequencies where free-free emission might be expected to exceed the synchrotron component, the signals are weak and the survey zero levels are indeterminate. Most of the information on the thermal electron content currently available at intermediate and higher frequencies comes from H surveys. This diffuse H emission is thought to be a good tracer of diffuse free-free emission since both are emitted by the same ionized medium and both intensities are proportional to emission measure (), the line of sight integral of the free electron density squared. Major H structures are a feature of the well-known Local (Gould Belt) System which extends some 40∘ from the plane at positive in the Galactic centre and at negative in the anticentre. Other H features are known to extend 15∘ to 20∘ from the plane .
The intermediate latitude H distribution may be modelled (Reynolds 1992) as a layer parallel to the Galactic plane with a half-thickness intensity of 1.2 Rayleigh (R). The rms variation in this H emission is about 0.6R on degree scales. In the context of the present discussion 1R will give a brightness temperature of about 10 K at 45 GHz. Further information about angular structure in the H emission can be derived from the North Celestial Pole (NCP) study by Gaustad et al.. Veeraraghavan & Davies used this material to derive a spatial power spectrum on angular scales of 10 arcmin to a few degrees. The spatial power law index is -2.3 0.1 over this range with an rms amplitude of Rayleighs on 10 arcmin scales. This level is consistent with the limits derived from the Tenerife experiments and indicates that the free-free rms brightness becomes comparable with the synchrotron value at about 20 GHz where it would comprise 10 to 20 percent of the CMB fluctuation amplitude. Kogut et al. compared the COBE DMR maps with the DIRBE maps and claimed a correlation between free-free and dust emission. They obtained free-free levels somewhat higher (in a 7∘ beam) than measured more directly in the Tenerife experiments.
6.1 A note on polarization
Extensive surveys of the polarization of Galactic synchrotron polarization have been made at frequencies up to 1-2 GHz. Significant polarized signals are found over most of the surveyed sky. The percentage polarization increases with frequency indicating the presence of a Faraday rotating medium with a rotation measure of 8 rad m-2 . The mean polarization amplitude at 1400 MHz lies between 20 and 30 % at higher () Galactic latitudes as seen in an 0.∘6 beam. The polarization degree in Loop I reaches 72 % at higher Galactic latitudes. This is close to the theoretical upper limit where the fractional polarization is given by
| (2) |
where is the temperature spectral index. The other loops have maximum polarization in the range 30-50 %.
A detailed study of the polarization of the Cygnus Loop has been made at 1.4 GHz by Leahy, Roger & Ballantyne . They find that the bright filaments have the B field aligned along their length with a maximum polarization in the remnant of 39 percent and a mean value of 7 percent. The lower values of polarization in some areas are most likely due to depolarization in the Faraday screen of the object which has a rotation measure of -20 to -35 rad m-2. The 5 GHz map of Kundu & Becker shows a fractional polarization of 25 percent over the southern half of the source.
The 2.4 GHz Galactic plane survey by Duncan et al. shows considerable complex structure with their 10 arcmin beam. Bright, extended regions of polarization emission of the order of 5∘ across include the Vela SNR and a large structure appearing to the north of Sgr A. A quasi-uniform weak component of patchy polarization is seen over the length of the survey.
Theory indicates that the CMB radiation will be polarized at a level of 5 to 10 percent. On the other hand the synchrotron emission can be 30 percent polarized at 1.4 GHz and probably higher at higher frequencies. Accordingly this foreground Galactic polarization must be considered more seriously than the total power case when measuring CMB polarization. A foreground feature which is 10 percent of an intrinsic CMB feature may have polarization which is 30 to 50 percent of the polarized intensity of the feature.
Acknowledgments
AW would like to acknowledge the receipt of a Daphne Jackson Research Fellowship, sponsored by PPARC.
References
References
- [1] Berkhuijsen E.M., Haslam C.G.T., Salter C.J., Astr. Astrophys. 14, 252 (1971).
- [2] Davies R.D., Watson R.A., Gutierrez C.M., Mon. Not. R. astr. Soc. 278, 925 (1996).
- [3] Duncan A.R., Stewart R.T., Haynes R.F., Jones K.L., Mon. Not. R. astr. Soc. 277, 36 (1995).
- [4] Duncan A.R., Haynes R.F., Jones K.L, Stewart R.T., Mon. Not. R. astr. Soc. 291, 279 (1997).
- [5] Gaustad J., McCullough P., van Buren D., Pub.Astron.Soc.Pacific 108, 351 (1996).
- [6] Green D., Astron. J. 100, 1927 (1990).
- [7] Hancock S. Davies, R.D., Lasenby, A.N. Guttierrez, C.M., Watson, R.A., Rebolo. R. and Beckman, J.E., Nature 367, 333 (1994).
- [8] Haslam C.G.T., Salter C.J., Stoffel H., Wilson W.E., Astr. Astrophys. Suppl. ?47, 1 (1982).
- [9] Jonas J.L., Baart E.E., Nicolson G.D., Mon.Not.R.ast.Soc. in press, 1998.
- [10] Kogut A. et al., Astrophys. J. 460, 1 (1996).
- [11] Kundu M.R., Becker R.H., Astron. J. 77, 459 (1972).
- [12] Lawson K.D., Mayer C.J., Osborn J.L., Parkinson M.L., Mon. Not. R. astr. Soc. 225, 307 (1987).
- [13] Leahy D.A., Roger R.S., Ballantyne D., aj 114, 2081 (1997).
- [14] Melhuish S.J. et al., Mon. Not. R. astr. Soc. 286, 48 (1997).
- [15] Reich P., Reich W., Astr. Astrophys. Suppl. 63, 205 (1986).
- [16] Reich P., Reich W., Astr. Astrophys. Suppl. 74, 7 (1988).
- [17] Reynolds J., Astrophys. J. 392, L35 (1992).
- [18] Reynolds S., Galactic and Extragalactic Radio Astronomy, (Springer-Verlag, Berlin, 1988).
- [19] Sivan,J.P, Astr. Astrophys. Suppl. 16, 163 (1974).
- [20] Spoelstra T.A.T., Astr. Astrophys. 135, 238 (1984).
- [21] Veeraraghavan S., Davies R.D., Particle Physics and the Early Universe eds. Bately R., Jones M.E., Green D.A., (CUP, 1997).
- [22] Verschuur G.L., Kellermann K.I., Galactic and Extragalactic Radio Astronomy, (Springer-Verlag, Berlin,1988).