Unveiling the nature of the Cloverleaf lens-system: HST/NICMOS-2 observations ††thanks: Based on observations obtained with the NASA/ESA Hubble Space Telescope, obtained from the data archive at the Space Telescope Institute. STScI is operated by the Association of Universities for Research in Astronomy, Inc. under the NASA contract NAS 5-26555.
Abstract
We present new elements in the identification of the lens-system producing the 4 images of the BAL quasar H1413+117, based on the recent HST/NICMOS-2/F160W observations. After a careful PSF subtraction of the 4 images of the quasar, the residual HF160W image reveals the presence of a faint object () within the region enclosed by the 4 quasar images. This object corresponds to a single galaxy: the primary lens of the lens-system. We also identify the galaxies around the Cloverleaf which had been proposed to belong to a galaxy cluster/group at high redshift (Kneib et al 1998): the other component in the lens-system that provides the additional “external” shear. For these galaxies, we have derived a likely redshift based upon their RF702W, IF814W and HF160W magnitudes. We find that most of them are consistent with belonging to a galaxy cluster/group with mean redshift . Furthermore we detect 2 very red objects (): the faintest one has no observed optical (RF702W and IF814W) counterpart, while the brightest has a predicted redshift around , and may be identified with one of the Cloverleaf absorbers. This gravitational-lens system constitutes an excellent target for IR imaging/spectroscopy with the new generation of 8m ground-based telescopes.
Key Words.:
gravitational lensing - clusters of galaxies - gravitational lensing: Cloverleaf (H1413+117) -1 Introduction
The excellent quality and broad wavelength coverage of current observations of gravitational lensing systems have allowed to unveil part of their mysteries. The primary lens is often detected. The immediate surrounding of the multiply imaged quasars/galaxies is studied in great detail and generally shows some galaxy clustering (e.g. Tonry 1998, Hjorth & Kneib 1998) or even sometimes X-ray cluster emissions (Hattori et al 1997, Chartas et al 1998). Furthermore, the measure of a time-delay in Q0957+561/PG1115 (Kundic et al 1997, Schechter et al 1997) has strengthened the interest of a detailed study of these gravitational lens systems in order to use them as a cosmological tool.
Since the identification by Magain et al (1988) of the quadrupole lens-system called the Cloverleaf, 4 images of the BAL quasar H1413+117 at z=2.558, many efforts have been dedicated to a direct search of the lens or of elements of the lens-system. Early models of the lens-system have involved one or two galaxy-lenses very close to the line-of-sight toward the quasar (Kayser et al, 1990). A more recent analysis showed that an external shear was needed to model this system correctly (Keeton, Kochaneck & Seljak 1997), and indeed it is probably related to the existence of an overdensity of galaxies nearby, as detected by Kneib et al (1998).
The lensing geometry, amplification and time-delays are quite sensitive to the parameters of the galaxy-lens expected to be located amid the 4 images of the quasar. A positive detection of the galaxy-lens would bring stringent constraints in the modeling of the lens-system. However, despite relatively deep searches, either in R and I imaging with the HST (Turnshek et al, 1997; Kneib et al, 1998) or K imaging with the Keck telescope (Lawrence et al 1996), the lensing galaxy has not been detected.
The galaxy cluster recently revealed near the Cloverleaf (Kneib et al, 1998) was assumed to be at as this corresponds to the mean value of the narrow absorption line-systems observed in the quasar spectra (z=1.44, 1.66, 1.87, 2.07 and 2.09: Turnshek et al, 1988; Magain et al, 1988, Monier et al 1998). Combining the IR image with the RF702W and IF814W WFPC-2 images of this system can allow to estimate the likely redshift for the faint galaxies surrounding the Cloverleaf. The recently acquired HST/NICMOS-2/F160W observation consists of a unique dataset to help answer both the existence of the lensing galaxy and to constrain the distance of the nearby galaxies.
The HST/NICMOS-2 data are presented in Sect.2, while in Sect. 3 we discuss the identification of the lensing galaxy after the PSF subtraction of the 4 quasar images. The redshift estimates (derived from photometry) of the surrounding galaxies are explained in Sect.4. The discussion and concluding remarks are provided in Sect.5. Throughout this paper we use 50 km/s/Mpc and 1.
2 The HST/NICMOS-2 data
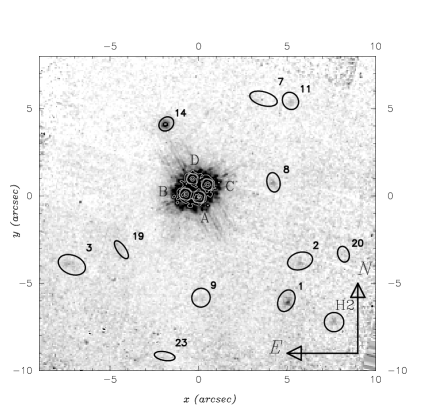
We retrieved the NICMOS-2/F160W observations of the Cloverleaf which do not hold proprietary rights from the HST/STSci archive: http://archive.stsci.edu/cgi-bin/hst. These data are part of a much larger dataset (PI: E. Falco) with the goal of studying the statistical properties of a sample of gravitational lens systems. The Cloverleaf data were taken on December 28, 1997 with a total exposure time of 4640 seconds. At the date of the observations, the NICMOS-2 pixel size (x,y) was 0.07603” x 0.07534” (c.f. the NICMOS instrument WEB-page). The NICMOS data come in 3 different formats: raw (files *_raw.fits), calibrated (files *_cal.fits) and mosaiced (files *_mos.fits). The raw data set is made of 4 sets of 19 rasters. The calibrated data correspond to 4 flux calibrated images, each being a combination of the 19 flat-field corrected images. We made our own mosaiced image by combining the 4 flux calibrated images shifted with a non-integer number of pixels (Figure 1). The image quality measured on the final mosaiced image is 0.145” (FWHM).
The photometric calibration in the Vega system was determined from the PHOTNU image keyword following the NICMOS handbook recipe (PHOTNU=2.3857 10-6). The software SExtractor 1.2 (Bertin & Arnouts 1996) was used to detect and to derive the photometry of faint sources, the detection parameters used are: 15 contiguous pixels over 1.5 of the sky-background after a convolution with a 33 top-hat filter. Photometry and position relative to the brightest quasar image (A) of the different objects is summarized in Table 2.
3 The 4 quasar images and the primary galaxy-lens
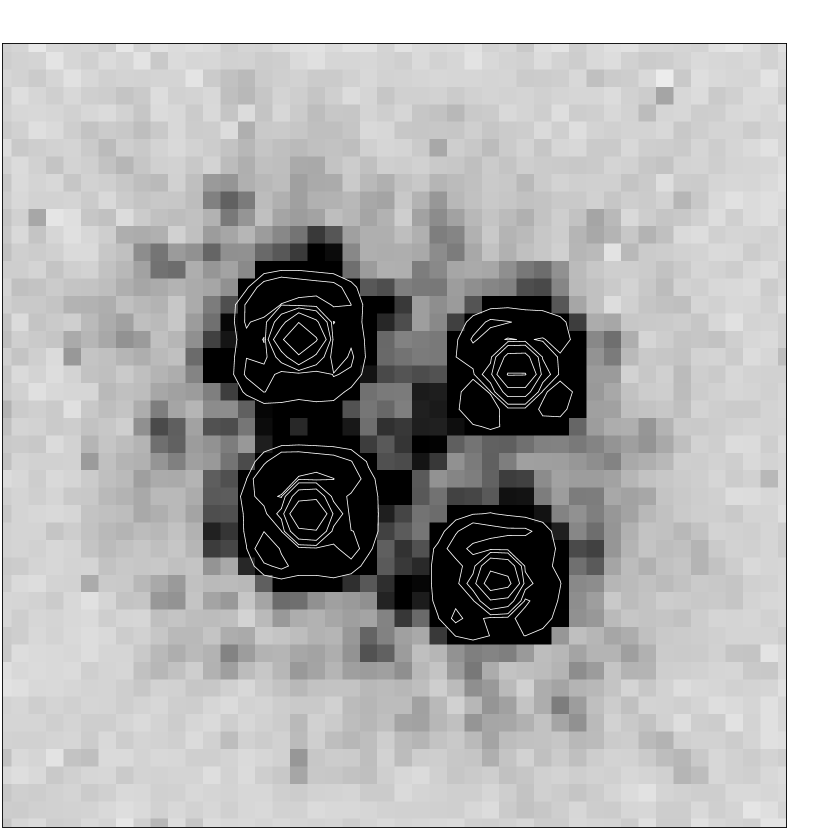
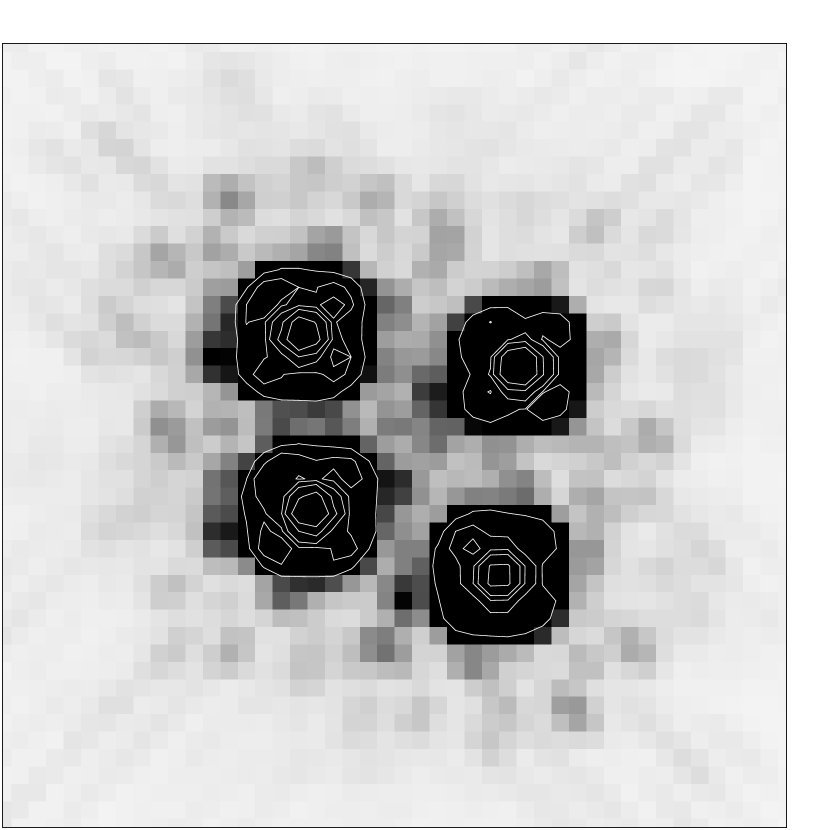
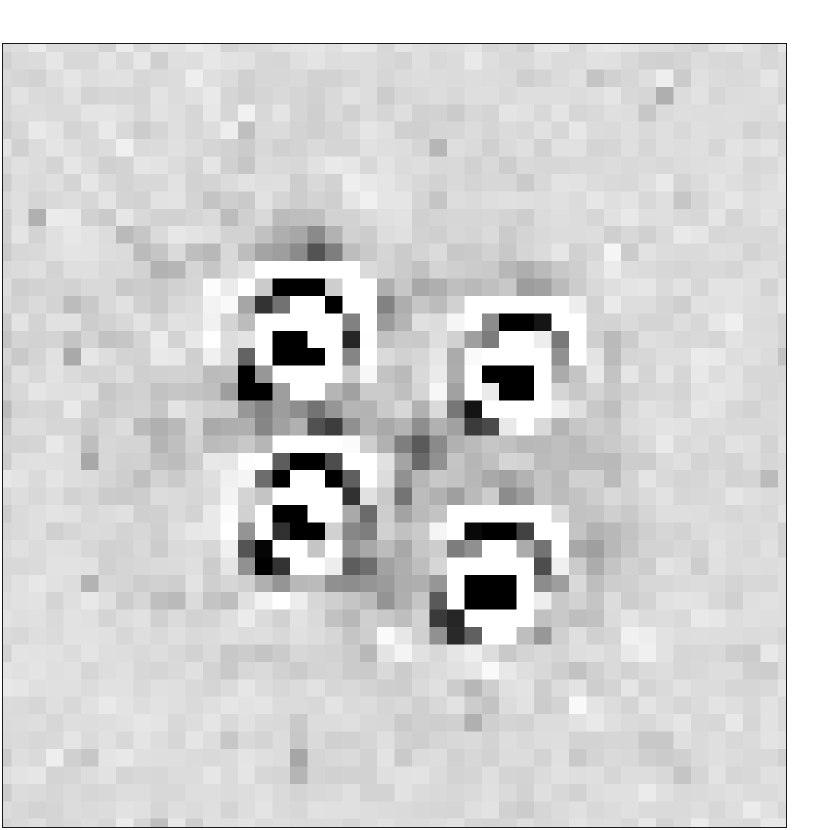
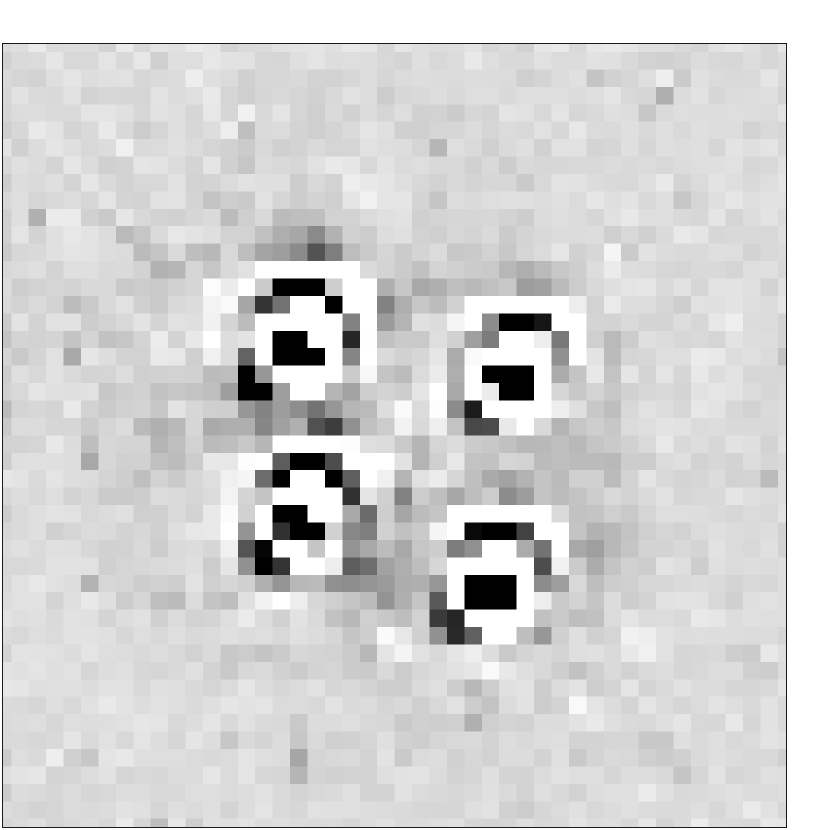
In order to reveal the primary galaxy-lens amid the 4 quasar images, we have subtracted modeled PSFs of the NICMOS-2 camera. We used the TinyTim V4.4 software (Krist & Hook 1997) to model the NICMOS-2 PSF through the F160W filter (assuming a flat spectrum for the quasar through this waveband) at each of the 4 positions of the quasar images and in each of the 4 calibrated frames. We oversampled the PSF with 88 subpixels per NICMOS-2 pixel (in order to sample correctly the PSFs and position them accurately). The positions of the 4 images of the Cloverleaf given in Turnshek et al (1997) were used for the PSF subtraction (we also independantly fitted the position directly from the NICMOS image but it did not improved the substraction), while the flux ratios were adjusted in order to minimize the mean residuals at the 4 quasar image locations. This procedure was applied to each of the 4 calibrated images, allowing us to derive the magnitudes and flux ratios of the 4 quasar images in HF160W (Table 1), and it also gives independant errors on the photometry of the different images. We found systematic residual patterns for each of the 4 PSF-substracted quasar images – as it can be seen in Figure 2 – but these patterns do not corresponds to the location of the detected lensing galaxy. Hence we could not check for the existence of an Einstein ring. Flux ratios in H differ significantly from the ones in UF336W, RF702W and IF814W, particularly for image D. As proposed by Turnshek et al (1997), dust extinction can easily explain the different flux ratios. However microlensing on the D image is also very likely, as it is the closest image to the detected lensing-galaxy.
In order to quantify the magnitude and position of the galaxy-lens, we assume that its profile follows a de Vaucouleurs law and we include it in the fitting of the PSF subtraction. Parameters were chosen in order to be left with a mean sky value similar to the median sky value. However we could not constrain the structural parameters of the galaxy-lens due to poor signal to noise. Figure 2 exhibits the different steps in the subtraction procedure. Note that the galaxy-lens, , is clearly detected even on the non-PSF subtracted image. Its position and HF160W magnitude are given in Table 2. Unfortunately, we can only get lower limits to its RF702W and IF814W magnitudes, preventing us from deriving a redshift constraint for H1.
| ID | UF336W | RF702W | I814W | H160W | ||
|---|---|---|---|---|---|---|
| (”) | (”) | 94/12/23 | 94/12/23 | 94/12/23 | 97/12/28 | |
| A | 0.000 | 0.000 | 18.95 | 17.68 | 17.45 | 15.67 |
| B | 0.744 | 0.172 | 19.31 [0.73] | 17.82[0.88] | 17.58[0.89] | 15.76[0.92] |
| C | -0.491 | 0.716 | 19.93 [1.01] | 17.95[0.77] | 17.73[0.76] | 14.03[0.71] |
| D | 0.355 | 1.043 | 19.13 [0.85] | 17.97[0.74] | 17.81[0.70] | 14.29[0.57] |


4 The environment of the Cloverleaf: photometric redshifts of the faint objects in the field
| ID | I814W | RF702W I814W | H160W | Comments | ||||
|---|---|---|---|---|---|---|---|---|
| (”) | (”) | max | ||||||
| H1 | 0.12 | 0.50 | 22.5 | R 22.7 | 20.50.7 | – | – | the position accuracy is 0.04 arcsec |
| H2 | -7.6 | -7.2 | 24.8 | R 25.5 | 21.60.7 | – | – | very red, only detected in H. |
| 1 | -7.3 | -2.1 | 22.52 | 0.72 | 20.70.3 | 0.8 | 0.6-1.1 | E/S0 morphology |
| 2 | -5.5 | -3.7 | 23.11 | 0.86 | 22.30.9 | 0.9 | 0.8-1.0 | |
| 3 | -0.6 | 8.2 | 23.16 | 0.88 | 22.00.5 | 0.9 | 0.8-1.0 | disturbed morphology |
| 7 | 3.9 | -5.5 | 23.75 | 0.74 | 22.3 | 0.9 | 0.5-1.2 | |
| 8 | -0.7 | -4.1 | 23.78 | 1.16 | 21.80.5 | 1.0 | – | solution at confidence level |
| 9 | -5.2 | 2.2 | 23.94 | 0.12 | 22.3 | – | – | no constraint |
| 11 | 3.2 | -6.8 | 24.01 | 1.09 | 22.30.8 | 1.0 | 0.7-1.2 | |
| 14 | 4.7 | 0.2 | 24.37 | 1.1 | 20.00.2 | 2.0 | 1.8-2.7 | very red, possibly associated with absorbers |
| 15 | -2.2 | -7.8 | 24.41 | 1.05 | 22.3 | 0.8 | 0.6-1.2 | |
| 19 | -0.9 | 5.3 | 24.74 | 0.88 | 22.3 | 1.0 | 0.5-1.5 | |
| 20 | -6.1 | -6.1 | 24.78 | 0.7 | 22.3 | 1.1 | 0.2-1.6 | is poorly determined |
In the field-of-view covered by the HF160W image, we identify 12 faint objects for which we can provide at least one of the RF702W, IF814W or HF160W magnitude [in addition to H1]. Among these objects, 11 have been identified by Kneib et al (1998). Another one, called H2, was not detected either on the RF702W or IF814W images. All these objects are shown on Figure 1. Their positions with respect to the quasar image A are given in Table 2, as well as their RF702W, IF814W and HF160W magnitudes.
We have estimated the redshift of these objects from their RF702W, IF814W and HF160W magnitudes, according to the standard minimization method described by Miralles & Pelló (1998). The updated Bruzual & Charlot evolutionary code (Bruzual & Charlot, 1993) was used and 5 different synthetic star-formation rates (SFR) tested: a 0.1 Gyr burst, a constant SFR, and 3 models (e-decaying SFR) with characteristic decay-time matching the sequence of colors for E, Sa and Sc galaxies. For each SFR type, 51 template spectra were selected with different stellar population ages. We also tested the stability of our results against different values in the galaxies. The template database includes 255 solar metallicity spectra.
We have analyzed through simulations the accuracy and the possible biases affecting the redshift estimate from the photometry. For this purpose, a simulated catalogue of galaxies was created, with redshifts uniformly distributed between 0 and 6, and randomly sampling the SFR and ages. Photometric errors ( uncorrelated for the different filters) were introduced as gaussian noise distributions with FWHM chosen so as to match the typical values for the Cloverleaf galaxy sample. According to these simulations, the use of the RF702W, IF814W and HF160W filters does not introduce any systematic bias in the redshift determination for .
The most probable redshift was obtained for each object, as well as its probability (in the sense of ) as a function of redshift (Table 2). We find that 9 objects have a redshift between 0.8 and 1.1, with . Most of these objects are well fitted by a 1 to 2 Gyr burst models and . The IF814W filter maps the B restframe at . The absolute magnitudes of these galaxies are -21-19.
For 4 objects (including the galaxy-lens H1 and the very red object H2) the redshift is poorly determined. The objects #14 and H2 are extremely red in (IF814W-HF160W) and are consistent with galaxies at redshift 2 or higher. For object #14, the best-fit model (without reddening), is a 2.5 Gyr burst, which, given the redshift uncertainty, leads to to . This high luminosity may suggest that object #14 might as well be gravitationally amplified by the cluster-lens with .
The photometric redshifts were computed using a solar metallicity. This is a fair approximation as, for 12 and the filters considered in this analysis, the results are rather unsensitive to metallicity. Furthermore, the estimated redshifts given in Table 2 are insensitive to a reddening . If the reddening is much higher, the estimated redshift would shift toward a lower value. However there is no reason to believe that all objects in the Cloverleaf field should be highly reddened. The dispersion is high, however, as reflected in the large interval at the 75% confidence level (Table 2); it is therefore important to effectively measure the redshift of the brightest objects to validate this conclusion.
5 Discussion and concluding remarks
Two main results have been obtained from the NICMOS-2 data. For the first time the galaxy-lens, H1, close to the line of sight toward the quasar, has been identified. Its position with respect to the quasar line-of-sight is found to be similar (within the uncertainties) to the one derived in the various Cloverleaf gravitational lens models (e.g. Kneib et al, 1998). It remains difficult to estimate the redshift of the galaxy-lens H1 because the PSF subtraction leaves an increased background noise in the region amid the 4 quasar images. Yet, a redshift estimate around 1.0 or higher is consistent with the HF160W magnitude and the IF814W lower limit magnitude we have derived for H1. Clearly deep spectroscopic data are needed to solve for the determination of its redshift. We find also that there is a unique galaxy-lens, in contradiction to some early models in which two galaxy-lenses had been envisaged (Kayser et al, 1990). Assuming that H1 is around , and has similar colors and absolute magnitude than the nearby galaxies gives a Mass-to-light ratio of M(kpc)/LB 25 M/LB⊙.
With regard to the Cloverleaf environment, we show that 8 nearby galaxies have a most probable redshift around 0.9, giving credit to the presence of a galaxy cluster/group along the line of sight to the Cloverleaf. In our previous modelling (Kneib et al, 1998), we assumed for this galaxy cluster/group a redshift of 1.7, as a mean of the redshifts of the 4 absorbers silhouetted on the quasar spectrum. This value should be revised. The location of the galaxy-lens is now known from the NICMOS-2 observations and will be implemented in a new model of the lens-system. One of the faint galaxies surrounding the Cloverleaf appears to be at a larger redshift, around 2, and might be related with the absorber at z2.07 or 2.09 (Monier et al 1998). Further IR imaging/spectroscopy of these galaxies should remove the remaining uncertainties of the Cloverleaf lens-system.
Acknowledgements.
We would like to thank G. Bruzual for allowing the use of his code as well as for useful discussions on photometric redshifts. Many thanks, to Jens Hjorth for a careful reading of this manuscript and fruitful discussion on lensing and other topics. DA wishes to thank Observatoire Midi-Pyrénées for hospitality.References
- (1) Bertin, E., Arnouts, S. 1996, A&AS 117, 393.
- (2) Bruzual, G., Charlot, S. 1993, ApJ 405, 538.
- (3) Chartas, G., Chuss, D., Forman, W., Jones, C., Shapiro, I., 1998, ApJ in press, astro-ph/9803285.
- (4) Hattori, M., Ikebe, L., Asaoka, I., Takeshima, T., Böhringer, H., Mihara, T., Neumann, D.M., Schindler, S., Tsuru, T., Tamura, T., 1997, Nature 388, 146.
- (5) Hjorth, J., Kneib, J.-P. 1998, ApJ submitted.
- (6) Kayser, R.,Surdej, J., Condon, J., et al 1990, ApJ 364, 15.
- (7) Keeton, C. R., Kochanek, C. S., Seljak, U. 1997, ApJ 482, 604.
- (8) Kneib J.P., Alloin D., Mellier Y., Guilloteau S., Barvainis R., Antonucci R., 1998, A&A 329, 827
- (9) Krist, J. & Hook, R., 1997, The Tiny Tim User’s Guide (http://scivax.stsci.edu/ krist/tinytim.html)
- (10) Kundic, T., Turner, E.L., Colley, W.N., et al, 1997, ApJ 482, 75.
- (11) Lawrence, C. R. 1996, in “Astrophysical Applications of Gravitational Lensing”, eds. C. Kochanek & J. Hewitt, Kluwer, p. 209.
- (12) Magain, P., Surdej, J., Swing, J.-P., Borgeest, U., Kayser, R., Kühr, H., Refsdal, S., Remy, M. 1988, Nature 334, 325.
- (13) Miralles J.M., Pelló, R., 1998, ApJ submitted (astro-ph/9801062).
- (14) Monier, E.M., Turnshek, D.A., Lupie, O.L., 1998, 496, 177.
- (15) Schechter et al, 1997, ApJL, 475, 85.
- (16) Tonry J.L, 1988, AJ, 115, 1.
- (17) Turnshek D.A, Foltz C.B., Grillmair C.J., Weyman R.J., 1988, ApJ 325, 651
- (18) Turnshek D.A, Lupie O.L, Rao S.M., Espey B.R., Sirola C.J., 1997, ApJ 485, 100