Turbulence in the Ursa Major cirrus cloud
Abstract
High resolution 21 cm observations of the Ursa Major cirrus revealed highly filamentary structures down to the 0.03 pc resolution. These filaments, still present in the line centroid map, show multi-Gaussian components and seem to be associated with high vorticity regions. Probability density functions of line centroid increments and structure functions were computed on the line centroid field, providing strong evidences for the presence of turbulence in the atomic gas.
1 Introduction
Many statistical studies of the density and velocity structure of dense interstellar matter have been done on molecular clouds where turbulence is seen as a significant support against gravitational collapse that leads to star formation. Less attention has been devoted to turbulence in the Galactic atomic gas (HI). The cold atomic component ( K, cm-3), alike molecular gas, is characterized by multiscale self-similar structures and non-thermal linewidths.
A detailed and quantitative study of the turbulence and kinematics of HI clouds has never been done. Here we present a preliminary analysis of this kind based on high resolution 21 cm observations of an HI cloud located in the Ursa Major constellation. To characterize the turbulent state of the atomic gas, a statistical analysis of the line centroid field has been done. We have computed probability density functions of line centroid increments and structure functions.
2 HI Observations
The Ursa Major cirrus () has been observed with the Penticton interferometer. Half of these data has already been published by Joncas et al. (1992). A total of 110500 spectra were taken on a field (1’ resolution) with a spectral resolution of km s-1. This cirrus is part of a large loop of gas, possibly blown by stellar winds and/or supernovae explosions, known as the North Celestial Loop. A distance of 100 pc is adopted ([de Vries et al. 1987]).
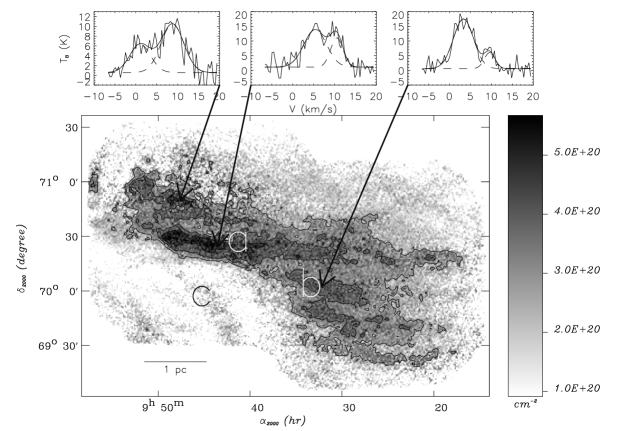
The integrated intensity map, proportional to the column density, is shown in figure 1; many filamentary structures are apparent. The filaments stand out in individual channel maps and most of them can be followed over several channels. The strongest filament (a on figure 1) crosses most of the field in an east-west direction. There are also two fainter filamentary structures (b and c) that seem to merge (in spatial and velocity space) in the brighter part of filament a. A closer look at these filaments in individual channel maps reveals smaller elongated substructures, parallel to the main axis.
We performed a multi-Gaussian fit on each spectrum and found that most spectra are fitted by one or a combination of two Gaussians of typical velocity dispersion km s-1 . The smallest velocity dispersion measured ( km s-1 ) is located in the northern part of filament c. If this width were purely thermal it would correspond to a kinetic temperature of 200 K. The spectra along filament a are composed of two Gaussian components (see central spectrum on figure 1). These two components are separated by km s-1 all along the filament except in the eastern end where they merge. At this position we observe a clear velocity gradient (10.0 km s-1 per pc) across filament a. These two observational facts may be interpreted as a rotation in the plane of the sky, along the major axis of the filament. Assuming the filament is a cylinder, its radius is pc. Then, the turnover time (), calculated from both behaviours (component separation and velocity gradient) is year.
3 Statistical analysis of the line centroid map
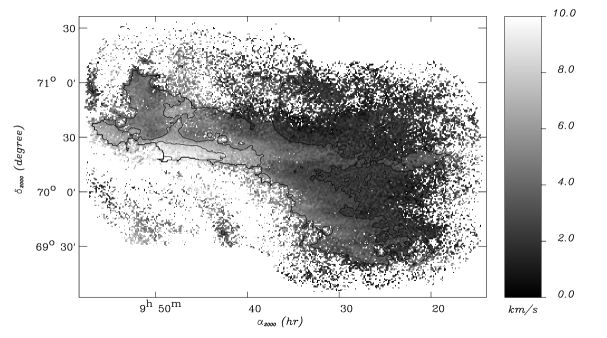
Figure 2 displays the map of the line centroid (). On large scales, the line centroid field is characterized by a global east-west velocity gradient. On small scales, we note a significant difference between the eastern part (particularly near ) which shows velocity fluctuations on scales of a few arcminutes and the western part which is very smooth at those scales. The brighter part of filament a as well as filament b and c clearly stand out as coherent structures in the centroid map.
3.1 Probability Density Function of velocity increments

Probability density functions (PDF) of velocity increments and derivatives found in experiments and numerical simulations of turbulent flows usually show clear non-Gaussian wings. This non-Gaussian behaviour is attributed in part to coherent vortex structures ([Sreenivasan & Antonia 1997]). In astrophysical context, non-Gaussian wings were observed by [Falgarone & Phillips (1990)] in molecular line profiles of selected molecular clouds. Recently, [Lis et al. (1996)] showed that PDFs of line centroid velocities increments (i.e. PDF of ) computed from numerical simulations of compressible turbulence at high Reynolds number have non-Gaussian wings.
Using the line centroid map shown in figure 2 we computed PDF of velocity increments for 5 and 50 pixels lags. As shown in figure 3, non-Gaussian wings are clearly present in the Ursa Major cirrus. Furthermore, exponential wings are stronger at small lag. This is a behaviour typical of intermittency also observed in three dimensional simulations of turbulence and in laboratory experiments ([Sreenivasan & Antonia 1997]). The points that populate the non-Gaussian wings are essentially located along filaments a, b and c, and in the north-eastern part of the field. In their analysis [Lis et al. (1996)] showed a clear spatial correlation between the non-Gaussian events and regions of high vorticity.
3.2 Structure Functions
Structure functions (SF) of various orders () are extensively used to deduce physical parameters of turbulent flows ([Anselmet et al. 1984]). Second and third order SF were computed from the line centroid map. The large number of velocity points used here allows us to separate spatially our sample in two equal parts (east and west). We found a significant difference between the eastern and western SFs.
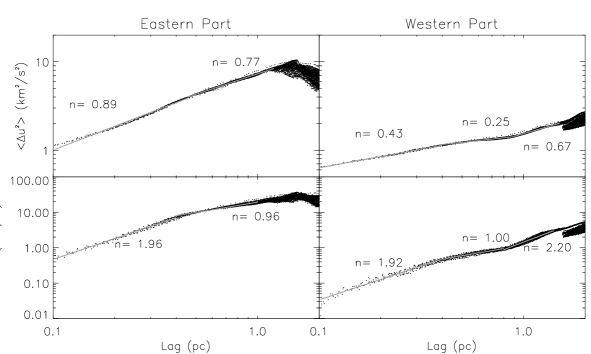
In the inertial sub-range of a Kolmogorov type turbulence, the exponent of the second and third order SF should be respectively 2/3 and 1. Here, as seen in figure 4, the second order SFs are very smooth and show various exponents (from to ) on different scales and locations. The second order SFs drop near 1.5 pc; this may be caused by the poor statistics we have at large scale. The third order SFs are also very smooth. The exponents range from to .
From 0.4 pc to 1.5 pc, the eastern part of the line centroid field is characterized by slopes of and , and seems to meet the Kolmogorov type description for which the third order SF has an exact solution:
where is the mean energy transfer rate in the inertial range. This rate can be computed for the eastern part of the field: erg s-1 g-1. On a small lag range (from 0.4 pc to 0.8 pc) we also observed an exponent of 1 in the western third order SF, giving which is significantly smaller than the eastern value.
4 Discussion
The previous statistical analysis supports the presence of turbulence in the Ursa Major cirrus. The various observational results shown here (the presence of clearly non-Gaussian wings in PDFs of line centroid velocity increments and the slopes of the structure functions) are recognized as signatures of turbulence in terrestrial experiments or numerical simulations. On the other hand, astrophysical observations lack three dimensions in phase space; any detailed comparison with numerical simulations or laboratory results must be done with great caution. Here the 3D geometry of the cloud is unknown, it is thus premature to interpret further the various SFs’ exponents.
Numerical simulations and laboratory experiments of turbulent flows are also characterized by filamentary vortical structures and dissipative sheets around them ([Sreenivasan & Antonia 1997]). These highly localized dissipative regions may play an important role in the thermodynamics and chemical evolution of the interstellar medium ([Falgarone & Puget 1995]). Identifying such regions would be of considerable astrophysical interest. The present study of high resolution 21 cm observations reveals filamentary HI structures characterized by doubled-peak spectra and minor axis velocity gradient. These features may be interpreted as a rotation around the major axis of the filament. Furthermore, the main filaments observed here are associated with high vorticity zones traced by the PDF of velocity increments.
The filaments we have observed in the Ursa cloud cannot be the coherent vortices which develop at scales close to the dissipation scale of turbulence because the linear resolution of our observations (0.03 pc) is more than 100 times larger than the dissipation scale in diffuse clouds (see Falgarone, these proceedings). Instead, we may be observing a larger structure, made of very small vortices, braided together, as the result of their interaction and merging. This merging of small vortices into larger vortices has been followed in the numerical simulations of Vincent and Meneguzzi (1994) and Porter et al. (1994). This would explain why the velocity pattern is more complex than a simple rotation.
References
- Anselmet et al. 1984 Anselmet, F, Gagne, E, & Hopfinger, E. 1984 High-order velocity structure functions in turbulent shear flows. J. Fluid Mech., 140, 63.
- de Vries et al. 1987 de Vries, H. W, Thaddeus, P, & Heithausen, A. 1987 Molecular and atomic clouds associated with infrared cirrus in Ursa Major ApJ, 319, 723.
- Falgarone & Phillips (1990) Falgarone, E & Phillips, T. G. 1990 A signature of the intermittency of interstellar turbulence - The wings of molecular line profiles. ApJ, 359, 344.
- Falgarone & Puget 1995 Falgarone, E & Puget, J. L. 1995 The intermittency of turbulence in interstellar clouds: implications for the gas kinetic temperature and decoupling of heavy particles from the gas motions. A&A, 293, 840.
- Joncas et al. 1992 Joncas, G, Boulanger, F, & Dewdney, P. E. 1992 A high-resolution 21 centimeter line study of infrared cirrus. ApJ, 397, 165.
- Lis et al. (1996) Lis, D. C, Pety, J, Phillips, T. G, & Falgarone, E. 1996 Statistical Properties of Line Centroid Velocities and Centroid Velocity Increments in Compressible Turbulence. ApJ, 463, 623.
- Porter, D. H., Pouquet, A. & Woodward, P. R. 1994 Kolmogorov-like spectra in decaying three-dimensional supersonic flows. Phys. Fluids, 6, 2133.
- Sreenivasan & Antonia 1997 Sreenivasan, K. R & Antonia, R. A. 1997 The phenomenology of small-scale turbulence. Annual Review of Fluid Mechanics, 29, 435.
- Vincent & Meneguzzi (1994) Vincent, A & Meneguzzi, M. 1994 The dynamics of vorticity tubes in homogeneous turbulence. J. Fluid Mech., 258, 245.