X-RAY EMISSION FROM A RADIO HOTSPOT IN 3C 390.3:
Evidence for the Deflection of a Radio Jet by a Neighboring Galaxy
D. E. Harris, Center for Astrophysics, 60 Garden St., Cambridge, MA 02138 USA, harris@cfa.harvard.edu
K.M. Leighly, Columbia Astrophysics Laboratory, 550 West 120th St., New York, NY 10027 USA, leighly@ulisse.phys.columbia.edu
J.P. Leahy, University of Manchester, Nuffield Radio, Astronomy Laboratories, Jodrell Bank, Macclesfield, Cheshire, SK11 9DL, England, jpl@jb.man.ac.uk
Abstract
By summing a large number of ROSAT High Resolution Imager (HRI) observations of the variable radio galaxy 3C 390.3, we demonstrate that the X-ray emission associated with the northern radio lobe (reported by Prieto 1997) can be identified with hotspot B. None of the other hotspots have been detected. We present evidence that the anomalous X-ray emission is the consequence of a strong shock produced where the northern radio jet impinges onto an external galaxy.
Subject headings: galaxies: active — galaxies: individual (3C 390.3) — galaxies: jets — radiation mechanisms: non-thermal — radio continuum: galaxies
1 Introduction
Very few radio hotspots in extragalactic sources have been detected in the optical, and fewer still have been seen in the X-ray band. The problems posed by X-ray detection of radio features such as jets and hotspots is of particular interest because the various emission models used to explain them provide constraints on the physical parameters of the sources beyond those normally obtainable from radio data alone. The synchrotron model for knot A in the M87 jet requires electrons with Lorentz energy factors, and, for the equipartition magnetic field strength, a half-life 12 years (Biretta, Stern, & Harris 1991). The synchrotron self-Compton model for the hotspots of Cygnus A (Harris, Carilli, & Perley 1994) yielded an average magnetic field strength in agreement with the equipartition field (150 to 250 G), whereas the ’Proton Induced Cascade’ model (Mannheim, Krulls, & Biermann 1991) would require a much stronger B field, well in excess of 500 G.
Prieto (1997) reported the detection of an X-ray feature associated with the northern hotspots of 3C 390.3 with the ROSAT PSPC (11.5 ksec exposure, producing 80 net counts). Leahy and Perley (1995) presented VLA radio maps at 6 and 18cm, and we adopt their nomenclature for the radio features. Optical emission from hotspot B (HS B, hereafter) had been reported twenty years ago with a brightness of 25 B magnitudes arcsec-2 (Saslaw, Tyson, & Crane 1978) and Prieto and Kotilainen (1997) have obtained V, R, and I magnitudes. Keel and Martini (1995) presented an optical spectrum of a brighter object about 5 arcsec to the north, which they found to be consistent with the spectrum of a K4 (galactic) star. However, as Prieto (1997) points out, this object is outside HS B, and the astrometry rules this out as a candidate for optical emission from the hotspot; we show below that the object may be a member of a group of galaxies around 3C 390.3.
Leighly et al. (1997) report on a monitoring campaign of 3C 390.3 which involved a short observation with the ROSAT HRI every 3 days for 9 months. We have stacked these data to obtain an exposure time of 197 ksec, and find a 5 detection for HS B. In this paper we give the details of our measurements, consider various emission mechanisms, and discuss the relevance of the galaxy adjacent to HS B. What remains to be explained in detail is why HS B is detected in X-rays, but the other hotspots (with higher radio luminosity) are below our current X-ray detection limits.
2 The Observational data and astrometry
Leighly et al. (1997) report on the observational details. For their work on x-ray monitoring, all data intervals with excessively large background levels were rejected, but we accepted all data that were passed by the background rejection algorithms in the standard processing. We found that the resulting Point Response Function (PRF) as described by the highly variable x-ray core had a Full Width Half-Maximum (FWHM) size of 10′′ rather than the value of 5.5′′ obtainable for data with good aspect solutions. We tried shifting each observation interval to align the peak intensities but this did not appear to make a significant improvement.
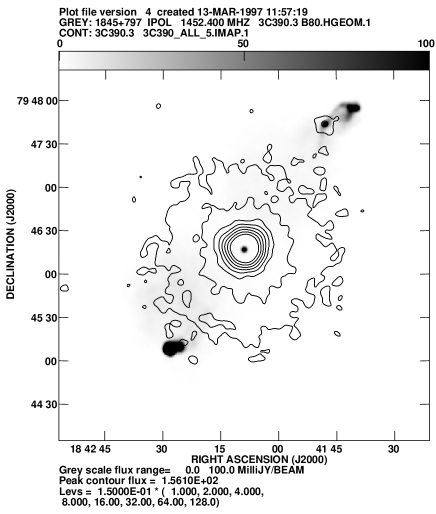
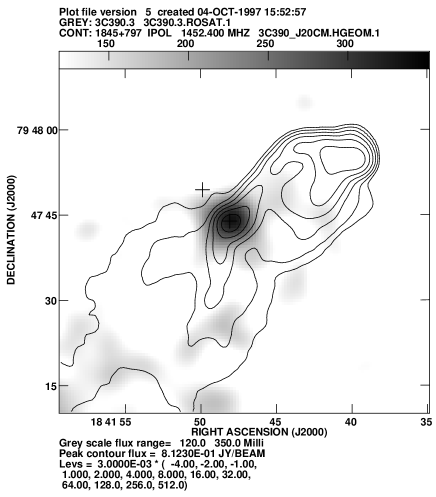
We then made a smoothed map using a Gaussian filter, precessed the VLA111The National Radio Astronomy Observatory is a facility of the National Science Foundation operated under cooperative agreement by Associated Universities, Inc. radio map to J2000, and shifted the X-ray map (less than 1 arcsec) so as to align the radio and X-ray peaks of the core. The results are shown in Figure 1. It can be seen that the optical position for the 19th magnitude object (which Keel and Martini described as a K4 star) is well outside the hotspot, whereas the X-ray emission is coincident with the radio emission.
3 Intensity Measurements
Because of the large ’beam size’ of the ROSAT HRI, we can measure only three distinct hotspots: North preceding (Np) encompasses A, F, and N4 of Leahy and Perley (1995), and South following (Sf) which consists of D, E, G, and the “tail” (ibid.). Note that radio features “N1” and “N2” are located within the measuring aperture of the HRI for HS B, but there is no evidence that they contribute to the observed X-ray emission (Figure 1b).
The X-ray intensities of hotspots Np and Sf were measured with a circular aperture of radius 10′′ and a background annulus from 11′′ to 17′′. Both values were slightly negative; their entries in Table 1 are 2 upper limits.
The X-ray intensity of HS B was estimated by measuring the net count rate in a circle of radius 10′′, with a 10% scattering correction. Background estimates were obtained from annuli centered on the hotspot position with inner and outer radii of 11′′ to 17′′, 12′′ to 20′′, and 20′′ to 30′′. The final countrate is 5 counts s-1 (with a 1 uncertainty of 20%).
The countrate was converted to flux via the task ’hxflux’ in IRAF/PROS. We assumed a power law spectrum (flux density, S ) with = 0.8 and the Galactic value of log NH = 20.62. The final value is 2.9 erg cm-2 s-1 for the 0.1 to 2.4 keV ROSAT bandpass. Note that this value is significantly lower than that published by Prieto (1997): S(1keV) = 13 4 nJy compared to our value of 4.2 0.8 nJy. The actual measuring aperture used by Prieto for the 80 net counts found for the ’northern extension’ on the PSPC map was not given so we cannot make a corresponding measurement on the HRI map.
| Table 1. Optical and X-ray Flux Densities of the Hotspots | ||||||
| Feature | RA | DEC | Apert. | log | log S | +/- |
| (J2000) | Size | (Hz) | (cgs) | |||
| HS Np | 18 41 39.84 | 79 47 54.7 | r=1′′ | 14.5823 | -28.848 | |
| r=10′′ | 17.383 | -31.837 | ||||
| HS B | 18 41 48.05 | 79 47 43.6 | r=1′′ | 14.5823 | -28.488 | 0.16 |
| r=1′′ | 14.6536 | -28.667 | 0.12 | |||
| r=1′′ | 14.740 | -28.736 | 0.16 | |||
| … | 14.834 | -29.097 | 0.3 | |||
| r=10′′ | 17.383 | -31.377 | 0.09 | |||
| HS Sf | 18 42 28.54 | 79 45 06.9 | r=10′′ | 17.383 | -31.837 | |
Notes to Table 1:
The cgs units for the flux density column are erg cm-2 s-1 Hz-1. The error on our X-ray measurement is 1 . The optical B band is taken to be centered at Hz. 1 keV corresponds to 2.418 Hz. The optical flux densities with r=1′′ apertures are based on the magnitudes published by Prieto and Kotilainen (1997). Note that since we do not know the effective bandwidths of their filters, the conversion to flux density (based on standard filters) may not be precise.
For the optical intensity, we estimated a flux density from the published remarks of Saslaw et al. (1978). Since they only quote a value of 25 B magnitudes per square arcsec, we have taken the uncertainty to be that found by using integration areas of 1 to 3 square arcsecs. Conversion to flux density followed the standard prescriptions and no reddening corrections were used. The magnitudes given by Prieto and Kotilainen (1997) were also converted to flux densities with the usual factors (see notes to Table 1).
| Table 2. Peak Radio Flux Densities for the Hotspots | |||||
|---|---|---|---|---|---|
| Freq. | Beamsize | VLA | HS A | HS B | Sf |
| (arcsec) | config. | (mJy/b) | (mJy/b) | (mJy/b) | |
| 1.5 GHz | 2.8 | A+B+C | 166.6 | 163.4 | 815.1 |
| 5.0 GHz | 2.8 | B+C+D | 62.4 | 66.6 | 346.9 |
| 8.3 GHz | 2.8 | C+D | 44.4 | 49.2 | 246.4 |
| 4.8 GHz | 0.33 | A | 2.3 | 7.5 | 33.3 |
Notes to Table 2:
Uncertainties in the flux densities are generally dominated by the overall flux calibration and are estimated to be 5%.
’Sf’ denotes ’South following’ and includes hotspots D, E, and G. At 0.33′′ resolution, these hotspots are separable and their peak flux densities are 21.0, 33.3, and 7.1 mJy, respectively. Also at this resolution, hotspot F is distinct from HS A, and has a peak value of 1.1 mJy.
Comparative radio flux densities are more difficult to measure because the high brightness features of hotspot B are surrounded by lower brightness areas which probably do not contribute to the observed optical and X-ray emissions. In Table 2 we give peak values of flux density measured from VLA maps. The entries with the 2.8′′ beam size are a reasonable approximation to the total flux density of the hotspot because the brighter parts are essentially unresolved at this resolution.
The optical, X-ray, and 2.8′′ resolution radio flux densities are plotted in figure 2. The radio spectral indices of A, B, and SF are 0.77, 0.70, and 0.70, respectively. The radio/X-ray value for HS B is 0.95.

4 The X-ray Emission Mechanisms for Hotspot B
There are two obvious questions relating to the emission process of HS B: “Why is B detected whereas the (radio) brighter hotspots are not?” and “Does the external galaxy just to the north of HS B cause the radio jet to deflect, thereby engendering a shock capable of producing the extremely energetic electrons required to produce X-ray synchrotron emission in magnetic fields of order 50 G?”
Prieto and Kotilainen (1997) give an upper limit of for hotspot A and Saslaw et al. (1978) state that no optical emission is detected from the Np hotspot, but that the Sf hotspot location is somewhat contaminated by a nearby star. The radio spectrum of HS B is essentially identical to that of Sf; it is only in the optical and X-ray bands that HS B becomes exceptional.
We have also examined the radio surface brightnesses to see if there is any significant difference between HS B and the others. Although HS B is brighter than HS A at the best radio resolution (0.33′′), the southern hotspots are brighter than HS B.
4.1 Thermal Model
For an order of magnitude estimate of the physical parameters required to produce thermal bremsstrahlung emission, we take a uniform density gas with a volume equal to that of a sphere of radius 3′′ (characteristic of the ROSAT HRI point spread function). We find a required density of 0.07 cm-3; a total mass of 7 M⊙; a cooling time of 120 million years; and a pressure of 9 dyne cm-2. These values were derived for kT=4keV (4.4K); for gas temperatures significantly different than 4 keV, the density and total mass would have to be larger to produce the observed intensity. The pressure and cooling time increase for temperatures greater than 4 keV, but decrease for cooler temperatures.
We believe our astrometry is accurate to better than 1′′ and thus it appears highly probable that the X-ray emission arises from the same volume as the radio (and optical) emission. While one might expect a high density (thermal) gas to be associated with a shock front, there should then have been a clear offset between the radio and X-ray positions. Enhanced thermal emission would be expected to the Northwest of the sharp edge of the radio hotspot. Since high brightness radio features generally exclude ambient thermal material, the only geometry for a thermal origin of the X-rays would be that of a thin sheath surrounding the hotspot. We suspect that this situation is also untenable because of the absence of any Faraday effects. Figure 6 of Leahy and Perley (1995) shows that the rotation measure of hotspot B attains only very small values, consistent with those of the other hotspots. See also Harris et al. (1994) for a similar discussion on the hotspots of Cygnus A.
4.2 Synchrotron model
The synchrotron model is based on the coincidence of the optical and X-ray emitting volumes with that of the radio (fig 1b). Although it is obvious that a break in the spectrum is required, it is not known if this occurs at a relatively discrete frequency or if there is a more gradual curvature to the spectrum. For the purposes of estimating the usual synchrotron parameters, we assume that the spectrum can be described by a power law with = 0.70 between 0.1 and 10 GHz, and a second power law with = 0.95 between 10 GHz and Hz (4.1 keV). To obtain the magnetic field strength for minimum energy, we assume the emitting volume to be a cylinder with radius 0.5′′ and length 1.3′′ (estimated from the 5 GHz maps of Leahy & Perley 1995). The results are given in Table 3. None of these parameters are exceptional for radio hotspots; the short lifetime of the highest energy electrons is typical for any synchrotron model of X-ray emission.
| Table 3. Synchrotron Parameters | ||
|---|---|---|
| Magnetic field for minimum pressure, B(min) | 44 G | |
| Lorentz energy factor of electron emitting X-rays, (max) | 7.5 | |
| Halflife for (max) electrons in 44 G field | 57 yr | |
| Non thermal pressure, P(min) | 2dyne cm-2 | |
4.3 Synchrotron Self-Compton model
From the observed radio volume and spectrum, we calculate the photon energy density to be of order 10-12 erg cm-3 (the cosmic microwave background provides 4). For this estimate, we assume that the photon spectrum observed in the radio extrapolates up to Hz, thereafter dropping rapidly through the optical points. This together with the required electron spectrum for B(min) provides an estimate for Synchrotron Self-Compton (SSC) emission which is 3 orders of magnitude below that observed. Even if we have over estimated the volume by a considerable factor, it appears that the SSC model is untenable.
5 Discussion
There are two aspects of HS B which suggest that the existence of the hotspot at this location is caused by the external galaxy. We have obtained a 15 minute spectrum from the MMT (Blue channel; 300 line/mm, with a slit width of 1.5′′). Although the s/n is too low to allow a detailed analysis, the 4000 angstrom break is discernible and using the galaxy template method, a redshift of 0.0527 +/- 0.0003 is found. This value is about 840 km/s less than that of 3C 390.3 (z=0.0555, Eracleous & Halpern 1998) and demonstrates that the galaxy could be a member of the 3C 390.3 group. Leahy and Perley (1995) remarked that if this object were to be in the 3C 390.3 system, it would be a 0.03L* dwarf. Other probable members of the group are visible on the CCD image published by Baum et al. (1988). On that same CCD (Baum’s figure 51), this galaxy is in the upper right corner and appears to be resolved with a major axis in PA -35 degrees whereas the foreground stars all have circular contours. The deeper images published by Prieto and Kotilainen (1997) leave no doubt that the object is a galaxy and not a foreground star.
The second noteworthy feature of HS B is that the largest gradient in radio surface brightness occurs on the ’outside’ of the hotspot, i.e. that bordering the dwarf galaxy. This is similar to generic hotspot behavior and is in sharp contrast to the X-ray emitting knot A in the radio jet of M87 where the steep gradient occurs at the upstream edge, facing the nucleus. The best resolution radio map (0.33 arcsec beam at 6cm) currently available is that published in figure 12 of Leahy and Perley (1995) where it can also be seen that the magnetic field is well aligned along the outside edge of the hotspot.
If this scenario can be sustained, we suggest that the jet meets a higher density region (the ISM of the dwarf galaxy?) and is deflected by 40 deg (in projection). The resulting shock produces the characteristic randomization of the relativistic electrons leading to the radio hotspot. Similar behavior has recently been reported for 3C 34 (Best, Longair, & Röttgering 1997) and 3C 371 ( Nilsson et al. 1997).
6 acknowledgments
We thank J. Halpern for helpful discussions and Jane Dennett-Thorpe for the X- and C-band low-resolution images. H. Glasser, a Haverford College extern, participated in the initial stages of the X-ray reductions and evaluation. The optical observations reported in this paper were obtained at the Multiple Mirror Telescope Observatory, a joint facility of the University of Arizona and the Smithsonian Institution. It is a pleasure to thank J. Huchra, S. Tocarz, and J. Mader for assistance in reducing the MMT spectrum and P. Berlind for making the observation. This work was partially supported by NASA contract NAS5-30934.
7 references
Baum, S. A., Heckman, T., Bridle, A., van Breugel, W., & Miley, G. 1988, ApJS 68, 643
Best, P. N., Longair, M. S., & Röttgering, H. J. A. 1997, MNRAS 286, 785
Biretta, J.A., Stern, C.P., and Harris, D.E. 1991, AJ 101, 1632
Eracleous, M., & Halpern, J. P. 1998, in preparation
Harris, D. E., Carilli, C. L., & Perley, R. A. 1994, Nature 367, 713
Keel, W. C. & Martini, P. 1995, AJ 109, 2305
Leahy, J. P. & Perley, R. A. 1995, MNRAS 277, 1097
Leighly, K. M. et al. 1997, ApJ, 483, 767
Mannheim, K., Krulls, W. M., & Biermann, P. L. 1991, A&A 251, 723
Nilsson, K., Heidt, J., Pursimo, T., Sillanpää, A., Takalo, L. O. & Jäger, K. 1997, ApJ 484, L107
Prieto, M. A. 1997, MNRAS 284, 627
Prieto, M. A. & Kotilainen, J. K. 1997, ApJ 491, L77
Saslaw, W. C., Tyson, J. A., & Crane, P. 1978 ApJ 222, 435