X-Ray Observations of Radio Galaxies
Abstract
We review some of the ways that X-ray observations provide unique information on radio galaxies. Thermal bremsstrahlung X-ray emission provides detailed data on ambient densities and temperatures. These parameters in turn can be used for pressure balance calculations and can demonstrate how the ambient gas affects radio source structure. Additionally, many signatures of the interaction of radio jets and lobes with the hot gas are found in high resolution X-ray maps.
Non-thermal X-ray emission from knots and hotspots of radio jets can give us constraints on the relativistic electron population for energies greater that that normally sampled in the radio (in the case of synchrotron emission) or can give us an independent estimate of the average magnetic field strength (if inverse Compton emission is the origin of the X-rays). From recent ROSAT HRI observations of 3C 390.3 and 3C 120, we show evidence that X-ray emission from knots and hotspots appears to be associated with regions of large gradients in the radio surface brightness; i.e. at the location of powerful shocks.
Smithsonian Astrophysical Observatory, 60 Garden St., Cambridge, MA
02138 USA
1 Introduction
X-ray observations of radio galaxies provide vital data unobtainable at other wavelengths. Most of the constraints derived from X-ray observations can be divided into one of two areas: a study of the hot ambient gas from thermal bremsstrahlung emission or investigation of non-thermal emission from particular radio features which in turn constrains the parameters which describe the magnetic field and relativistic electrons responsible for the radio emission. We review here several topics in each area, provide some new data from ROSAT High Resolution Imager (HRI) observations, and append a short section on the situation at high z.
2 Thermal Emission from Hot Gas
Hot, X-ray emitting gas appears to be a ubiquitous feature of all reasonably deep potential wells associated with bulge systems. Although the bulges in spirals are often not detectable with current satellites, this is not the case for normal or massive ellipticals (e.g. Davis and White III 1996). These systems are characterized by gas with temperatures of a few keV (i.e. a few K) and the X-ray satellites EINSTEIN, ROSAT, and ASCA have been well matched to their primary emitting band.
Generally, the X-ray brightness distribution is well described by a modified King distribution (a.k.a. ‘Beta Model’):
where I(r) is the X-ray surface brightness as a function of radius, r; a is the core radius; n(r) is the electron density as a function of r; and no is the electron density at r=0.
Since the observable extent is tens of kpc (hundreds of kpc for cluster atmospheres), the X-ray observations give an estimate of the electron density over a region which often encompasses the radio source. At the same time, an estimate of the temperature is obtained from those detectors which have reasonable spectral resolution.
2.1 Pressure Balance
A potentially powerful diagnostic is provided by the expectation that some radio features will be in pressure balance with the external medium. In practice, there are several problems which limit the usefulness of the concept.
Do most radio features exclude ambient gas? If not, we must include a thermal contribution to the internal pressure, and this is normally difficult to estimate. For the case of the lobes of Cygnus A, Carilli et al. (1994) and Clarke et al. (1997) argue that the X-ray observations show that the lobes exclude the hot cluster gas.
In almost all radio structures, we don’t know the internal (non-thermal) pressure, so we compute the minimum pressure. This assumes that only the observed synchrotron spectrum is used to estimate the relativistic electron population (i.e. no contribution from electrons which radiate below the lowest observed frequency); equipartition holds between the magnetic field and particle energy densities; the filling factor is unity; and there is no significant contribution to the energy density from relativistic protons (see e.g. Harris et al. 1995 for further discussions).
If the radio feature is moving with respect to the ambient medium, a ram pressure component must be added to the pressure balance equation. If the internal pressure is greater than the external pressure, then we expect expansion. Since it is difficult to estimate the magnitude of the ram pressure, it is preferable to use radio features whose boundaries are thought to be stationary or moving very slowly.
In many cases there is the added complication of the projection factor. For sources such as Cygnus A which is most likely close to the center of the observed hot gas distribution we can reliably obtain a thermal pressure at the positions of the hotspots. However, for other sources such as tailed radio galaxies (TRG) in clusters, we don’t know how far out in the cluster atmosphere the source really is, and thus we have only an upper limit on the external gas pressure.
The most interesting application would be a detailed study of radio features for which all of the above uncertainties were minimized. Our expectation would be that the external gas pressure should be greater than the minimum non-thermal pressure, and the magnitude of the difference would provide an estimate of the contribution of protons and/or low energy electrons to the internal pressure. Such a study was made by Feretti et al. (1990) for radio galaxies at the centers of rich clusters. They found thermal pressures always greater than minimum non-thermal pressures and from the magnitude of the pressure ratios, derived ranges of the filling factor (0.03 to 0.3) or of the ratio of energy in protons to that in electrons (6 to 75) which would restore pressure balance.
2.2 Buoyancy
Since we have evidence that most radio features exclude the ambient gas and thus their internal pressure is dominated by non-thermal components, it follows that these will be lighter than the external medium and experience buoyancy forces. We can expect that these forces will be manifest whenever the external pressure gradient is large enough to produce a significant (compared to other fluctuations of the pressure) difference in force between one part of the radio feature and another. The two conditions of interest are large gradients in pressure and/or large sources (e.g. TRGs in cluster atmospheres). Note also that if the radio source is expanding supersonically, buoyancy is irrelevant.
For the most part, buoyancy has been suggested as a plausible explanation of changes of position angle for lower brightness regions. Examples are 26W20 (Harris, Costain, and Dewdney 1984); a TRG in Abell 115 (Gregorini and Bondi, 1989); and the TRG in the 0335+09 cluster ( Sarazin, Baum and O’Dea 1995). Worral, Birkinshaw, and Cameron (1995) present a more quantitative analysis for the buoyancy forces operating on NGC 326.
2.3 Hydrodynamics of Interactions
Many of the hypothesized attributes of radio galaxies become accessible via X-ray investigations of the hot ambient gas. From ROSAT HRI observations of Cygnus A (Carilli, Perley, and Harris 1994) we found evidence for cavities in the ambient gas caused by the radio lobes. We also suggested that symmetric features of enhanced X-ray brightness were caused by the longer path length through the sheath of compressed gas between the (hypothetical) bow shock and the radio lobe. These results which relied on approximate analytical calculations were corroborated by hydrodynamical simulations (Clarke, Harris, and Carilli 1997) which also demonstrated the vastly different morphologies expected for the X-ray surface brightness of a modified King distribution of hot gas disturbed by a powerful radio galaxy. In particular, the match or mis-match of the X-ray spectral sensitivity compared to the temperature of the ambient medium has a strong effect on the resulting X-ray map. For Cygnus A, with a temperature close to 4 keV, the ROSAT HRI is well matched to the ambient temperature, but not to the gas at the leading edge of the bow shock, which is expected to be much hotter. Hence we found the cavities and the sheath well away from the leading edge. The exciting prospects for AXAF data are the detection of the leading bow shock at the higher energies and more spatial detail and spectral resolution for the known features at lower energies.
2.4 Local Weather
By ‘weather’ we mean ‘Which way is the wind blowing?’. The problem of winds in the ICM has only recently received serious attention because the idea that many clusters show attributes of recent or ongoing mergers now creates a natural explanation for large scale gas motions with respect to individual galaxies. A long standing problem has been the explanation for the morphology of wide angle tailed (WAT) radio galaxies. Since WATs are normally associated with the dominant cluster galaxy, there is good reason to believe that their velocity with respect to the cluster potential is nil (Eilek et al. 1978). However, as shown by numerical simulations (Loken, Roettiger, and Burns 1995; Roettiger, Burns, and Loken 1996) the winds produced by mergers are capable of generating the WAT morphology.
A related, perhaps more common phenomenon is the bending of radio jets which often occurs as the jet leaves the ISM and experiences the ICM. Gregorini and Bondi (1989) invoke this explanation for the TRG in Abell 115.
A striking example of a possible interface between the ISM of M87 and a moving ICM in the Virgo cluster is afforded by recent ROSAT HRI observations (Harris, Biretta, and Junor 1998). The X-ray ‘spur’ (see Figure 1) which extends about 4.5 arcmin to the SW is most likely thermal emission since it does not correspond to any radio feature. Together with the X-ray arm which extends to the East, one obtains the distinct impression of a bow shock (with large gradient on the leading edge) whose principal axis would be in PA 150 degrees. The idea of a merger in the Virgo cluster is suggested also by Binggeli (1998) who presents substantial evidence that the so-called ‘M86 subclump’ is merging with the M87 subclump. If these ideas are correct, the wind model might be useful in understanding the large scale radio structure of M87 which has long been thought of as a WAT in projection (i.e. the major extent of the radio arms are along the line of sight).

2.5 Effects of Pressure Gradients
When a radio jet crosses a region where the external pressure is falling sharply, the jet can lose its tight collimation. Several examples of this behavior have been noted, including several of the sources cited in the previous section (e.g. when a jet passes from the ISM to the ICM). Another effect could be the genesis of an internal shock. If one traces back the boundary of the SW spur in figure 1, it passes close to the position of knot A in the M87 jet. This raises the possibility that the occurrence of this strong shock is caused by a sudden change in the external pressure (see e.g. Hooda and Wiita 1998).
3 Non-thermal Emission: Hotspots and Knots in Radio Jets
In addition to the wealth of information afforded by studies of thermal X-ray emission around radio galaxies, the non-thermal emissions detected from a handful of radio features provides constraints on acceleration processes, the characteristics of the population of relativistic electrons responsible for the radio emission, and the magnetic field strength. The two primary emission mechanisms normally considered for these features are inverse Compton (IC) emission and synchrotron emission. The IC process can work on any photon distribution, but here we are mostly concerned with either IC from the 3k background photons (IC/3k) or synchrotron self Compton (SSC) emission. IC/3k is expected from radio features of low surface brightness (i.e. weak magnetic fields, Harris and Grindlay, 1979) whereas the SSC process requires compact, high brightness radio structures in order to be detectable by current X-ray systems. It is, however, important to remember that both types of IC emission are mandatory physical processes which occur in all (radio) synchrotron sources.
The problem of synchrotron X-ray emission revolves around the poorly understood questions of the acceleration mechanisms. If we invoke the classical shock model, then we need to devise conditions which allow the resulting population of relativistic electrons to extend to Lorentz energy factors, in order to explain X-ray generation in typical field strengths of order 100 G.
3.1 IC/3k Emission
Because the major contribution to the photon energy density occurs at a frequency (1+z) Hz, the electrons responsible for a given X-ray energy will have the same Lorentz factor regardless of the redshift (e.g. for 1 keV photons, the relevant electrons have = 1069 (Harris and Grindlay, 1979). Since the magnitude of the 3k energy density is known, any X-ray detection of IC/3k emission can be used to obtain the amplitude of the electron spectrum at the relevant energy. If one is prepared to make the extrapolation of the electron spectrum from the observed X-ray point to that region defined by the radio emission, we can thus derive a measure of the average magnetic field strength. There have been many unsuccessful attempts to do this (e.g. Harris et al. 1995).
There are however two convincing cases: the radio lobes of Fornax A and a relic radio source associated with the cluster Abell 85. Using the ROSAT PSPC, Feigelson et al. (1995) argue that the observed X-rays represent the detection of IC/3k emission based primarily on spatial analysis. Using ASCA, Kaneda et al. (1995) demonstrate a consistent result based on a spectral analysis. In both investigations, a field strength of a few G is derived, roughly consistent with expectations from equipartition arguments. Recently, Bagchi, Pislar, and Lima Neto (1998) have combined low frequency radio and PSPC X-ray data. They find a magnetic field strength of 0.95 G for a steep spectrum radio source which lies at a projected distance of 700 kpc from the center of Abell 85 (H∘=50 ).
Hwang (1997) has suggested that an observed excess of extreme ultra violet (EUV) emission from the Coma and Virgo clusters may be caused by IC/3k emission and Sarazin and Lieu (1998) have extended this idea to other clusters, even those without observable radio halos. One of the problems of these models is that 300 in order to produce the observed EUV emission, so that the extrapolation of the electron spectrum to/from the observed radio regime involves greater uncertainties.
3.2 SSC Emission
Except for (unresolved) emission from the cores of radio galaxies and quasars, SSC emission has been reliably established only in the radio hotspots of Cygnus A (Harris, Carilli, and Perley, 1994). By ‘reliably’ we mean that the radio structure has been resolved and the radio spectrum is well defined so that a good estimate of the synchrotron photon energy density can be calculated. Furthermore, the resulting values of the average magnetic field strength (15817 G for hotspot A, and 24622 G for hotspot D) are in good agreement with the conventional equipartition values: 134 to 183 G for hotspot A and 192 to 262 G for hotspot D.
Although the SSC model for the hotspots is completely satisfactory, another possible model is synchrotron emission associated with the so called “proton induced cascade” (PIC) process (Mannheim, Krulls, and Biermann 1991). The PIC is a sister process to SSC in that it requires high photon energy densities, but relies on extremely high energy protons (). Instead of a steep power law of relativistic electrons covering many decades in energy, the electrons responsible for the observed X-ray emission are supplied via pair production form higher energy photons. If PIC emission were responsible for the X-ray emission from the hotspots of Cygnus A, the resulting magnetic field strength would have to be greater than 500G compared to the value of 100 to 200 G derived from SSC. Thus the lower field values can be thought of as strict lower limits to the average field strength, regardless of the emission process responsible for the X-rays.
One of the implications of the SSC model concerns the ‘fluid’ of the jets. If the jets were to consist of normal matter (electrons and protons), we have every reason to believe that the terminal shock of the jet (the radio hotspot) would accelerate the protons as well as the electrons and that the proton contribution would dominate the relativistic particle energy density (i.e. the (1+k) factor would be greater than 50). However, the equipartition field with which the SSC field agrees is calculated on the basis of little or no energy density from protons. If equipartition is valid, this implies that there are no protons in the jet which would then be required to contain electrons and positrons. On the other hand, if PIC is the primary emission process, the magnetic energy density is much greater and equipartition is maintained with a dominating contribution to the particle energy density from protons. Unfortunately we have been unable to devise a definitive test to differentiate between SSC and PIC emission for the Cygnus A hotspots. The gamma ray satellites currently operational are not sensitive enough to detect the predicted higher energy PIC emission.
3.3 Synchrotron Emission

Synchrotron emission has been the process ‘of choice’ for non-thermal models of X-ray emission from knots and hotspots associated with radio jets. A primary example is knot A in the M87 jet (Biretta, Stern, and Harris 1991). The optical morphology mimics the radio structure and the optical emission is polarized. An extrapolation of the optical spectrum of knot A to the X-ray flux density is consistent with a single power law (albeit steeper than the radio to optical spectrum).
At this time there are two major problems for the X-ray synchrotron model based on a population of relativistic electrons described by a single power law or a double power law (characterized by a ‘break frequency’). The first of these arises from recent observations which attempt to define the IR and optical spectra of individual features at high spatial resolution. For both Pictor A (the western hotspot) and 3C 273, cutoffs in the radio-optical spectra of the feature observed in the X-rays demonstrate that a simple spectral extrapolation of the spatial emission at optical wavelengths cannot provide an explanation for the observed X-ray intensity (Röser et al. 1997). Since straightforward SSC models also fail to predict the observed X-rays, this means that we need a more complex spatial/spectral model or we need a different emission process. One could imagine very compact components undetectable in the radio and/or optical because of synchrotron self-absorption, but still producing X-ray synchrotron emission. Something along these lines would be consistent with the variability results of Harris, Biretta, and Junor (1997) who predict that the X-ray size of the M87 knot A will be substantially smaller than that observed in the radio and optical. Planned AXAF observations will have the required resolution to test this prediction.

The second problem for the standard (shock model) synchrotron spectrum extending up to X-ray energies is to explain why some acceleration sites are capable of producing enough electrons with energies to generate the observed X-ray emission, whereas most hotspots and knots do not sustain these conditions. One common characteristic of these features appears to be the presence of a very large gradient in the radio surface brightness, indicative of a shock as the underlying cause of the radio feature. For knot A in the M87 jet, this leading edge feature is well known, both in the radio and optical. In figure 2, we show another example, the northern hotspot B in the FR II radio galaxy, 3C 390.3. As discussed in Harris, Leighly, and Leahy (1998), there is circumstantial evidence that hotspot B owes its existence to the shock formed in the jet as it enters the extended atmosphere of a dwarf galaxy. New optical data have been reported by Prieto & Kotilainen (1997), and their images demonstrate how well the shock front lies along the common edge of the galaxy and the hotspot. The currently available data are consistent with a single power law from the radio to the X-ray (figure 3). Thus a simple synchrotron model is acceptable, with the electron spectrum extending up to and an equipartition magnetic field strength of 44 G leading to a half-life of 57 years for the most energetic electrons.
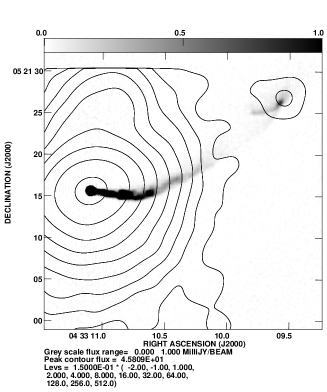
Another example is a radio knot in the jet of 3C 120, shown in Figure 4. In this case, there is no optical emission detected, nor is there any obvious reason for the existence of the large gradient in radio surface brightness on the western edge of the knot, yet it is this feature, not the gradient on the south edge, which is associated with the X-ray emission. Optical upper limits preclude the construction of a radio to X-ray spectrum consisting of one or two power laws. Thus although we identify the X-ray emission with the site of a shock, a simple synchrotron model is difficult to construct.
4 The Situation at High Redshift
Although AGN X-ray emission can be detected at high redshift, the sort of features described in the previous section are intrinsically too weak for current detectors. This is not true however for extended thermal emission from clusters, and Carilli (this volume) describes a ROSAT detection of a z=2.1 radio galaxy. However, there were not enough photons collected ( 1 photon per ksec) to be sure that the resulting spatial distribution is larger than the instrumental point response function. Whether or not well formed hot cluster atmospheres will be found at large z remains to be determined.
The one condition that we may confidently expect to be different at high redshift is the photon energy density of the cosmic background which goes as (1+z)4. Since IC losses are proportional to the energy density of photons, the half-life against IC losses at z=2.16 will be 100 times less than at z=0. This effect may operate to limit the physical sizes of radio sources at high redshift. Krolik and Chen (1991) have discussed the affect of redshift in that one samples segments of the radio spectrum at higher and higher rest frame frequencies as the redshift increases, thereby producing a statistical increase in the mean spectral index. However, the extremely steep spectra (1.2) found for some high z radio galaxies has not been satisfactorily explained. Perhaps these sources are heavily weighted with components for which the exponential cutoff in the electron spectrum is lower than for z=0 sources because of the much larger E2 IC/3k losses.
5 Summary
We reviewed the major ways that X-ray observations contribute to our understanding of radio galaxies. Many of these methods have been of limited usefulness because current X-ray satellites have lacked the combination of spatial and spectral resolution required to obtain density and temperature information on a suitable scale to make detailed comparison with the radio features. In spite of this problem, current X-ray data indicate that:
-
•
Most or all galaxies have a hot, extended atmosphere.
-
•
Most or all radio features exclude ambient thermal plasma.
-
•
The most likely reasons that external thermal pressures are greater than internal minimum pressures are that the actual non-thermal pressures are substantially greater than the minimum values: significant contributions to the energy density come from protons and/or low energy electrons, neither of which can be directly measured. Filling factors less than one are also probable in some sources. We are not aware of any compelling evidence for a substantial departure from equipartition or for significant contributions to the internal pressure from thermal gas.
-
•
With the above caveats, classical methods of estimating the equipartition magnetic field are probably not grossly in error.
-
•
Buoyancy and large scale gas motions affect radio morphology, particularly for lower brightness features.
-
•
Several signatures of the interaction of radio jets and lobes with the ambient gas have been found, and more should be forthcoming with the advent of AXAF.
-
•
IC/3k emission from the radio lobes of Fornax A and SSC emission from the Cygnus A hotspots provide unique estimates of the average magnetic field strength.
-
•
For some hotspots and knots in jets, simple synchrotron and inverse Compton models fail to provide for the observed X-ray intensity.
-
•
Unless characteristic magnetic field strengths are significantly larger in high redshift sources than they are locally, the (1+z)4 increase in the photon energy density of the microwave background will increase the ratio of IC/3k (X-ray) to synchrotron (radio) power emitted by radio sources.
We benefited from useful discussions with M. Birkinshaw, M. Elvis, G. Fabbiano, W. Forman, C. Jones, D. Kim, and D. Worral. The ROSAT work on M87 comes from an ongoing collaboration with J. Biretta and W. Junor; that on 3C 120 with J. Hjorth, A. Sadun, and M. Vestergaard. We thank C. Carilli for helpful comments on the manuscript. NASA contract NAS5-30934 and grant NAG5-2960 provided partial support.
References
- [] Bagchi, J., Pislar, V., and Lima Neto, G.B. 1998 MNRAS (in press)
- [] Binggeli, B. 1998 to be published in the proceedings of the Ringberg Workshop on M87, by Springer Verlag Lecture Notes in Physics, Röser, H.J., and Meisenheimer, K., editors
- [] Biretta, J.A., Stern, C.P., and Harris, D.E. 1991 A.J., 101, 1632
- [] Carilli, C.L., Perley, R.A., and Harris, D.E. 1994, MNRAS, 270, 173
- [] Clarke, D.A., Harris, D.E., and Carilli, C.L. 1997, MNRAS 284, 981
- [] Davis, D. and White III, R. 1996 ApJ. 470, L35
- [] Eilek, J.A., Burns, J.O., O’Dea, C.P., and Owen, F.N. 1984 ApJ 278, 37
- [] Feigelson, E.D., Laurent-Muehleisen, S.A., Kollgaard, R.I., and Fomalont, E.B. 1995 ApJL 449, L149
- [] Feretti, L., Spazzoli, O., Gioia, I.M., Giovannini, G., and Gregorini, L. 1990 A&A 233, 325
- [] Gregorini, L. and Bondi, M. 1989 A&A 225, 333
- [] Harris, D.E. and Grindlay, J.E. 1979 MNRAS 188, 25
- [] Harris, D.E., Costain, C.H., and Dewdney, P.E. 1984 ApJ 280, 532
- [] Harris, D.E., Carilli, C.L. and Perley, R.A. 1994 Nature 367, 713
- [] Harris, D.E., Willis, A.G., Dewdney, P.E., and Batty, J. 1995, MNRAS 273, 785
- [] Harris, D.E., Biretta, J.A. and Junor, W. 1997 MNRAS 284, L21
- [] Harris, D.E. Leighly, K.M., and Leahy, J.P. 1998 ApJL (submitted).
- [] Harris, D.E., Sadun, A., Hjorth, J., Vestergaard, M., and Silverman, J.D. 1998 (in preparation)
- [] Harris, D.E., Biretta, J.A. and Junor, W. 1998 (in preparation)
- [] Hooda, J.S. and Wiita, P.J. 1998 ApJ 493, 81
- [] Hwang, C. 1997 Science 278, 1917
- [] Kaneda, H., Tashiro, M., Ikebe, Y., Ishisaki, Y., Kubo, H., Makshima, K., Ohashi, T., Saito, Y., Tabara, H., and Takahashi, T. 1995ApJ 453, L13
- [] Krolik, J.H. and Chen, W. 1991 AJ 102, 1659
- [] Loken, C. Roettiger, K., and Burns, J.O. 1995 ApJ 445, 80
- [] Mannheim, K., Krulls, W.M., & Biermann, P.L. 1991 A&A 251, 723
- [] Prieto, M. A. & Kotilainen, J. K. 1997, ApJ 491, L77
- [] Roettiger, K, Burns, J.O., and Loken, C. 1996 ApJ 473, 651
- [] Röser, H.J., Meisenheimer, K., Neumann, M., Conway, R.G., Davis, J.J., and Perley, R.A. 1997 Rev. Mod. Astr. 10, 253
- [] Sarazin, C.L., Baum, S.A., and O’Dea, C.P. 1995 ApJ 451, 125
- [] Sarazin, C.L. and Lieu, R. 1998 ApJ 494, L177
- [] Worral, D.M., Birkinshaw, M., and Cameron, R.A. 1995 ApJ 449, 93