Multiwavelength observations of 26W20, a radio galaxy which displays BL Lac characteristics.
Abstract
26W20, a radio galaxy located at a projected distance of 2.2 Mpc from the center of Abell 754 (z=0.054) exhibits core emission properties similar to those of a BL Lac object. New radio observations and VLA archival data show parsec scale features in the core ( ergs s-1) with a flat spectrum. From observations with ROSAT, we demonstrate that the X-ray core emission ergs s-1) is non-thermal and variable. An 18% increase in the X-ray luminosity was observed in two observations separated by five days. The optical morphology is that of a large, normal elliptical galaxy ( and the optical spectrum lacks strong emission lines. If the innermost segment of the radio jet is close to our line of sight, Doppler boosting could explain both the observed X-ray intensity and the absence of emitting line regions.
Key Words.:
Radio continuum: galaxies – X-rays: galaxies – BL Lacertae objects: individual – Galaxies: jets1 Introduction
26W20 was discovered in the Westerbork radio survey by Harris et al. (1980). The galaxy lies in a sub-cluster of Abell 754. The structure of the cluster and the reality of the sub-cluster containing 26W20 are detailed by Kriesslar and Beers (1997).
The radio morphology and classification has been described as a Fanaroff and Riley class I object, either a ’tailed radio galaxy’ (TRG) or a single-sided lobe (Harris et al. 1980; Harris, Costain and Dewdney, 1984 - ’HCD’ hereafter). A single jet/tail is seen extending 170 kpc from the core (= 50 km s-1 Mpc-1) and ending in a low surface brightness lobe (Fig. 1). Because no jet or lobe was detected on the other side of the galaxy, and since the host galaxy is a member of a small group of galaxies, a TRG model was favored over a single-sided jet model (HCD).
Galaxies with X-ray bright nuclei are usually characterized by strong emission lines. 26W20 is one of four known galaxies with a high apparent X-ray luminosity from the nucleus but with only weak or undetectable emission lines. The other three are 3C264 (Baum et al. 1997), J2310$-$43 (Tananbaum et al. 1997) and PKS 2316$-$423 (Crawford and Fabian 1994). Nuclear parameters are given in Table 1.
26W20 was first observed in X-rays with the EINSTEIN Observatory’s imaging proportional counter (IPC) and high resolution imager (HRI). The X-ray source was unresolved with the HRI (FWHM=5″) and the IPC spectrum could be equally well fit by a power law with an energy index of 0.8 0.4 or a thermal bremsstrahlung spectrum with kT=3 keV (constrained to be greater than 1 keV).
Motivated to understand the head-tail morphology of 26W20, we have obtained new radio and X-ray measurements to study the inner jet region. While there is possible evidence for a TRG model, these observations reveal core emission properties similar to those of a BL Lac object. However, there is no evidence for excess optical emission from the nucleus. This distinguishes 26w20 from a typical BL Lac object.
We use ROSAT HRI data to provide upper limits on hot ambient gas which would be required to provide the ’ram pressure’ if nuclear gas is to be ’stripped’ from the galaxy. MERLIN observations were obtained to see if twin jets are present in the core and to see if they show severe bending necessary for a beaming model in order to change the jet from being close to the line of sight to that observed for the large scale tail which lies more in the plane of the sky.
| Table 1. | ||||
| Comparative parameters for the nucleus of similar sources | ||||
| Parameter | 26W20 | J2310-431 | 3C 2642 | PKS 2316-4233 |
| Redshift………….. | 0.054 | 0.0886 | 0.0215 | 0.0549 |
| lr(1030 cgs)a | 7.8 | 21.2 | 5.2 | 70.3 |
| Lx(ergs s-1). | 3.7b | 14.5c | 0.88c | 8.6c |
| M………………… | -19.6 | -20.1 | -19.8 | -20.8e |
| …………………. | 0.25 | 0 | 0 | 0.67 |
| …………………. | 1.3 | 1.4 | 1.3 | — |
| Emission Lines… | none | none | weakf | weak |
References: (1) as reported in Tananbaum et al. 1997 (2) as
reported in Tananbaum et al. 1997, Elvis et al. 1981; (3) Crawford and
Fabian 1994
Notes: (a) Monochromatic luminosity at 5 GHz in units of ergs s-1
Hz-1; (b) Energy range of
(0.5-3.0 keV); (c) Energy range of (0.1-2.4 keV); (d) The core
magnitude is assumed to be less than 1/10 of the magnitude of the
whole galaxy; (e) This lower limit is due to the
inclusion of optical emission not associated with the nucleus; (f)
An extended region of 400 km s-1 wide
H+[NII] emission is seen (Baum et al. 1997);
2 Observations and Data Reduction
2.1 Radio
2.1.1 Low Resolution
The archival 21 cm VLA radio data of 26W20 have been reprocessed (Figure 1). This map was made with a hybrid configuration of antennas and a 30k taper. At 1413 MHz, the core has a flux density of 165 mJy; the tail, 87 mJy; and the lobe, 171 mJy. The total flux density of the source is 43540 mJy. The TRG model requires the galaxy to be moving with a sizeable fraction of its velocity vector perpendicular to our line of sight. In this model, the twin jets point initially parallel and anti-parallel with the line-of-sight. They are then bent back over short spatial scales in such a way that the twin tails appear superimposed.

2.1.2 High Resolution
Imaging of the VLA archival data (Figure 2) at 3.6 cm shows an unresolved core with a peak flux density of 48 mJy/beam. Using the FWHM as the angular extent, the scale size of the core is kpc.

We recently mapped 26W20 with the MERLIN array at 6 cm (Figure 3). With an integrated flux density of 45 mJy, 70% of the emission measured by the VLA is contained within a compact region of scale size 100 pc. From the image it is seen that we were able to detect a second component at nearly the same position angle as the jet/tail in the VLA maps.

2.1.3 Radio Spectrum
Table 2 lists the flux densities for all the observations. Figure 4 shows the radio spectrum of the core using two beam sizes of and . The spectral index, , is 0.25 for the beam.

| Table 2. | ||||
| Flux densities for the core of 26W20 | ||||
| Freq | MJD | Beamsize | Flux Density(S) | |
| (MHz) | (arcsec) | Peak(mJy) | Integrated(mJy) | |
| 14131 | 44360 | 3.5 | 111.6(5.6) | — |
| 48731 | 44360 | 3.5 | 82.4(4.1) | — |
| 48732 | 44360 | 0.8 | 61.7(3.1) | — |
| 49943 | 50417 | 0.180.03 | 34.1(1.7) | 45(2.2) |
| 84394 | 48982 | 0.40.25 | 48.3(2.4) | 61.8(3.1) |
| 84395 | 48982 | 0.40.25 | — | 53.8(3.0) |
| 105506 | 69 | 75(2.8) | — | |
Notes:
The uncertainties are given in parenthesis.
1 Obs-date:1980Jun01; 50 k taper
2 Obs-date:1980Jun01; HCD, fig 6
3 Obs-date:1996Dec; MERLIN
4 Obs-date:1992Dec26; Integrated flux using a box.
5 Obs-date:1992Dec26; Integrated flux using a 1 box.
6 Obs-date:91/92; MPIfR, Mack et al. (1993). In that
compilation of 10 TRGs, a table is given of previous observations; but most or all appear to use large beams and
so do not provide useful data for our purposes.
2.2 X-ray
Due to the close proximity of 26W20 to the cluster Abell 754, there are several observations with ROSAT and EINSTEIN for which 26W20 is in the field of view. The galaxy was first detected with the EINSTEIN observatory and imaged with the IPC and HRI ergs s-1; HCD). Five ROSAT observations using the HRI and the Position Sensitive Proportional Counter (PSPC) are available spanning two years (Table 3; three off-axis PSPC, one on-axis PSPC and one on-axis HRI). All luminosity measurements are calculated for the energy range 0.5 to 3.0 keV with one sigma errors associated with the count statistics. Data analysis was performed with the PROS package under IRAF.
| Table 3. | ||||
| X-ray Source Parameters | ||||
| Instr. | Obs | Exp. time | Cnt rate | Luminosity |
| date | (sec) | (cts s-1) | ergs s-1) | |
| EO | 1979/80 | 2.2(0.65) | ||
| PSPC2 | 21/11/91 | 2322 | 0.154 | 3.88(0.23) |
| PSPC1 | 05/11/92 | 13499 | 0.153 | 3.12(0.07) |
| PSPC2 | 10/11/92 | 6359 | 0.146 | 3.67(0.15) |
| HRI1 | 22/11/92 | 24225 | 0.066 | 3.70(0.10) |
| PSPC2 | 06/11/93 | 8160 | 0.112 | 2.85(0.10) |
Notes:
(1) On-axis observations.
(2) Off-axis observations. The count rates have not been corrected for
vignetting.
2.2.1 Spatial Extent
The X-ray core emission is unresolved with the ROSAT HRI. The radial profile (Figure 5) shows the close fit of the count distribution to the ROSAT point response function.
There is no conclusive evidence for the presence of any significant extended emission in the local environment of 26W20. The low level emission seen in the to region at about 1% of the peak intensity can be attributed to instrumental effects. As shown in Figure 1 of The HRI Calibration Report (David et al. 1995), there is a discrepancy in the fit to the point response function in the to range as determined using a long HZ43 observation.

2.2.2 Spectral Fit
Analysis of archival X-ray data from the ROSAT PSPC and our HRI data (including EINSTEIN) is presented in Figure 6 and Table 3. The energy index and the galactic column density were allowed as free parameters. The values of the fitted column density agreed closely with the galactic value of cm-2. Using the long, on-axis PSPC observation (13 ksec), we find for a power law model fit with 29 degrees of freedom, , log =20.900.04 and . For a Raymond-Smith thermal model, the fitted spectral parameters are kT= keV; log , and . On the basis of the goodness of fit, the core emission is described more favorably by a non-thermal model.
The best fit spectral parameters for each individual observation are shown in Figure 6. The slight increase in the energy index is within the errors.
2.2.3 Variability
All ROSAT luminosities (Figure 6; Table 3) have been calculated with a power law model with an energy index of 1.32 and a log of the galactic of 20.90. These values are the best fit parameters from the longest on-axis PSPC observation. A decrease of the luminosity from PSPC measurements is relatively mild over two years from 1991 to 1993. However, an 18% increase in the luminosity occurred within five days between two PSPC observations in 1992. An HRI image about two weeks later confirms this increase. We suspect that our under sampled measurements do not clearly represent the temporal behavior of the core luminosity. Note that the ROSAT luminosities are substantially higher than the average of the two EO observations.

2.2.4 Ambient medium
If 26W20 is a TRG, there should be an ambient gas through which the galaxy is moving. Upper limits of the particle density from a hot, X-ray emitting gas were calculated using the ROSAT HRI data. The particle densities estimated from different methods are displayed in Table 4.
The particle density measurements of the sub-cluster environment surrounding 26W20 include an acceptable range of values in agreement with the radio non-thermal pressure measurements. From the King model of the cluster, it is evident that particle densities in this region are attributed to the local environment of the sub-cluster and not to the main cluster, Abell 754. We can then compare our estimated upper limit of 0.76 cm-3 to that for TRGs in other clusters. Our upper limit falls within the range of ambient densities (0.02 - 6) cm-3 as reported by Feretti et al. (1992) near TRGs in Abell clusters.
As a final check to detect the presence of any hot, extended gas in the sub-cluster, 26W20 and an adjacent source were subtracted from the HRI map. Then the image was rebinned to pixels and smoothed with a Gaussian of FWHM=60″. There appeared to be no conclusive evidence for the existence of any hot extended gas.
| Table 4 | |||
|---|---|---|---|
| Ambient Density Measurements | |||
| Method | Pressure | Density | Flux |
| ( cgs) | ( cm-3) | ( cgs) | |
| Extrapolation of King | |||
| Model for the Main | |||
| Cluster1 | |||
| Upper limits from HRI2 | |||
| 150 Radius Aperture | |||
| T=1 keV | |||
| T=5 keV | |||
| 50 Radius Aperture | |||
| T=1 keV | |||
| T=5 keV | |||
| Radio non-thermal | |||
| pressure3 | |||
| T=1 keV | |||
| T=5 keV | |||
Notes:
The cgs unit of flux used is (ergs cm-2 s-1) and pressure is
(dyne cm-2). The energy range is (0.5 - 3.0 keV).
1) A King model for A754 with kT=7 keV (Abramopoulos and Ku; 1983)
provides an upper limit to the cluster gas. Due to an unknown
projection, 26W20 could be significantly further from the cluster
center than the projected separation.
2) Fluxes were measured for two different size regions surrounding 26W20. The larger volume represents the scale where the radio structure changes from straight jet/tail to a lobe. It is also the scale size suggested by the galaxy surface density. The smaller region would be appropriate for the core radius if the local gas had a King distribution. The values are 3 sigma upper limits for a uniform gas.
3) Since non-thermal pressure within the radio jet and lobe should be in balance with the external medium, particularly for the lobe, a lower limit to the pressure was calculated from the radio emission. This is a strict lower limit since a) we assumed a filling factor of 1, b) we integrated electron energies which correspond to only the observed part of the radio spectrum and c) we assumed no contribution to the energy density from relativistic protons.
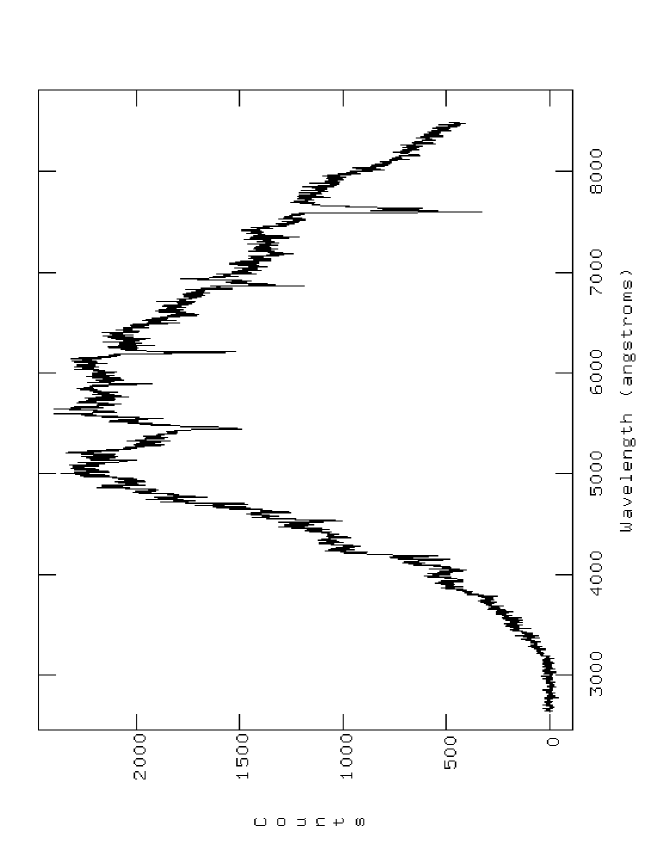
2.3 Optical data
Two, ten minute, blue channel CCD optical spectra were taken on a Multiple Mirror Telescope (MMT) open night on April 9, 1997. Figure 7 is the summed wavelength calibrated spectrum for both exposures. The measured redshift of z=0.0537 agrees with previous measurements (HCD). The slit has a width of and a length of . The dispersion of the grating is 300 lines/mm. The 3K1K CCD has a spatial resolution of 0.3″/pixel. The PA of the slit is -37.9 aligned along the radio jet.
3 Discussion
The radio and X-ray core emission in conjunction with the lack of prominent optical emission lines are properties similar to a BL Lac type object but the lack of strong optical core emission distinguishes this galaxy from a typical BL Lac.
Our high resolution MERLIN observation at 6 cm (Figure 3) shows a compact region of about 100 parsecs. These results further support the compact nature of the core emission of the VLA images by Harris et al. (1984) and the archival 3.6 cm data (Figure 2). The position angle of the second component (PA=140°) agrees, within the errors, with those in the 21 cm map (PA=145°) and the 3.6 cm image (PA=150°).
We have computed the values for (0.43) and (0.99) with an assumption that the upper limit of the optical core flux is 0.24 mJy (1/10 of the total flux of the galaxy in the V band). The X-ray flux from an HRI measurement is 0.56 Jy at 1 keV. Given these values, 26W20 lies in the center of the X-ray selected BL Lac objects on the vs. plot as shown in Figure 8 of Tananbaum et al. 1997. If the core luminosity is significantly less than our upper limit, this could place 26W20 at an extreme position outside of the BL Lac group.
Given the range of and for a typical X-ray selected BL Lac, the core optical flux is between 3.2 and 1.55 mJy. Therefore, an excess of optical flux in the core will not significantly change the color or magnitude of the galaxy as a whole.
No evidence for the presence of any hot, extended gas was found in the sub-cluster containing 26W20. From density measurements of the sub-cluster environment, the values fall within the range of ambient densities of other clusters harboring TRGs.
We propose that the BL Lac properties observed in 26W20 are evidence of energetic emission from the core due to beamed emission from a component of the jet. Therefore, the large apparent (i.e. if emission is isotropic) X-ray luminosity of ergs s-1, concomitant with the absence of emission lines, means either there is no gas in the galaxy to form emission line regions or the X-rays are beamed and not available to ionize the gas.
Acknowledgements.
We thank J. Kriesslar and T. Beers for providing the galaxy number density plot of Abell 754 and Jonathan Schachter for useful discussions. Also, we are indebted to J. Huchra, P. Berlind, J. Mader, S. Tokarz and D. Fabricant for the help in obtaining and analyzing an optical spectrum of the galaxy based on observations made with the Multiple Mirror Telescope, a joint facility of the Smithsonian Institution and the University of Arizona. MERLIN is a UK national facility, operated by the University of Manchester on behalf of the Particle Physics and Astronomy Research Council. We thank S. Garrington for calibrating our data. This work was partially supported by NASA contract NAS5-30934. An anonymous referee contributed useful comments.References
- (1) Abramopoulos, F., Ku, W.H.-M., 1983, ApJ 271, 446
- (2) Baum, S.A., O’Dea, C., Giovannini, G., Biretta, J., Cotton, W.B., DE Koff, S., Feretti, L., Golombek, D., Lara, L., Macchetto, F.D., Miley, G.K., Sparks, W.B., Venturi, T., Komissarov, S.S., 1997, ApJ 483,178
- (3) Crawford, C.S., Fabian, A.C., 1994, MNRAS 266, 669
-
(4)
David, L.D., Harnden Jr., F.R., Kearns, K.E., Zombeck, M.V., 1995, The
ROSAT High Resolution Imager (HRI). A hardcopy is available: Center
for Astrophysics, RSDC, MS 3, 60 Garden St., Cambridge, MA, 02138
(http://hea-www.harvard.edu/rosat/rsdc_www/hricalrep.html) - (5) Edge, A.C., Rottgering, H., 1995, MNRAS 277, 1580
- (6) Elvis, M., Schreier, E.J., Tonry, J., Davis, M., Huchra, J.P., 1981, ApJ 246, 20
- (7) Feretti, L., Perola, G.C., Fanti, R., 1992, A&A 265, 9
- (8) Harris, D.E., Pineda, F.J., Delvaille, J.P., Schnopper, H.W., Costain, C.H., Strom, R.G., 1980, A&A 90, 283
- (9) Harris, D.E., Costain, C.H.,Dewdney, P.E., 1984, ApJ 280, 532
- (10) Kriesslar, J.R., Beers, T.C., 1997, AJ 113, 80
- (11) Mack, K.-H., Feretti, L., Giovannini, G., Klein,U., 1993, A&A 280, 63
- (12) Tananbaum, H., Tucker W., Prestwich A., Remillard R., 1997, ApJ 476, 83