Extended and compact X-ray emission from the powerful radio galaxy 3C 220.1
Abstract
We report on ROSAT HRI observations of the radio galaxy 3C 220.1. The X-ray emission from this object consists of an extended component, which we attribute to luminous cluster emission, and a compact central source. The compact component is too bright to be modelled as a cooling flow under some plausible assumptions for the hot gas temperature and distribution; we suggest instead that it is directly related to the core of the radio source. The X-ray flux of the compact component is consistent with the prediction of Worrall et al. (1994) that all powerful radio galaxies should have a central jet-related X-ray emission component that is proportional in strength to the radio core flux density. Other observations of distant 3CR radio sources are consistent with this model.
Subject headings:
X-rays: galaxies — galaxies: active — galaxies: individual (3C 220.1)1. Introduction
In unified models of powerful radio sources (e.g. Barthel 1989) core-dominated quasars, lobe-dominated quasars and radio galaxies are the same objects, with the apparent differences attributed to the effects of relativistic beaming and anisotropic obscuration on a population of sources oriented randomly with respect to the line of sight. In quasars we see the AGN directly, while radio galaxies have their jet axis at large angles to the line of sight so that a torus of gas and dust obscures optical continuum and broad-line emission from the AGN. This torus should also obscure soft X-ray emission originating close to the central engines, leading to suggestions (e.g. Crawford & Fabian 1996) that X-ray emission from powerful radio galaxies should in general be dominated by thermal emission from hot cluster gas. However, an additional X-ray component may arise from the radio-emitting plasma directly, through synchrotron or synchrotron self-Compton radiation, or indirectly, through mechanisms such as the inverse-Compton scattering of external photons. If the different components can be separated, X-ray observations can provide physical insights into the active nucleus, jets and large-scale environment.
There is substantial evidence that unabsorbed radio-related non-thermal X-rays are seen. Fabbiano et al. (1984) first stressed that a correlation between the total soft X-ray and radio-core luminosity in radio galaxies implied a nuclear, jet-related origin for at least some of the X-ray emission. More recent work has strengthened this conclusion, as high-resolution X-ray observations have allowed point-like and extended components to be separated (Worrall & Birkinshaw 1994; Edge & Röttgering 1995; Worrall 1997). Although component separation is generally better for closer, less powerful radio galaxies, compact soft X-ray emission is also seen in powerful narrow-line FRII radio galaxies that are known to lie in sparse environments, where cluster emission is not a source of confusion (e.g. Hardcastle, Birkinshaw & Worrall 1998a). The full complexity is illustrated by X-ray observations of the nearby powerful cluster radio galaxy Cygnus A. EXOSAT and Ginga have found evidence for highly obscured core emission, ( cm-2; Arnaud et al. 1987, Ueno et al. 1994) which should not have been seen with ROSAT, given its low-energy X-ray passband. However, an unresolved core component was detected with the ROSAT HRI (Harris, Perley & Carilli 1994), implying that Cygnus A’s core has both an absorbed and an unabsorbed X-ray component; while the absorbed component may be associated with emission from the AGN, the unabsorbed component may be radio-related (Worrall 1997). Birkinshaw & Worrall (1993) argued in the case of NGC 6251 that a plausible source for such compact X-ray emission is synchrotron self-Compton (SSC) radiation from the base of the radio jet, originating on scales larger than that of the torus and so avoiding absorbtion. Such emission would be suppressed, but not eliminated, by relativistic beaming effects in radio galaxies and [as discussed in Worrall et al. (1994) and references therein] almost certainly dominates the X-ray emission in core-dominated quasars.
It is therefore important in interpreting the X-ray emission from radio galaxies to have spectral or spatial information capable of distinguishing a non-thermal or compact component from thermal or extended emission. High-redshift powerful radio galaxies are important as counterparts to quasars in unified models, and Worrall et al. (1994) performed such a spatial separation for the radio galaxy 3C 280. They showed that the unresolved component fell on an extension of the correlation between X-ray and radio core flux observed for core-dominated quasars, consistent with the model discussed above. In this paper we report X-ray observations of the radio galaxy 3C 220.1 with the ROSAT HRI. We use the high resolution of the HRI to constrain the contributions from compact and extended emission.
3C 220.1 is an FRII (Fanaroff & Riley 1974) narrow emission-line radio galaxy at (Spinrad et al. 1985). With km s-1 Mpc-1 and , used throughout the paper, its 178-MHz luminosity is W Hz-1 sr-1. Radio imaging (Burns et al. 1984; Jenkins, Pooley & Riley 1977; Harvanek & Hardcastle 1998) shows it to be a typical classical double object with largest angular size 35 arcsec (see Fig. 1, inset); at this redshift one arcsecond corresponds to 8.94 kpc, so the projected linear size of 3C 220.1 is about 300 kpc. Burns et al. (1984) report an unusually prominent one-sided jet in the eastern lobe, and the radio core is also comparatively prominent, which may be an indication that the source is significantly affected by relativistic beaming, although no broad emission lines are reported by Spinrad et al. (1985). The prominent radio core, compared with the weak cores of the objects observed by Worrall et al. (1994), was the motivation for the present observations, since it allows us to probe the possible core X-ray and radio association. Optical observations show no evidence for a rich cluster near 3C 220.1, although the presence of a gravitational lens arc with in HST observations implies a deep potential well (M. Dickinson, private communication, 1997).
2. Observations
We observed 3C 220.1 with the ROSAT HRI for a total of 36.2 ks between 1995 Sep 12 and 1995 Sep 18. The data were analysed with the IRAF Post-Reduction Off-line Software (PROS).
An X-ray source is detected with centroid at RA 09 32 39.4 DEC +79 06 27.2 (J2000 co-ordinates are used throughout). This is approximately 4 arcsec from the catalogued position of the optical identification of 3C 220.1 (Laing, Riley & Longair 1983) and from the position of the radio core in the map of Burns et al. (1984), and we identify it with the radio galaxy; offsets of up to 10 arcsec are consistent with the absolute positional errors of ROSAT. There is only one comparably bright source in the HRI field, at 09 31 20.6 +79 01 57.5 (350 arcsec from 3C 220.1, which was on-axis); this is coincident within 4 arcsec (in the same sense as for 3C 220.1) with a faint, blue, point source on sky survey plates (blue magnitude 18.72 in the APS111The Automated Plate Scanner (APS) databases are supported by the National Science Foundation, the National Aeronautics and Space Administration, and the University of Minnesota, and are available at URL: http://aps.umn.edu/. database) and a weak point-like radio source [ mJy at 1.4 GHz in the NRAO VLA Sky Survey; Condon et al. (1997)], but is not identified with any known object. For brevity, we refer to this source as ‘S2’. If the radio and optical identifications of S2 are correct, the radio-optical spectral index (0.4) and optical-X-ray spectral index (1.3) are consistent with its being a background radio-loud AGN (e.g. Stocke et al. 1990).
| Core radius | Central count density in | Counts in point model | Degrees of | ||
| (arcsec) | model (counts arcsec-2) | freedom | |||
| 0.55 | 1.0 | zero assumed | 2.42 | 7 | |
| 0.90 | 13.0 | 0.69 | 6 |
Because we intended to search for extended emission, we defined a large source region of radius 2 arcmin about the centroid of the X-ray emission and a background annulus between 2 and 3 arcmin, excluding regions around two weaker sources close to 3C 220.1. In this region the count rate for 3C 220.1 is counts s-1, or counts in total. With similar source and background regions, S2’s count rate is counts s-1. Vignetting reduces the 1-keV count rate by only per cent at the off-axis distance of S2 (David et al. 1997), so no correction has been applied.
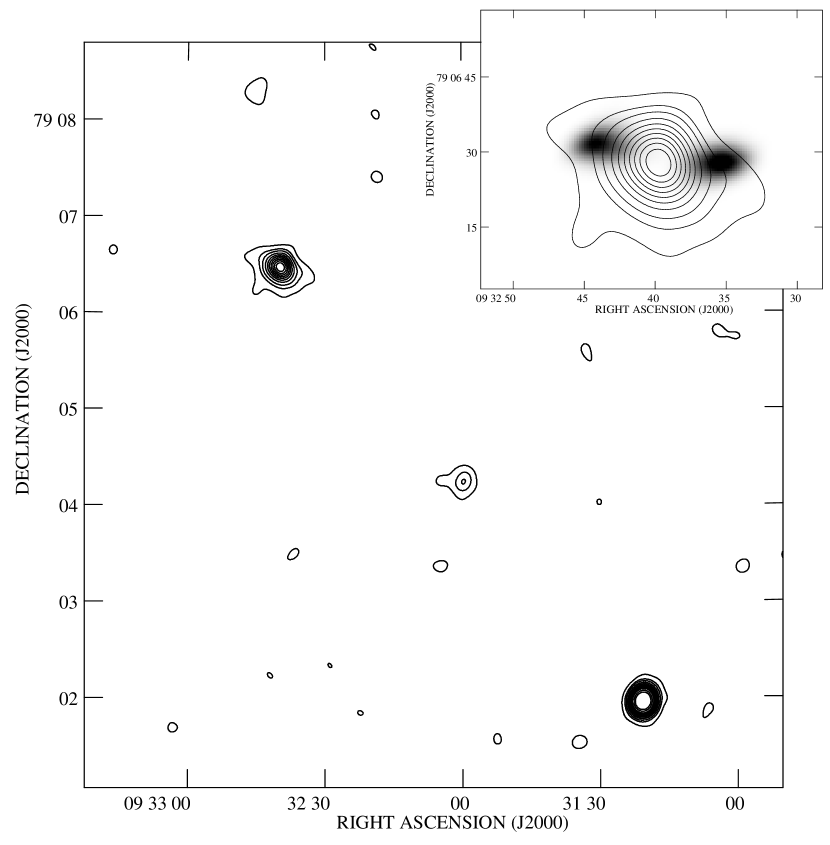


The source associated with 3C 220.1 appears extended (Fig. 1), with an elongation in position angle , close to the position angle of the radio galaxy axis (). It is well known that spurious extension (‘smearing’) can be produced by residual errors in the ROSAT aspect solution; techniques for correcting this (e.g. Morse 1994) at present only work on bright sources. However, any such smearing should apply equally to all sources in a given field. In this case we see that the source S2, comparable in brightness to 3C 220.1, is less extended. Radial profiles for 3C 220.1 and S2 are compared with the nominal PSF for the HRI in Fig. 2. Since S2 is most likely to be a point-like X-ray emitter (see above) the fact that it is by no means perfectly fitted by the nominal HRI PSF suggests that there may be some aspect smearing in the dataset. However, the radial profile of 3C 220.1 is broader still, with a significant excess of counts on scales arcsec from the centroid. This extension cannot be produced by aspect smearing alone.
In order to separate point-like and extended components in 3C 220.1 we need to estimate the form of the radially averaged PSF in the presence of smearing. To do this we assume that S2 is a point source. In general the radial profiles of off-axis sources like S2 are broadened by the mirror blur of the XRT PSF. However, this effect is not significant in the HRI at 6 arcmin off-axis; fits to the datasets of short exposures of bright calibration objects provided with PROS show that the effect becomes significant at arcmin, but that objects at 6 arcmin are best-fitted with a parametrisation of the PSF indistinguishable from the on-axis case. These results agree with the analysis of David et al. (1997) and with their empirical expression for the change in PSF with off-axis angle; G. Hasinger (private communication, 1998) has analysed a large number of sources from the ROSAT HRI Results Archive and come to the same conclusion. We can therefore conservatively estimate the effects of aspect smearing on 3C 220.1 by using the radial profile of S2 as a description of the PSF. This profile is well described ( for 7 degrees of freedom) by the nominal PSF broadened with a Gaussian of FWHM arcsec, whereas 3C 220.1 is not acceptably fit with this model ( for 7 d.o.f.; see Fig. 2.) In what follows we use the broadened PSF based on S2 for model fitting.
The degree of extension in 3C 220.1 may be quantified by fitting models to the radial profiles of the sources. The models we use are -models (Sarazin 1986) or -models with an additional central point source. A -model is physically appropriate if the extended emission originates in hot gas in hydrostatic equilibrium and [as discussed by Birkinshaw & Worrall (1993)] provides a useful way of assessing scales of extended emission even when the origins of the emission are not known. We choose from a range of possible values between 0.35 and 0.9 and vary the core radius between 0.1 and 100 arcsec. The free parameters of the fit are the normalisation of the model and of the point-like component if one is present; there are therefore either 7 or 6 degrees of freedom in the fit.

The results obtained are shown in Fig. 3. The best-fit model has and a core radius of 13 arcsec ( with 6 degrees of freedom). The point source in this model has a count rate of count s-1, and so provides 40 per cent of the total flux. The model with a point source is significantly better (at the 99 per cent level on an F-test) than the best-fit model consisting of a beta-model alone. Best-fit values are tabulated in Table 1.
3. Discussion
3.1. Origin of the extended emission
The extended emission around 3C 220.1 may be thermal radiation from gas on cluster or group scales. We use the luminosity-temperature relationship derived by David et al. (1993) to estimate a self-consistent cluster luminosity and temperature, ignoring effects of evolution. The steep best-fit s mean that any additional contribution to the luminosity from low-surface-brightness outer regions below the detection threshold should be less than 15 per cent, so errors caused by this effect are not significant. Using the best-fit model the rest-frame 2-10 keV luminosity of the extended emission would be erg s-1, corresponding to a cluster temperature of 5.6 keV. [We assume galactic absorption corresponding to cm-2 (Stark et al. 1992) and use a Raymond-Smith model with elemental abundance 30 per cent solar.] This luminosity is comparable to those of other distant radio galaxies and to those of moderately rich clusters [Crawford & Fabian (1996); the 0.7-2 keV total luminosity of the source, for comparison with their values, is erg s-1]. The core radius of 120 kpc is comparable to those seen in nearby clusters of comparable luminosity (e.g. Jones & Forman 1984).
Birkinshaw & Worrall (1993) provide convenient relationships between and the normalising central count rate of a -model and physical parameters such as the density and pressure. Applying their analysis to the best-fit -model we find a central density of cm-3 and a central cooling time for the gas of 4.5 Gyr for keV. This corresponds to a cooling flow with mass deposition rate yr-1, although the average cooling time within the core radius is comparable to the Hubble time. We discuss the implications of a cooling-flow model below.
The fact that the X-ray emission has a similar apparent size to the radio lobes and is extended roughly in the same direction might seem to motivate an explanation in terms of inverse-Compton emission from the lobes themselves, but investigation shows that neither the photon density in the cosmic microwave background radiation nor that in a putative hidden quasar (Brunetti, Setti & Comastri 1997) is sufficient to produce extended emission of this luminosity. We therefore adopt a thermal model for the extended emission in what follows.
3.2. Origin of the point-like emission
If the extended emission is thermal a cooling flow may be present. Unresolved emission at this distance has a spatial scale of kpc, so without more detailed information on the spatial and spectral X-ray properties of the source we cannot rule out the central spike in a cooling flow as the origin of some or all of the compact component of the X-ray emission. However, we can estimate the contribution of a cooling flow by making some plausible assumptions about the temperature and density variation of the gas.
We assume that the isothermal -model with core radius and gas temperature (as estimated above) describes the source adequately at large radii. Let be the central normalising density for this -model, as usual. We assume that cooling is only important inside the cooling radius ; let the density at the cooling radius be . Then the density profile in the cluster, assumed to be continuous, is taken to be
is a small inner limiting radius inside which density is constant; this avoids an infinity at . At , the density follows the model; so is fixed, by continuity, in terms of , and . Inside the cooling radius, the density is taken to vary as . This dependence on radius is a reasonable approximation to the correct, temperature-dependent behaviour (e.g. Sarazin 1986). Since cooling flows are slow, we assume that the pressure at a given of the cooling gas is the same as the pressure in the reference -model at an equivalent radius. The temperature in the cooling gas is then
and this assumption also forces pressure balance at and . Finally, we use PROS to compute the emissivity, in ROSAT HRI counts s-1 per unit emission measure, of the gas as a function of temperature, taking into account the redshift of the source, galactic neutral hydrogen column density, and the energy bandpass of the instrument. Models can then be fitted to the radial profile of the source.
The choice of cooling radius is to some extent arbitrary. We used the -model fits to set as the radius where cooling time was yr; in the best-fit model this is 12 arcsec, but the results are only weakly sensitive to moderate changes in cooling radius. The model is also only weakly dependent on ; we chose a value corresponding to 0.01 arcsec. The effect of the cooling flow, as expected, is to reduce the contribution required from an additional central point source, but with these assumptions the cooling flow does not render a point source unnecessary. The best-fit point source contributions in this model correspond to counts s-1, so that approximately 30 per cent of the central component is contributed by the cooling flow; the errors assigned are , derived by allowing and core radius to vary and determining cooling radius as above. As expected, the obtained in fitting the cooling flow and point source model is indistinguishable from that due to a model and point source.
Since the point-like component cannot, under these plausible assumptions, all be attributed to a cooling flow, it may be more directly associated with the AGN. Assuming a power-law spectrum with a spectral index , the counts associated with the compact component (after subtraction of the cooling flow model) correspond to a 1-keV flux density of nJy222For comparison, when we performed exactly the same analysis using the nominal HRI PSF, instead of that described by S2, we found a 1-keV flux of nJy., where the errors are the formal confidence limits provided by the fitting process. We plot this flux against the 5-GHz radio core flux density (25 mJy: Giovannini et al. 1988) together with the objects from Fig. 3 of Worrall et al. (1994) in Fig. 4. It will be seen that 3C 220.1 has both a higher radio core flux density and a higher core X-ray flux density than the object (3C 280) studied by Worrall et al. (1994); this is in the sense of their prediction that X-ray core luminosity should correlate with radio core luminosity. The X-ray flux density of the compact component in 3C 220.1 places it slightly above the line of slope unity plotted by Worrall et al. through the core-dominated quasars. For comparison we plot the X-ray and radio core flux density of Cygnus A, which can be seen to lie very close to the line, in good agreement with the correlation (Worrall 1997). Other existing data on high-redshift radio galaxies (e.g. Crawford & Fabian 1996) are also consistent with this result, although unfortunately these additional sources are upper limits in either or both of the X-ray (due to non-detection or non-separation of unresolved emission) and radio (due to undetected radio cores) flux densities.
4. Conclusions
We observed 3C 220.1 in order to test the hypothesis of Worrall et al. (1994) that all powerful radio sources exhibit a compact X-ray component related to their radio core. We find that there is strong evidence for a compact X-ray component in this object, that it is too bright to be attributed to a cooling flow under some simple assumptions, and that it follows the expected positive correlation between radio and X-ray core flux or luminosity. 3C 220.1 lies slightly above the line of slope unity plotted through the core-dominated quasars (Fig. 4). Together with its unusually prominent radio core and one-sided radio jet, this may be an indication that we are viewing the source at an angle to the line of sight which is close to the radio galaxy-quasar boundary, so that its central X-ray emission includes a non-jet-related component originating close to the AGN.
Extended X-ray emission is also unequivocally detected around 3C 220.1, with core radius and luminosity comparable to that of nearby rich clusters. This is qualitatively consistent with the HST detection of a gravitational lensing arc near the source.
References
- (1) Arnaud K.A., Johnstone R.M., Fabian A.C., Crawford C.S., Nulsen P.E.J., Shafer R.A., Mushotzky R.F., 1987, MNRAS, 227, 241
- (2)
- (3) Barthel P.D., 1989, ApJ, 336, 606
- (4)
- (5) Birkinshaw M., Worrall D.M., 1993, ApJ, 412, 568
- (6)
- (7) Brunetti G., Setti G., Comastri A., 1997, A&A, 325, 898
- (8)
- (9) Burns J.O., Basart J.P., de Young D.S., Ghiglia D.C., 1984, ApJ, 283, 515
- (10)
- (11) Condon J.J., Cotton W.D., Greisen E.W., Yin Q.F., Perley R.A., Taylor G.B., Broderick J.J., 1997, available at URL ftp://gibbon.cv.nrao.edu/pub/nvss/paper.ps
- (12)
- (13) Crawford C.D., Fabian A.C., 1996, MNRAS, 282, 1483
- (14)
- (15) David L.P., Harnden F.R., Kearns K.E., Zombeck M.V., Harris D.E., Prestwich A., Primini F.A., Silverman J.D., Snowden S.L., 1997, U.S. ROSAT Science Data Center report, available at URL: http://hea-www.harvard.edu/rosat/rsdc_www/hricalrep.html
- (16)
- (17) David L.P., Slyz A., Jones C., Forman W., Vrtilek S.D., 1993, ApJ, 412, 479
- (18)
- (19) Edge A.C., Röttgering H., 1995, MNRAS, 277, 1580
- (20)
- (21) Fabbiano G., Miller L., Trinchieri G., Longair M., Elvis M., 1984, ApJ, 277, 115
- (22)
- (23) Fanaroff B.L., Riley J.M., 1974, MNRAS, 167, 31P
- (24)
- (25) Giovannini G., Feretti L., Gregorini L., Parma P., 1988, A&A, 199, 73
- (26)
- (27) Hardcastle M.J., Birkinshaw M., Worrall D.M., 1998a, MNRAS, 294, 615
- (28)
- (29) Hardcastle M.J., Worrall D.M., Birkinshaw M., 1998b, MNRAS, 296, 1098
- (30)
- (31) Harvanek M., Hardcastle M.J., ApJS, in press, astro-ph/9805363
- (32)
- (33) Harris D.E., Perley R.A., Carilli C.L., 1994, in Courvoisier T.J.-L., Blecha A., eds, Multi-wavelength continuum emission of AGN, IAU Symposium 159, Kluwer, Dordrecht p. 375
- (34)
- (35) Jenkins C.J., Pooley G.G., Riley J.M., 1977, MmRAS, 84, 61
- (36)
- (37) Jones C., Forman W., 1984, ApJ, 276, 38
- (38)
- (39) Laing R.A., Riley J.M., Longair M.S., 1983, MNRAS, 204, 151
- (40)
- (41) Morse J.A., 1994, PASP, 106, 675
- (42)
- (43) Sarazin C.L., 1986, Rev. Mod. Phys., 58, 1
- (44)
- (45) Spinrad H., Djorgovski S., Marr J., Aguilar L., 1985, PASP, 97, 932
- (46)
- (47) Stark A.A., Gammie C.F., Wilson R.W., Bally J., Linke R.A., Heiles C., Hurwitz M., 1992, ApJS, 79, 77
- (48)
- (49) Stocke J.T., Morris S.L., Gioia I., Maccacaro T., Schild R.E., Wolter A., 1990, ApJ, 348, 141
- (50)
- (51) Ueno S., Koyama K., Nishida M., Yamauchi S., Ward M.J., 1994, ApJ, 431, L1
- (52)
- (53) Worrall D.M., 1997, in Ostrowski M., Sikora M., Madjeski G., Begelman M., eds, Relativistic jets in Active Galactic Nuclei, Astronomical Observatory of the Jagiellonian University, Cracow, p. 20 (astro-ph/9709165)
- (54)
- (55) Worrall D.M., Birkinshaw M., 1994, ApJ, 427, 134
- (56)
- (57) Worrall D.M., Lawrence C.R., Pearson T.J., Readhead A.C.S., 1994, ApJ, 420, L17
- (58)

Note added in proof: The model discussed in section 3.2, while giving a good qualitative representation of some cooling flows, is not a physically consistent description of the cooling gas. (We thank A.C. Fabian for pointing this out to us.) We have developed improved cooling-flow models in which pressure varies as . These models exhibit a power-law dependence of density and temperature on radius, roughly match the mass implied by the gravitational arc, and have realistic mass profiles. For reasonable choices of the model parameters, the central X-ray profiles have broader wings than the model in section 3.2. When fitted to the data, they tend to give fits worse than that provided by the best-fit model with point source described in section 2. The limit on the contribution of a cooling flow to the X-ray flux of the central source given in section 3 therefore remains valid.