BeppoSAX Observations of the TeV Blazar Mkn 421
Abstract
The blazar Mkn 421 has been observed, as part of the AO1 Core Program, five times from 2 to 7 May 1997. In the LECS+MECS energy band the spectrum shows convex curvature, well represented by a broken power–law. Flux variability (more than a factor 2) has been detected over the entire 0.1–10 keV range, accompanying which the spectrum steepens with the decrease in intensity. Mkn 421 has also been detected with the PDS instrument. Our preliminary analysis indicates that the PDS spectrum lies significantly above the extrapolation from the MECS, suggesting a contribution from a flatter high energy component.
1 Introduction
Mkn 421 is one of the best known and studied BL Lac objects. It shows optical polarization, flat radio spectrum, and large variability, characteristics of the blazar class. It is bright in X–rays, where it shows prominent flares accompanied by significant spectral changes [1].
Among GeV–emitting blazars, Mkn 421 is unique in being the first object in which the –ray emission is detected to extend up to TeV energies ([2, 3]), at a level allowing detailed spectral and variability studies in the broadest available range of frequencies. Its GeV (EGRET) –ray emission connects smoothly with the E0.5 TeV spectrum (e.g. [4]). On the contrary the X–ray spectrum, up to 10 keV, did not show any hint of the onset of the inverse Compton component responsible for GeV and TeV emission. It was then of great interest to take advantage of the full capabilities of BeppoSAX, enabling a spectral coverage up to 200 keV, to look for it. At the same time the fact that in the X–ray band we are observing the emission from the highest energy tail of the emitting–particle distribution could provide important clues on particle acceleration and cooling mechanisms.
The Mkn 421 observations discussed here are part of the AO1 Core Program dedicated to bright blazars. The data reduction presented here has been generally performed with software released before September 1997. Data reduction with the updated software for all the on board instruments, and a more detailed analysis, will be presented in forthcoming paper with all appropriate references.

| Pointing | LECS | LECS | MECS | MECS | MECS |
|---|---|---|---|---|---|
| Start Date | exp. time | [0.1–4 keV] | exp. time | [1.5–10 keV] | [4/4 keV] |
| (ksec) | (cts/s) | (ksec) | (cts/s) | (cts/s) | |
| 2/V/1997 @ 04:10 | 4.4 | 11.4 | (2.14/0.72) | ||
| 3/V/1997 @ 03:24 | 4.3 | 11.7 | (1.28/0.41) | ||
| 4/V/1997 @ 03:25 | 4.9 | 12.2 | (0.81/0.22) | ||
| 5/V/1997 @ 03:32 | 4.9 | 11.9 | (1.52/0.35) | ||
| 7/V/1997 @ 04:47 | 6.0 | …. | …. | …. |
2 Observations and Data reduction
For an exhaustive description of the Italian/Dutch BeppoSAX mission we refer to [5]. The observations of Mkn 421 were performed as part of the BeppoSAX AO1 Core Program between May 2nd and May 7th 1997. In this period Mkn 421 has been observed 5 times, for a total effective exposure of 47.2 ksec in the MECS and 24.5 ksec in the LECS. A journal of observations is given in Table 1. MECS data are not available for May 7th because of the failure of the detector unit 1 on May 6th.. The present analysis is based on the SAXDAS linearized event files for the LECS and the three MECS experiments, together with appropriate background event files, and PDS as produced at the BeppoSAX Science Data Center (rev0.0).
3 Data analysis and results
Light curves and spectra for the LECS and the three MECS have been accumulated using the SAXselect tool. Events were extracted from within a radius of 8’ and 4’ for the LECS and MECS images, respectively. These selected events were then used to construct the light curve and to accumulate energy spectra for each pointing. LECS data have been considered only in the range [0.12–4] keV due to calibration problems at higher energies (Guainazzi 1997, private comm.). Spectral analysis has been performed with the XSPEC 9.0 package, using response matrices released on December 1996.


| Date | Instrument | Model | Ebreak | () | ||
|---|---|---|---|---|---|---|
| (keV) | ||||||
| May 2 | LECSc | P.L. | 1.19 | — | — | 3.99 (32) |
| LECSc | broken P.L. | 1.04 | 1.20 | 1.49 | 0.94 (30) | |
| MECS | P.L. | 1.73 | — | — | 1.25 (54) | |
| MECS | broken P.L. | 1.65 | 4.24 | 1.89 | 1.02 (52) | |
| LECS+MECSc,d | broken P.L. | 1.05 | 1.51 | 1.73 | 1.27 (48) | |
| May 4 | LECSc | P.L. | 1.41 | — | — | 2.82 (32) |
| LECSc | broken P.L. | 1.30 | 1.13 | 1.68 | 1.70 (30) | |
| MECS | P.L. | 2.00 | — | — | 1.00 (54) | |
| MECS | broken P.L. | 1.67 | 2.93 | 2.15 | 0.74 (52) | |
| LECS+MECSc,d | broken P.L. | 1.35 | 3.33 | 2.03 | 2.94 (56) | |
| (a) Quoted errors are at 1 , computed for value of appropriate for the number of interesting parameters; (b) The hydrogen equivalent column density nH has been fixed at the Galactic value. Adopted value is 1.61 1020cm-2, from Lockman and Savage 1995; (c) LECS data in the restricted range 0.3–4. keV; (d) MECS data in the restricted range between 3–10 keV. | ||||||
Temporal analysis the LECS and MECS light curves during the 7 days spanned by BeppoSAX pointings are shown in Fig. 1.
MECS data have been divided in two energy bands, below and above 4 keV, in order to better show the different variability amplitude at different energies. There is evidence of a significant spectral variability between the May 2nd and May 4th states. The LECS count rate changes of a factor 2.2, while in the higher MECS band (E 4.0 keV) the change is of a factor 4.
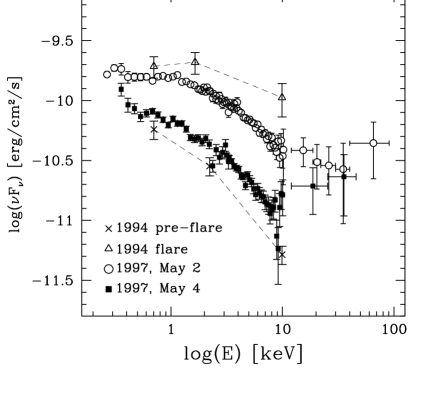
Spectral analysis LECS, MECS the source was quite bright (see Fig. 3 for a comparison) and consequently the data are of good quality enabling us to extract spectra from each observation. A word of caution is necessary about the presence of localized features probably related with calibration problems yet to be solved (e.g. 2 keV where there are Gold features due to the optics), At the present stage we only performed a preliminary analysis aimed at studying the continuum properties and their temporal variability. Moreover, here we only concentrate on analysis and results concerning the highest and lowest states observed by BeppoSAX, on May 2nd and May 4th respectively.
The resulting accumulated LECS and MECS data have been fitted with a variety of combination of single and broken power law models to better describe the marked spectral curvature. The main results of spectral fits are reported in Table 2, and the “reconstructed” spectra are shown Fig. 3. Fig. 2a shows the deviation of the data (LECS+MECS, May 2nd) from a single power law model with Galactic absorbing column density (NH = 1.61 cm-2 [6]). It is clear that this model does not provide a satisfactory fit to the data ( for 48 ) which require a flatter component below 1 keV, and steeper one beyond 3 keV. Fig. 2b shows the deviations with respect to a broken power law model giving a marginally acceptable fit (, see Table 2, P 10 %). Apart from localized features it is still noticeable a steepening trend above 4 keV, although consistent with the adopted model. As can be seen in Table 2 the broken power law model gives a better fit both in LECS and MECS energy ranges. LECS data, even though in the restricted interval 0.1–4.0 keV are not consistent with a unique spectral index. Values of and (LECS MECS) clearly trace the continuous spectral steepening of the 0.1–10 keV spectrum. Both May 2nd and 4th 0.3 – 10 keV spectra show a (see Table 2 LECS MECS broken P.L.). On the other hand there is a marked spectral change accompanying the flux change, in the sense of a steepening in the lower state, for E keV (, ).
PDS The source was weakly detected in the PDS at E 15 keV, although with low significance ( 2–3 ), on May 2nd up to 90 keV, on May 4th only up to 50 keV. Spectral analysis turns out to be delicate and is in progress. Results about PDS data are thus very preliminary. PDS data are in excess with respect ot the extrapolation of the very steep () 4 keV spectrum, suggesting a contribution from a harder spectral component (see Fig. 3). Results will be presented in a forthcoming paper.
4 Conclusions
BeppoSAX dat aof Mkn 421 shows interesting variability both in flux and in spectral shape, with a marked softening corresponding to decreasing brightness. This kind of spectral variability behavior is well known in the X–ray band for sources of the class of Mkn 421, the so called High-Frequency-Peaked BL Lacs (HBL). In general in blazars at energies just above the synchrotron peak it the relationship harder-when-brighter holds and is generally interpreted in terms of injection of fresh electrons in the highest energy end of a single population.
On May 2nd the peak of the synchrotron component could possibly fall in/or just below the LECS band, while in the lower state of May 4th this is not longer true.
Moreover, preliminary analysis of PDS data suggests the presence of a deviation from the continuously downward curvature for E keV, possibly being the signature of the onset of a different harder spectral component.
Further temporal and spectral analysis, also with comparison of multifrequency data and comparison with model predictions is in progress.
References
- [1] Takahashi T., et al. 1996, 470, L89
- [2] Punch M., et al. 1992, Nature, 358, 477
- [3] Krennrich F., et al. 1997, ApJ, 481, 758
- [4] Macomb D.J., et al. 1995, ApJ, 449, L99
- [5] Boella G., et al., 1997, A&AS, 122, 299
- [6] Lockman F. J., Savage B. D. 1995, ApJS, 97,1.