A first look at blazars with BeppoSAX
Abstract
I describe a general framework that could allow to understand the broad band spectra of blazars and lead to a unified picture of the emission from relativistic jets, in BL Lac objects as well as in flat spectrum, radio loud Quasars. The scheme serves as a useful basis to introduce and discuss some of the most interesting results so far obtained on Blazars with BeppoSAX.
1 Introduction
The ”blazar phenomenon” is due to the presence of relativistic flows (jets) emanating from the nuclei of active galaxies which are radio loud. The power to energize the radio lobes is transported in the jets. Blazars are the subset of radio loud AGN for which the relativistic jet happens to point at small angles to the line of sight. Since the radiation emitted by the jet is relativistically beamed into a narrow cone along the direction of motion, the aligned observer will receive a strongly enhanced flux. For a bulk Lorentz factor at an angle the flux enhancement factor is .
The evidence in favor of this picture has been accumulating and is now solid (e.g. [25] and refs therein) although the origin of the jets is poorly understood and their physical parameters are highly uncertain. The relativistically amplified, non thermal emission from high energy particles in the jet can account for the extreme properties of blazars concerning variability, polarization and energy distribution of the continuum, which extends from the radio to the gamma-ray band.
Traditionally BL Lac objects, where no prominent emission lines are observed (with an upper limit of 5 Å), were thought to represent a separate class perhaps more extreme than Quasar-like blazars. The latter include optically violently variable and highly polarized quasars (OVV, HPQ) or more generally Quasars with flat radio spectrum (FSRQ) indicating strong emission from the self absorbed core. It has become clear however that BL Lacs have on average lower luminosity than quasar like blazars ([19]) and that the distribution of emission line equivalent widths is continuous ([22]). We will therefore in the following consider blazars as a single class of objects, implicitly assuming that, irrespective of the emission line properties which derive from the surrounding gas, the same physical mechanisms operate in relativistic jets over a wide range of luminosities.
By studying the blazar continuum we expect to learn about the radiation mechanisms in the jets, about the processes of particle acceleration and energy transport along the jets and ultimately about their origin and evolution.
2 The broad band spectra of blazars
The discovery by EGRET on board CGRO of copious -ray emission from blazars caused a ”Renaissance” in this field. In fact it had been noted early on that the high density of relativistic electrons necessary to produce the observed compact synchrotron emission would lead to strong, even catastrophic inverse Compton radiation ([13]). X-ray measurements were used to constrain the amount of inverse Compton emission allowed and to derive minimum values for the necessary beaming factors (e.g. [4]). At present the -ray observations allow to measure the intensity and spectral shape of a component which contains a substantial fraction and in some cases the bulk of the emitted power leading to strong constraints on the physical parameters of the emitting region.
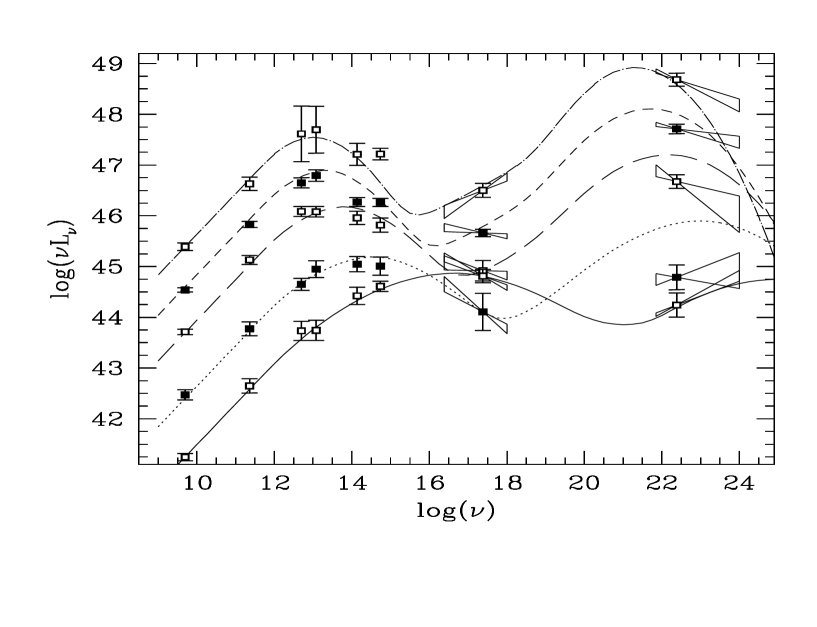
It is clearly important, besides observing single objects, to try to derive general properties of the continuum and understand whether and how they differ for instance in BL Lac objects and FSRQ. It is especially interesting to discuss whether the gamma-ray emission is a general property of the whole class. We have recently addressed this problem ([1]) collecting multifrequency data for three complete samples of blazars: the 2 Jy sample of FSRQs, the 1Jy sample of BL Lac objects and the sample of BL Lacs selected in the X-ray band from the Einstein Slew Survey. Systematic differences in the shape of the continuum in specific spectral bands among different subclasses of blazars were noted early on (e.g. [3, 14, 28, 21, 24]. In particular we note that the percentage of objects detected with EGRET (100 MeV - 10 GeV) is significantly larger for the sample of FSRQ than for the two BL Lac samples (40 % vs. 26% and 17% respectively. Nevertheless plotting the average SEDs as shown in Fig. 1, we can see that the shapes are ”globally similar”.
In Fig. 1 all blazars in the three complete samples were merged and grouped in luminosity classes irrespective of their original classification and the dashed lines drawn for comparison derive from an analytic parametric representation ([1]).
The main results of this work are the following:
-
•
two peaks are present in all the SEDs
-
•
the first peak occurs at lower frequencies for the highest luminosity objects
-
•
the frequency at which the second peak occurs correlates with that of the first one. The dashed curves correspond to a constant ratio between the two peak frequencies.
For the most luminous objects the first peak is at frequencies lower than the optical band while for the least luminous ones the reverse is true. Thus highly luminous objects have a ”red” (steep) IR to UV continuum while objects of lower luminosity have a bluer IR to UV continuum. For this reason and to recall intuitively the location of the peaks on the frequency axis we will briefly call ”red” blazars the objects in the three highest luminosity classes and ”blue” blazars those in the two lower luminosity classes. The present data suggest a continuous spectral sequence and no absolute separation between red and blue blazars.
Considering the continuum of different objects in a fixed spectral range its shape changes systematically with luminosity along the sequence, as the peak frequency approaches and moves across the chosen frequency interval. In particular the X-ray spectrum becomes steeper and the gamma-ray spectrum (in the EGRET range) becomes flatter from ”red” to ”blue” blazars, as the two peaks march to higher frequencies. The different location of the gamma-ray peak can account for the different detection rates of BL Lacs and FSRQs by EGRET. Objects whose -ray emission peaks in the EGRET range are more easily detected.
Recently ground based observations in the TeV range performed with Cherenkov telescopes have detected two of the X-ray brightest ”blue” blazars (refs). We expect that with the progress in sensitivity many more will be detected giving access to the study of the highest energies from ground.
A final comment concerns variability. It is interesting to note that the largest variability is usually observed close to or above each of the two peaks and is usually in the sense of a hardening of the spectrum at higher intensity. These statements are based mostly on observations at high energies (X-rays and gamma-rays) and concern a limited number of sources (e.g. [24]) therefore they should be considered as tentative suggestions rather than established facts.
3 Interpretation
It is generally thought that the first spectral component peaking at far infrared up to X-ray frequencies is due to synchrotron radiation. The spectra from the radio to the submm range most likely involve contributions from different regions of the jet with different self absorption turnovers. However, from infrared frequencies upwards the synchrotron emission should be thin and could be produced essentially in a single homogeneous region. Inverse Compton scattering of soft photons by the high energy electrons emitting the thin synchrotron radiation could be responsible for the second ( high frequency) component of the SED, peaking in the gamma-ray band. The soft photons could be the synchrotron photons themselves (SSC) or photons outside the jet (EC), possibly produced by an accretion disk or torus and scattered or reprocessed by the surrounding gas (e.g [23], [24] and refs therein).
If the same region is responsible for the two spectral components then, irrespective of the nature of the seed photons, the two peaks must derive from the same high energy electrons. Therefore a change in the density and/or spectrum of those electrons is expected to cause correlated variability at frequencies close to the two peaks. In the SSC model the inverse Compton intensity is expected to vary more than the synchrotron one, approximately as the square of it in the simplest case while in the EC model one expects a linear relation ([6]).
Measuring the two peaks simultaneously is thus the best means to determine the physical parameters of the emission region and studying the variability of the spectra around the peaks yields unique insight into the mechanisms of particle acceleration and energy loss in the jet. The variability correlation should enable to disentangle the contribution of different sources of seed photons (SSC vs. EC).
The ”spectral sequence” discussed above could be attributed to a systematic dependence of the critical electron energy (the break energy) and/or of the magnetic field on luminosity. Assuming that the beaming factors are not significantly different along the sequence, the trend in apparent luminosity is also a trend in intrinsic luminosity. In the SSC model the break energy of the electrons is univocally determined by the ratio of the frequencies of the two peaks and should therefore be approximately constant. ”Red” blazars should then have lower magnetic field than ”blue” blazars. Systematic model fitting of all the -ray detected blazars with sufficient multifrequency data suggest that as the magnetic energy density decreases the external photon energy density becomes important so that a smooth transition between the SSC and EC scenario takes place ([7]).
4 SAX observations
The X-ray band is crucial for a discussion of the above problems in that the synchrotron and inverse Compton components which have different spectral shapes may both be relevant. Simultaneous observations over a broad energy range are required to disentangle the two mechanisms. The unique characteristics of the BeppoSAX instrumentation appear therefore ideal for blazar studies. Observations of bright blazars detected in –rays were proposed with the main aims of:
-
•
determining the spectral shape up to the 100 keV range, thus exploring the connection between X-rays and gamma-rays
-
•
studying the variability in relation with other wavebands, especially –rays.

In the following I will briefly mention and comment some of the most interesting results obtained so far. Besides 3C 273 ([11]) which is probably intermediate between a blazar and a ”normal” quasar, two flat spectrum radio quasars, 3C 279 and PKS 0528+134, were observed (before June 1997) and found in a low intensity state. In the scheme presented above these are ”red” blazars. I will discuss here the first source (also [17]), while for the second one I refer to [9]. Finally I will consider results on ”blue” blazars ( Mrk 421, 1ES 2344+514 and Mrk 501 (see the contributions in this volume [2], [10] and [8] respectively).
It is important to remember that in ”red” blazars the X-ray emission represents the lower energy end of the inverse Compton emission, while for ”blue” blazars it is the high energy end of the synchrotron emission.
4.1 3C 279
The X-ray spectrum measured with BeppoSAX in January 1997, the simultaneously measured optical flux and the quasi simultaneous gamma-ray flux (Hartman, private communication) are shown in Fig. 2 together with other simultaneously measured SEDs obtained at other epochs: the high state observed in June 1991 ([12]), the low state observed in January 1993 ([16]) and the preflare and flare states observed in January - February 1996 ([26]).
At the epoch of the BeppoSAX observations the –ray flux was a factor 6 and 20 weaker respectively than measured in June 1991 and early February 1996. In X-rays the amplitude is smaller but there is a good correlation between the X-ray and gamma-ray fluxes especially in the 2-10 keV band (see Fig. 3 in Maraschi et al. this volume). Note that the fluxes at 1 keV measured by ROSAT and BeppoSAX in the 1993 and 1997 low states are similar However the spectrum measured by BeppoSAX is significantly flatter providing a good connection with the higher –ray flux in 1997. The simultaneity (within one day) of the X-ray (XTE) and –ray peaks during the 1996 flare suggests that the X-ray to gamma-ray emission originates in a single region and that the spectrum hardens with increasing intensity. It is possible that the -ray peak in the SED moves to higher energies at the flare peak.
The situation is much more complex at lower energies. Although there is still a general correlation of the IR-optical-UV fluxes with the gamma-ray intensity on long timescales, the flux variation at optical wavelengths corresponding to the rapid 1996 flare is quite small. Note also that for 3C 279 the (presumed) peak of the synchrotron component falls in an unexplored region of the spectrum, between and Hz.
In the SSC model one expects that the inverse Compton emission varies with the square of the amplitude of the synchrotron emission due to the same electrons (e.g. at the two peaks of the SED). This is compatible with the long term variations but not with the strong rapid flare observed in 1996, where the amplitude in gamma-rays was larger than the square of the optical one. On the other hand if the seed photons for the inverse Compton process are external to the jet, they should not be rapidly variable and the inverse Compton emission is expected to vary linearly with the synchrotron one. Thus neither of the two ”simple” models can adequately account for the multifrequency variability behaviour.
A possible way out is that the seed photons derive from backscattering and/or reprocessing of radiation produced in the jet by gas clouds closely approaching the jet itself ([5]). This model is attractive and needs to be studied in more detail. Another possible way out is that the region emitting the synchrotron radiation is inhomogeneous so that the observed variability is diluted by a more stationary component.
4.2 Blue blazars
The X-ray emission from these objects has been observed to vary dramatically on short timescales at least in the brightest prototypes, PKS 2155-304 and Mrk 421. This can be understood recalling that the X-ray emission represents the high energy end of the synchrotron component: it is therefore due to radiation from the highest energy electrons which have the shortest lifetimes and can vary very rapidly.
A continuous acceleration mechanism must be responsible for maintaining in the source particles which have lifetimes of the order of hours. However the injection mechanism may be continuous only in an average sense or at a low intensity level and episodes of increased injection rate may occur causing variability. The study of flares and of spectral variability associated with them gives direct information on the spectra of the freshly injected/accelerated particles and their subsequent decay to a state of quasi-equilibrium.
The photons upscattered through the inverse Compton process by the highest energy electrons reach TeV energies so that the ”bluest” and brightest sources can be detected from ground based Cherenkov telescopes. This is the case up to now for three objects: Mrk 421, 1ES 2344+514 and Mrk 501. All of them were observed with SAX in the first half of AO1. The simultaneous observation of a source in X-rays and at TeV energies should allow to determine unambiguously the energy of the radiating electrons, the beaming factor, the magnetic field and the energy density of the seed photons. In some cases it may be necessary to take into account that scattering will occur in the Klein Nishina regime.

4.3 Mrk 421
This source has been repeatedly observed with ASCA and at other relevant wavelengths including TeV observations. ([15])
The BeppoSAX observations of Mrk 421 (Fossati et al. this volume) show a decay between two intensity states closely similar to those previously observed with ASCA. The higher state shows a flatter spectrum indicating that the emission peaks at higher energies. In Fig. 3 the BeppoSAX data are compared with the ASCA and TeV data presented by [15].
Mastichiadis and Kirk [18]have shown that this behaviour could be the result of an injection mechanism in which the maximum energy of the injected particles increases. The two ”states” would therefore represent equilibrium states for injection spectra extending to different maximum energies. The fact that the spectral variability observed in 1994 is closely reproduced in the BeppoSAX observations indicates that the involved region is the same (same physical parameters). In addition SAX detected the source at higher energy with the PDS. The preliminary analysis yields a flat spectrum at high energies suggesting that the inverse Compton component becomes dominant in this band. The variation in the PDS is much smaller than in the MECS which is consistent with attributing the hard emission to IC from electrons of much lower energies. An extensive campaign for simultaneous ASCA and TeV observations will take place in the spring of 1998, to which BeppoSAX observations could add significantly.
4.4 1ES 2344+514, Mrk 501
This source is not as well studied as Mrk 421 but shows a similar, more extreme behaviour ([10]). The emission peak was in the medium X-ray range in December 96 and shifted to 20-50 keV during the flare of a factor 2 observed between December 3-7 96.
The most extraordinary spectral variation was found in Mrk 501 ([20], [8]). The source was in a state of strong activity at TeV energies although the 1 keV flux had not increased dramatically. However compared to previous observations the X-ray spectrum had changed dramatically being flatter than or close to 1 up to 100 keV. In correspondence to a large TeV flare , the 1 to 100 keV spectrum hardened still indicating that the emission peak was at or above 100 keV, while past multifrequency measurements showed it to be below 1 keV. Thus in Mrk 501 the shift of the peak frequency was more than a factor 100. Some theoretical implications are discussed by Ghisellini ([8]).
This unprecedented behaviour may be less uncommon than judged at first sight. In fact in the medium X-ray band the intensity behaviour was not exceedingly dramatic and good spectral capabilities up to the hard X-ray band, necessary to reveal the phenomenon, have only recently become available with BeppoSAX.
It is interesting to mention that a spectral survey of BL Lacs selected in relatively soft X-rays yields evidence of some hard X-ray spectra ([27]). Sources which have more or less permanent emission peaks in the hard X-ray range may also exist and have gone undetected so far.
5 Conclusions
The results from the first part of the BeppoSAX AO1 Core Program on Blazars are extremely exciting. Bright -ray blazars can be usually detected up to 50 - 100 keV allowing detailed study of the synchrotron and inverse Compton emission and of the correlations between their temporal and spectral variability.
The observations presented above suggest and support:
-
•
the correlation between the X–ray (1 keV) and –ray (0.1-10 GeV) fluxes, which now holds over a period of 6 years and about a factor 30 in flux change for -rays (3C 279 – PKS 0528 + 154)
-
•
the smaller amplitude of variability of the synchrotron component compared to the high energy one.
-
•
the synchrotron emission peak seems to shift systematically to higher energies during flares (Mrk 421, 1ES 2344+541, Mrk 501)
These results will undoubtedly stimulate new observations and new theoretical approaches. In particular genuinely time dependent models for the acceleration of particles and the spectral evolution of the emitted radiation are needed.
References
- [1] Fossati, G., et al. 1998, MNRAS, in press
- [2] Fossati, G., this volume
- [3] Ghisellini, G., et al., 1986, ApJ, 310, 317
- [4] Ghisellini, G., et al., 1993, ApJ, 407, 65
- [5] Ghisellini, G., and Madau, P., 1996, MNRAS, 286,67
- [6] Ghisellini, G., and Maraschi, L., 1997, ASP Conf. Series, Vol. 100, 436
- [7] Ghisellini, G., at al., 1998, MNRAS, submitted
- [8] Ghisellini, G., this volume
- [9] Ghisellini, G., et al., this volume
- [10] Giommi, P., et al., this volume
- [11] Haardt, F., et al., this volume
- [12] Hartman, R.C., et al., 1996, ApJ, 461, 698
- [13] Hoyle, F., Burbidge, G.R., Sargent, W.L.W., 1966, Nature, 209,751
- [14] Impey, C., and Neugebauer, G., 1988, Astron. J., 95, 307
- [15] Macomb, D.J., et al., 1995, ApJ, 449, L99
- [16] Maraschi, L., et al., 1994, ApJ, 435, L91
- [17] Maraschi, L., et al., this volume
- [18] Mastichiadis, A., and Kirk, J.G., 1997, A&A, 320, 19
- [19] Padovani, P., 1992, MNRAS, 257, 404
- [20] Pian, E., et al., 1998, ApJ, 492, 17
- [21] Sambruna, R.M., Maraschi, L., Urry, C.M., 1996, ApJ, 463, 444
- [22] Scarpa, R., and Falomo, R., 1997, A&A, 325, 109
- [23] Sikora, M., Begelman, M., Rees, M.J., 1994, ApJ, 421, 153
- [24] Ulrich, M.H., Maraschi, L., Urry, C.M., 1997, Annual Rev. of Astron. and Astrof., Vol. 35, 445
- [25] Urry, C.M., and Padovani, P., 1995, PASP, 107, 803
- [26] Wehrle, A., 1998, ApJ, in press
- [27] Wolter, A., et al., this volume
- [28] Worral, D.M., and Wilkes, B.J., 1990, ApJ, 360, 396