The X-Ray Forest: A New Prediction of Hierarchical Structure Formation Models
Abstract
We use numerical simulations of structure formation in a Cold Dark Matter model to predict the absorption lines in the soft X-rays produced by heavy elements in the shock-heated intergalactic medium at low redshift. The simulation incorporates a model for heavy element production in galaxies and the subsequent dispersion of the metals to the intergalactic medium. We analyze in particular absorption lines produced by oxygen, and calculate the ionization stage taking into account the observed X-ray background at the present time. We find that oxygen is fully ionized by the X-ray background in low-density voids, and is mostly in the form of and in the sheets and filamentary regions. Strong absorption lines of and with equivalent widths are produced in filamentary regions of overdensities and temperatures K, located in the outskirts of groups and clusters of galaxies. The line at eV is generally the strongest one in these systems. Our model predicts that any X-ray source (such as a quasar) should typically show about one absorption line with in the interval from to . These lines could be detected with the upcoming generation of X-ray telescopes, and their origin in intervening systems could be confirmed by the association with groups of galaxies and X-ray emitting halos near the line-of-sight at the same redshift. The hot intergalactic medium may be one of the main reservoirs of baryons in the present universe, and the heavy element X-ray absorption lines offer a promising possibility of detecting this new component in the near future.
1 Introduction
Hierarchical theories of the formation of large-scale structure are based on the hypothesis that the gravitational collapse of some type of cold dark matter (i.e., any collisionless matter with a small enough velocity dispersion to allow collapse down to scales much smaller than the observed structure), triggered by initial density fluctuations, is responsible for the formation of galaxies and for the later assembly of groups, clusters, and superclusters of galaxies. This generic scenario has been very successful in explaining a large variety of observations, even though the origin of the initial density fluctuations remains unknown, and simple models are therefore assumed for the primordial power spectrum (generally based on adiabatic, Gaussian, scale-invariant fluctuations).
One of the predictions that have been made from these models, with the use of numerical hydrodynamic simulations, is that despite the wide range of scales over which the baryonic matter is able to collapse (as dark matter halos successively merge from the onset of non-linearity until the present time), a relatively large fraction of baryons should still remain as “intergalactic matter”. This intergalactic medium should be forming a network of shock-heated gas in the form of filamentary and sheet-like structures connected to galaxy clusters and groups, as well as colder gas left out in voids, as is revealed in numerical simulations (e.g., Ostriker & Cen 1996). A similar network of photoionized and shock-heated gas should also be present at high redshift (although at lower temperatures than at the present time, due to the lower velocities of collapse at high redshift), and probably gives rise to the hydrogen Ly forest (e.g., Cen et al. 1994, Hernquist et al. 1996, Miralda-Escudé et al. 1996, Zhang et al. 1997, 1998).
Here, a new prediction based on the same theory of hierarchical clustering and the presence of intergalactic gas shall be studied. It has already been shown observationally that heavy elements are present in the high-redshift absorption systems (Songaila & Cowie 1996 and references therein). It is very likely that many more elements were spread to the intergalactic medium (hereafter, IGM) at later times, either through galactic winds energized by supernova explosions or active galactic nuclei (e.g., Dekel & Silk 1986), or simply by the process of gravitational merging, which can also lead to some gas being ejected from halos back into the IGM (Gnedin & Ostriker 1997). As pointed out by Shapiro & Bahcall (1980) and Aldcroft et al. (1994), heavy elements in the intergalactic medium should cause absorption lines (as well as continuum edges of absorption) on background X-ray sources In fact, for highly ionized, hot gas at , absorption lines from heavy elements are probably the only method of detection, since hydrogen is highly ionized and its absorption lines are very weak. The soft X-ray emission from low-density gas is also very weak and would generally be seen superposed with emission from other structures along the line-of-sight, as well as the Galactic emission. We shall denote these absorption lines by “X-ray forest”, in analogy to the Ly forest caused by hydrogen. The X-ray forest is much more difficult to observe than the Ly forest, due to the lower sensitivity and resolution in the X-ray band. The possibility of observing this X-ray forest has also been discussed by Aldcroft et al. (1994) and Canizares & Fang (1998).
Similar absorption lines may also be detectable in the ultraviolet when the temperature is not very high; these are generally caused by lithium-like ions like . Mulchaey et al. (1996) proposed this as a method to detect halos of hot has in poor groups of spiral galaxies, where the temperature of the halo gas may be too low to have been detected in emission by ROSAT. There is in fact evidence for a population of absorbers among the numerous absorption systems seen in quasar spectra that may arise in hot, collisionally ionized gas (e.g., Burles & Tytler 1996).
In this paper we shall predict some properties of the X-ray forest from a hydrodynamic simulation, and discuss the prospects for detecting it in future X-ray missions.
2 Simulations
We adopt a CDM+ cosmological model in this investigation, with parameters , , and . We adopt the value of for the cosmic baryon density, near the upper limit implied by the deuterium abundance (e.g., Burles & Tytler 1998). We also assume the Harrison-Zel’dovich spectrum of primordial fluctuations, and we normalize the model to COBE according to Bunn & White (1997), which gives us a value for , in agreement with (and slightly on the high side of) cluster abundances from Eke, Cole, & Frenk (1996). We use the linear Boltzmann code LINGER from the COSMICS package (Bertschinger 1995) to compute the linear transfer functions for our initial conditions with sufficient accuracy.
The simulation has been performed with the SLH-P3M cosmological hydrodynamic code (Gnedin 1995; Gnedin & Bertschinger 1996). The physical modelling incorporated in the code is described in Gnedin & Ostriker (1997), and includes dynamics of the dark matter and cosmic gas, evolution of the spatially averaged UV- and X-ray background radiation, star formation, stellar feedback, non-equilibrium ionization and thermal evolution of primeval plasma, molecular hydrogen chemistry, equilibrium metal cooling, and self-shielding of the gas.
We have performed two runs with box sizes of 64 and 32 , and with resolution elements and a dynamical range of 640, in order to have a first estimate of the importance of the missing large-scale power and the finite resolution of our simulations.
3 Photoionization by the X-ray Background
Among the heavy elements that can produce absorption lines in the X-rays, oxygen is the most abundant, so it is natural that it produces the strongest lines. In this paper we shall focus our analysis on oxygen lines. Previous work on X-ray absorption by the IGM (Shapiro & Bahcall 1980; Aldcroft et al. 1994) has shown that the elements producing the next strongest lines are C, N, Ne and Fe; we shall comment only briefly on the absorption lines of these species below. Oxygen in the IGM should be photoionized by the observed X-ray background. The spectrum of the X-ray background is well fitted by the following formula (see Boldt 1987, Barcons & Fabian 1992):
| (1) |
where , and the normalization is . A useful and simple example of the resulting ionization equilibrium is the case of and , i.e., fully ionized oxygen and the hydrogenic oxygen ion, in conditions of high ionization where the abundance of and any lower ionization species is negligible. In this case, hydrogen and helium should be fully ionized and charge transfer can be neglected. Since is a hydrogenic ion, the photoionization cross section and radiative recombination coefficient are easily related to the same quantities for hydrogen: , and . The photoionization rate for is . The redshift evolution of the X-ray background is uncertain, depending on the luminosity function of X-ray sources. Here we shall simply assume , which is reasonable if the present sources make only a modest contribution to the background. Defining the normalized electron density as the ratio to the mean electron density if all baryons were fully ionized, , with , the recombination rate to is .

We show in Figure 1 the fractional abundance of and in equilibrium, as a function of the baryon density, for the X-ray background spectrum given above at , and a gas temperature for the three curves plotted. These have been calculated with the code CLOUDY 90 (Ferland 1996). The mean baryonic density at is marked by a vertical dashed line. Oxygen is mostly fully ionized in regions with density , due to photoionization from the X-ray background. The fraction of at these low densities is determined by the balance between photoionization and radiative recombination, and is therefore proportional to the density, just like for neutral hydrogen in the Ly forest. Collisional ionization at these temperatures is negligible in comparison. At overdensities , the fractional abundance reaches a maximum and then starts to recombine to at higher densities, so the fractional abundance is then inversely proportional to the density, if oxygen is mostly in the form of . At very high densities (or high temperatures), collisional ionization dominates.
We have assumed photoionization equilibrium to calculate the abundance of throughout the simulation. Notice that this assumption is actually not very good, since the photoionization time is of the order of the Hubble time. A more accurate calculation would need to follow the time-dependent evolution of the ionization fraction in every fluid element as the simulation is run, but we have not implemented this in the simulations presented here.
4 Results
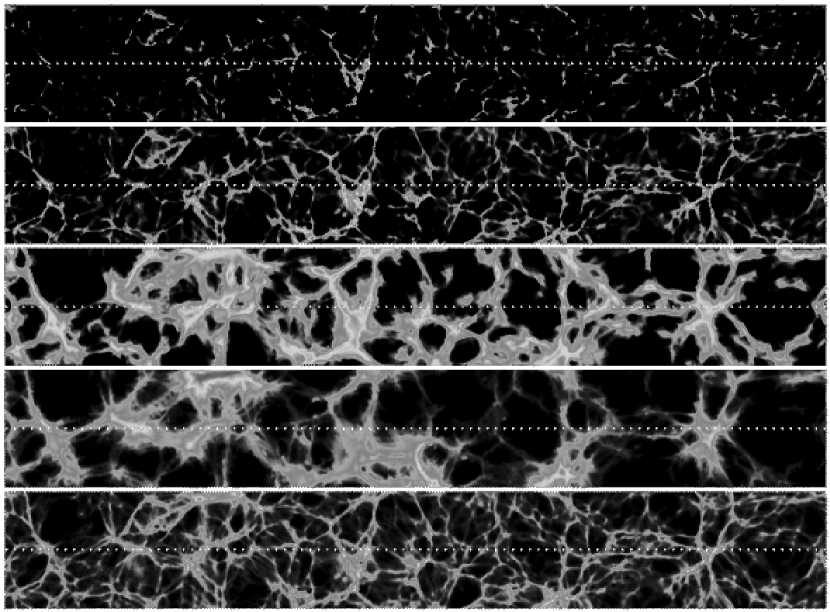
A slice of the simulation in the box at redshift (of infinitesimal thickness) is shown in Figure 2 (Plate 1). The five panels from the top to the bottom show density, density, gas metallicity, temperature, and density. The slice has been randomly selected: first, a random line-of-sight (shown as a white dotted line in Fig. 2) along a random direction through the box was chosen, and then a slice containing this line-of-sight was selected at a random angle. The width of the slice shown is , and its length is .
The characteristic filamentary structure connecting collapsed clusters is apparent. A fraction of about 50% of the baryons in this simulation are in regions with overdensities between 1 and 100, corresponding to the filaments, with typical temperatures of , and a fraction 6% are at overdensities between 100 and 1000, corresponding to the outer parts of cluster halos, with typical temperatures . The metallicity of these regions is of order in the simulation, caused by the ejection of metals from halos during gravitational mergers (Gnedin & Ostriker 1997). In reality, possible mechanisms of enrichment of the IGM are very uncertain, so the value of the metallicity should be considered as a poorly known parameter, and of course the column densities of the absorption lines we shall infer vary proportionally to the assumed metallicity. About 20% of all baryons are converted to stars.
The distribution of is straightforward to interpret using Figure 2: in general the density follows closely the filaments of the density field, but the high-density clusters are not very prominent due to the lower fraction at high densities. In contrast, is closely associated with the denser cluster halos.

In Figure 3, a line-of-sight through the slice of Figure 2 is analyzed (this line-of-sight is the white dotted line in Figure 2). Shown in Figure 3 are the gas density, temperature, and metallicity. Since is hydrogenic, its strongest line is Ly with oscillator strength , at , or energy , a good region for high resolution X-ray spectroscopy. has its strongest line (oscillator strength ) at (energy ). The top two panels in Figure 3 show the predicted spectrum produced by these two lines of and . To compute the spectra, we use the formula for the Gunn-Peterson optical depth for a uniform IGM (Gunn & Peterson 1965), , where is the density of the ion, and the Hubble constant at redshift , and correct it for the effect of peculiar velocity gradient and thermal broadening in the same way as in Ly forest simulations (e.g., Cen et al. 1994).
From the various absorption systems in Figure 3, we see the general trend that the numerous weak systems have lines of similar strength in and , while stronger absorption systems should be most prominent in . This is also clearly seen in the two top panels of Figure 2. The strong absorbers correspond to higher density regions where is more abundant than .
It needs to be emphasized that these X-ray absorption lines are probing regions of a very different nature than the familiar X-ray clusters detected from their X-ray emission. The temperatures of the X-ray absorption systems are near K; the hotter gas that is detected from X-ray emission ( K) does not produce much absorption because of the collisional ionization of oxygen; in fact, even for a species that is not collisionally ionized until higher temperatures, the cross sections of these hotter regions are small. The X-ray absorbers arise from gas at the outskirts of the most common virialized halos that are collapsing at the present time, corresponding to poor groups and clusters of galaxies.

The distribution of equivalent widths of and lines is shown in Figure 4, for the two simulations with box size of and . The main feature seen in the curves is that the number of absorption systems falls sharply above an equivalent width of . The main reason for this cutoff is line saturation, especially for the lines. Even though the velocity dispersion of the typical halos associated with the absorption systems is larger than , the fluid velocity along a line-of-sight with high impact parameter has a dispersion close to , and thermal broadening is negligible due to the high mass of the oxygen ion. Thus, the distribution of the column density is close to a power-law. On the other hand, the column density distribution also shows a cutoff, although not as pronounced as the cutoff for the equivalent width in Figure 4. The cutoff in is therefore also due to an ionization effect, namely the fact that high column density systems arise from regions of higher gas density, where most of the oxygen has recombined to .
The number of absorbers is larger in the simulation compared to the simulation on a smaller volume, for . The difference is mostly due to the missing large-scale power in the small simulation, and the fact that the volume in the small simulation is not large enough to contain massive structures that can give rise to high equivalent width systems at the resolution of the simulation.
The results for the larger volume simulation in Figure 4 imply that a random quasar at should on average contain about one absorption line in its spectrum with , and about four lines with . Given our comments above about the effects of the finite volume of the simulation, we expect that the true number of lines predicted by the cosmological models we have adopted here should, if anything, be higher than the predictions from the box. This equivalent width is near the sensitivity limit of the upcoming X-ray missions AXAF and Constellation X (Canizares & Fang 1998).
Many other absorption lines from other elements should be present in the X-ray spectra of quasars (a list of permitted lines is given by Verner, Verner, & Ferland 1996). Every element should have the same pair of lines we have considered here for oxygen (the Ly line of the hydrogenic ion and the 1s2-1s2p line of the helium-like ion). There should also be permitted transitions of the K-shell electrons in lithium-like ions (such as ) that could be of interest, but to our knowledge the oscillator strengths of these lines have not yet been accurately computed (A. Pradhan 1998, priv. communication). The characteristics of these lines should be very similar to the oxygen lines we have considered, but with reduced equivalent widths due to the lower abundance. Lines at higher energies than the line may be especially targeted by a mission like Constellation X, where the sensitivity of the instruments improves at higher energy (see http://constellation.gsfc.nasa.gov). The next strongest lines at higher energies are (at ), (at ) and (at ). These lines are generally a factor 10 times weaker than the lines, for a fixed column density of gas and when the fraction of the element in the observed ion is near its peak (the strength of an unsaturated line is proportional to the oscillator strength, times the abundance of the observed species, times the wavelength). The lines of and are present at similar temperatures as and , and should generally trace similar regions, although they will be difficult to detect given their weakness. But is present up to rather high temperatures (peaking near K), so some particularly strong lines could occur on the rare lines of sight intersecting massive clusters at small impact parameters, with very large gas column densities.
5 Conclusions
We have presented in this paper a new generic prediction of the large-scale structure theories based on hierarchical gravitational collapse of density fluctuations: X-ray quasars should show absorption lines in their spectra from heavy elements in the intervening intergalactic gas. A substantial fraction of the baryons are predicted to be in the form of low-density intergalactic gas at the present time (Ostriker & Cen 1996; Cen & Ostriker 1998; Miralda-Escudé et al. 1996; Zhang et al. 1998). Several mechanisms are known to enrich this gas with heavy elements; given the observations of the metallicity in the centers of rich clusters, it seems inevitable that this enrichment has also taken place in the lower-density gas. In fact, the simulations presented here underpredict the metal abundance observed in clusters; had we increased the metal injection rate to fit the present cluster metallicities, the column densities of the absorbers we predict would be proportionally increased.
Absorption lines in the soft X-rays, as well as far-UV lines produced by lithium-like ions (Mulchaey et al. 1996), are the only observational means we know of to detect low-density, hot intergalactic gas in the present universe. At temperatures K, the neutral hydrogen fraction is too low to produce significant Ly absorption, so we must rely upon the highly ionized heavy elements. The search for intergalactic gas is important to complete an inventory of the baryons in the present universe. The total baryon density observed in galaxies and X-ray emitting gas in clusters comes close to the baryon density predicted by nucleosynthesis (e.g., Persic & Salucci 1997; Fukugita, Hogan, & Peebles 1998), but given the uncertainties it is possible for up to 80% of the baryons to be undetected, in the form of ionized intergalactic gas. Results from cosmological simulations also suggest that the amount of baryons in the Ly forest at is higher than the sum of all the baryons observed at present (Rauch et al. 1997; Weinberg et al. 1998; Zhang et al. 1998).
The detection and subsequent study of the X-ray forest would lead to a large number of potential applications. The number of absorption lines found will be measuring the product of the baryon density times the metallicity in the IGM. The ratio of strengths of the and lines will probe the distribution of the gas temperature and density, and several other lines may be observed which could provide extensive tests for the predictions of large-scale structure models. The X-ray absorption lines could be correlated with structures seen in emission near the line-of-sight, such as galaxies or X-ray emitting clusters and groups. A new era in the study of the intergalactic medium could be opened with the discovery of the X-ray forest by the new X-ray observatories.
References
- (1) Aldcroft, T., Elvis, M., McDowell, J., & Fiore, F. 1994, ApJ, 437, 584
- (2) Barcons, X., & Fabian, A. C. 1992, ARA&A, 30, 429
- (3) Bertschinger, E. 1995, unpublished (astro-ph 9506070)
- (4) Boldt, E. 1987, in Observational cosmology, Proceedings of the IAU Symposium (Dordrecht: Reidel), 611
- (5) Bunn, E. F., & White, M. 1997, ApJ, 480, 6
- (6) Burles, S., & Tytler, D. 1996, ApJ, 460, 584
- (7) Burles, S., & Tytler, D. 1998, ApJ, in press (astro-ph/9712108,109)
- (8) Cen, R. Y., & Ostriker, J. P. 1998, submitted to Science (astro-ph/9806297)
- (9) Dekel, A., & Silk, J. I. 1986, ApJ, 303, 39
- (10) Eke, V. R., Cole, S., & Frenk, C. S. 1996, MNRAS, 282, 263
- (11) Canizares, C. R., & Fang, T. 1998, to appear in “Fundamental Parameters in Cosmology”, XXXIII Rencontres de Moriond (astro-ph/9805046)
- (12) Ferland, G. 1996, University of Kentucky, Department of Astronomy, Internal report
- (13) Fukugita, M., Hogan, C. J., & Peebles, P. J. E. 1998, ApJ, submitted (astro-ph 9712020)
- (14) Gnedin, N. Y. 1995, ApJS, 97, 231
- (15) Gnedin, N. Y., & Bertschinger, E. 1996, ApJ, 470, 115
- (16) Gnedin, N. Y., & Ostriker, J. P. 1997, ApJ, 486, 581
- (17) Hernquist, L., Katz, N., Weinberg, D. H., & Miralda-Escudé, J. 1996, ApJ, 457, L51
- (18) Hu, W., & Sugiyama, N. 1994, ApJ, 436, 456
- (19) Miralda-Escudé, J., Cen, R., Ostriker, J. P., & Rauch, M. 1996, ApJ, 471, 582
- (20) Mulchaey, J. S., Mushotzky, R. F., Burstein, D., & Davis, D. S. 1996, ApJ, 456, L5
- (21) Ostriker, J. P., & Cen, R. 1996, ApJ, 464, 27
- (22) Rauch, M., Miralda-Escudé, J., Sargent, W. L. W., Barlow, T., Weinberg, D. H., Hernquist L., Katz N., Cen R., Ostriker J. P. 1997, ApJ, 489, 7
- (23) Persic, M., & Salucci, P. 1997, ASP Conf. Ser. 117, 99
- (24) Shapiro, P. R., & Bahcall, J. N. 1980, ApJ, 241, 1
- (25) Songaila, A., & Cowie, L. L., 1996, AJ, 112, 839
- (26) Verner, D. A., Verner, E. M., & Ferland, G. J. 1996, Atomic Data Nucl. Data Tables, 64, 1
- (27) Weinberg, D. H., Miralda-Escudé, J., Hernquist, L., Katz, N. 1998, ApJ, in press (astro-ph 9701012)
- (28) Zhang, Y., Anninos, P., Norman, M. L., & Meiksin, A. 1997, ApJ, 485, 496
- (29) Zhang, Y., Meiksin, A., Anninos, P., & Norman, M. L. 1998, ApJ, 495, 63