Bar driven evolution of S0s: the edge-on galaxy NGC 4570
Abstract
We present circumstantial evidence that the central region of the edge-on S0 galaxy NGC 4570, which harbors a 150 pc scale nuclear disc in addition to its main outer disc, has been shaped under the influence of a small ( pc) bar. This is based on the finding of two edge-on rings, whose locations are consistent with the Inner Lindblad and Ultra Harmonic Resonances of a rapidly tumbling triaxial potential. Observed features in the photometry and rotation curve nicely correspond with the positions of the main resonances, strengthening the case for a tumbling bar potential. The relative blue colour of the ILR ring, and the complete absence of any detected ISM, indicates that the nuclear ring is made of relatively young ( Gyr) stars. We discuss a possible secular-evolution scenario for this complex multi-component galaxy, which may also apply to many other S0-galaxies with observed rings and/or multiple disc-components.
keywords:
galaxies: NGC 4570 – galaxies: structure – galaxies: nuclei – galaxies: evolution1 Introduction
High resolution images obtained with the Hubble Space Telescope (HST) have revealed the presence of bright stellar discs with very small scale lengths of pc in a number of S0 galaxies (van den Bosch et al. 1994; Lauer et al. 1995; van den Bosch, Jaffe & van der Marel 1998). These nuclear discs are photometrically and kinematically decoupled from the main (outer) discs which have an inner cut-off radius; the so-called Freeman type II discs (Freeman 1970). Such a multi-component structure suggests a complex formation scenario. The main question is whether this multi-component structure was imposed during the formation of the galaxy or whether it resulted from secular evolution.
Baggett, Baggett & Anderson (1996) argued that the inner-truncated discs could be linked with the presence of a bar. Since the nuclear regions of these S0s exhibit high line strength values (Fisher, Franx & Illingworth 1995), it has been suggested that they formed from radial inflow of pre-enriched gas. Small scale (nuclear) bars have been invoked as an efficient way to transport gas inwards and accumulate mass in the central regions of galaxies (Friedli & Martinet 1993; Wada & Habe 1995). Bar-induced secular evolution could thus be a possible mechanism by which to form the observed nuclear discs. In this scenario the inner cut-off of the outer main disc would occur at the co-rotation radius of the bar, which drives gas into the central region where the nuclear disc forms. Unfortunately, there is a conspiracy in that nuclear discs can only be easily detected in nearly edge-on galaxies, whereas the photometric bar signatures (e.g., isophote twists) are confined to the more face-on systems.
In this paper we present the case of NGC 4570, an edge-on S0 galaxy with a nuclear stellar disc. Based on the study of the photometric and kinematical substructures in this galaxy (Section 2), we present evidence for the presence of a single pattern speed associated with a small bar (Section 3). This evidence is based mainly on the locations of two edge-on stellar rings. In Section 4 we discuss a secular evolution scenario for NGC 4570 under the influence of this bar potential. Conclusions are drawn in Section 5.
2 Substructures in NGC 4570
All data discussed here, except the ground-based image, have been presented by van den Bosch, Jaffe & van der Marel (1998, hereafter BJM98). We refer the interested reader to this article for further details on the data and its reduction.
2.1 Photometry
BJM98 obtained , , and band images of NGC 4570 using the Wide Field and Planetary Camera 2 (WFPC2) aboard the HST. In order to build a detailed photometric model of NGC 4570 (see Section 3.2) we use an additional ground-based band image (resolution of FWHM) which provides a larger field of view. This image was obtained with the 2m telescope of Pic-du-Midi Observatory by Jean-Luc Nieto and kindly provided to us by Patrick Poulain. All images were reduced in the classical way, and normalized in (in the corresponding Cousin bands). The ground-based and HST -band images show excellent agreement with each other after the difference in resolution is properly taken into account.
2.1.1 Unsharp masking
In order to enhance the substructures in our images we have performed a simple unsharp masking of our WFPC2 and ground-based images (Fig. 1): the HST image clearly reveals the thin nuclear disc inside the central arcsecond (cf. BJM98), and the ground-based image shows that the outer disc is really a Freeman type-II disc, with an inner cut-off radius at . There are thus two nested disc-like components.
In addition to the double disc structure, the unsharp masked images reveal two sets of symmetric peaks, and , located at respectively and from the centre along the major-axis (Fig. 1). are very sharp and marginally resolved, whereas are diffuse (FWHM ) and less contrasted against the background galaxy. The symmetry of these peaks suggests that they correspond to two individual rings located in the equatorial plane of the galaxy and seen nearly edge-on. In the following, we refer to these structures as the nuclear or ring, and the outer or ring.

2.1.2 Isophote shapes
In Fig. 2 we plot the ellipticity () and the coefficient as a function of the semi major-axis radius (for both the HST and ground-based images). The coefficient describes deviations of isophotes from pure ellipses, such that positive indicates discy isophotes and negative corresponds to isophotes that are more boxy than an ellipse (see Jedrzejewski 1987). The different components of NGC 4570 clearly show up in these diagrams:
-
•
the maximum of and at corresponds to the highest contrast between the nuclear disc and the central spheroid.
-
•
the position of the nuclear ring corresponds to a small local maximum in both the ellipticity () and () profiles. However this is entirely due to the presence of the peaks along the major-axis. When their contribution is removed, the location of corresponds to the absolute minima in the ellipticity and the profiles (i.e., minimum flattening and maximum boxiness).
-
•
from the end of the nuclear disc outwards, the ellipticity profile rises up to 0.37 at the radius of the ring, is flat in between and , and rises again outwards.
-
•
the outer ring corresponds to a local maximum of the coefficient. Again, this may be entirely due to the presence of the peaks. Finally, the profile shows a local minimum at the radius of .
An investigation of the detailed isophotal parameters of NGC 4570 thus reveals three characteristic radii: , inside of which the nuclear disc dominates the projected surface brightness; , where a local bump in the ellipticity and profiles is visible; and , outside of which the contribution of the outer disc to the surface brightness starts to dominate. In between and the slightly boxy spheroid () dominates the projected surface brightness.

2.1.3 Colours
The three separate regions discussed above also show up in the colour images. Fig. 3 shows the profiles averaged over a slit of along the major and minor axis respectively. The colour image, derived from the WFPC2 images of NGC 4570, has been slightly smoothed with an adaptive filter which damps the noise but preserves the characteristic features. Along the major axis, the radius of the nuclear ring and clearly mark the changes in the slope of the colour gradient, and thus delimit three distinct regions:
-
•
Outside , the cut-off radius of the outer disc, the colour profile is nearly flat with .
-
•
In between and the colour slowly increases inwards.
-
•
The region inside the nuclear ring exhibits a very steep increase in .
Along the minor axis, where the light is bulge-dominated, the profile exhibits a steep, continuous gradient. The outer disc, which seems to have a constant colour, is clearly much redder than the outer parts of the bulge at the corresponding radius (scaled with the local ellipticity, see Fig. 3). Fisher et al. (1996) have shown that this is a common feature amongst S0s, and that the line-strength profiles show a similar behavior, except for . This suggests that the (main) disc is of similar age as the bulge, but of higher metallicity.

2.2 Kinematics
In addition to the photometry, BJM98 used the 4.2m William Herschel Telescope (WHT) at La Palma to obtain long-slit spectra of NGC 4570 at three different position angles: major axis, minor axis and an offset axis parallel to the major axis. The spectra have a spectral resolution of , and were obtained with a slit-width of and seeing FWHM of . After standard reduction of the spectra, the rotation velocities () and rms velocities (), which are the first and second order moments of the line-of-sight velocity profile (hereafter VP), were derived. The characteristic radii mentioned above mark again specific features in the observed rotation curve along the major axis of NGC 4570 (Fig. 4):
-
•
Inside the nuclear ring, the stellar component exhibits a nearly rigid body rotation with . This value obviously depends on the spatial resolution.
-
•
At the radius of (which marks the end of the contribution of the nuclear disc), the gradient of the rotation curve suddenly drops and the rotation velocity increases out to .
-
•
In between and the rotation velocity is roughly constant but starts to rise again further outwards where the outer disc dominates the projected surface brightness.

3 Evidence for a single pattern speed
3.1 The rings
In Section 2.1.1, we have shown evidence for the presence of two rings, at radii of and respectively. As emphasized by Buta & Combes (1996), rings are always associated with gas. Gas rings are a commonly observed phenomenon in barred galaxies (Buta 1995), where they originate from the torques provided by the tumbling non-axisymmetric bar structure (Schwarz 1984). Such bar-induced rings are often observed at the so-called Lindblad Resonances: the Inner Lindblad Resonance or ILR (), and the Outer Lindblad Resonance or OLR (). Here is the pattern speed of the bar, and and are respectively the circular and the radial epicyclic frequencies in the equatorial plane of the galaxy. Rings also often form at the 4/1 Ultra Harmonic Resonance (UHR) which corresponds to (Schwarz 1984; see also Jungwiert & Palouš 1996 for a more general treatment). It is important to note that gas rings can also be formed by viscous shearing at the turnover radius of the velocity curve (Lesch et al. 1990). However, Jungwiert & Palouš (1996) argued that inelastic collisions significantly reduce the turbulent motions thus rendering this mechanism inefficient. It could anyway not explain the presence of two rings in NGC 4570.
In order to examine whether the positions of the observed and features are consistent with resonance radii associated with a tumbling bar potential, we determine the potential of NGC 4570. We construct a model for the spatial luminosity distribution which, after projection and convolution with the point spread function (PSF), fits the observed surface brightness distribution. The absolute scale of the potential is set by the mass-to-light ratio of the model, which we determine from solving the Jeans equations (see Binney & Tremaine 1987) and fitting to the observed kinematics.
3.2 The photometric model
We fit both -band images using the Multi-Gaussian Expansion (MGE) technique including the effect of the respective PSFs (Emsellem, Monnet & Bacon 1994). This technique is particularly well suited for galaxies with complex multi-component structures such as NGC 4570. The resulting model provides an excellent fit to the available photometric data from the central HST pixel () up to a radius of along the major-axis (Fig. 5). The residual between the WFPC2 image and the MGE model reveals the and peaks already uncovered via the unsharp masking (the peaks are directly visible in the top panel of Fig. 5).The thinness of the nuclear disc indicates that the inclination angle (Scorza & van den Bosch 1998). Throughout we assume an inclination angle of (i.e,. edge-on). The results presented here are only very weakly dependent on this assumption. Using this inclination angle we deproject the unconvolved MGE model to obtain an analytical form of the three dimensional luminosity distribution.

3.3 The dynamical model
We solved the Jeans equations for the MGE model of NGC 4570 assuming a constant mass-to-light ratio and an isotropic dispersion tensor. The mass-to-light ratio was adjusted such as to obtain the best fit to the rms velocities, which are independent of the velocity anisotropy of the model (here is the spatial velocity dispersion). Assuming a distance of 23 Mpc for NGC 4570 ( pc), we find . These Jeans models, which are based on the oversimplifying assumption that the phase-space distribution function only depends on the two classical integrals of motion (energy and vertical angular momentum ), do not fit the details of the observed kinematics. However, this is of no importance here, since we are merely interested in obtaining an estimate of the mass-to-light ratio.
3.4 The pattern speed
Using the MGE model of NGC 4570 and the mass-to-light ratio derived from the Jeans modeling, we calculate the potential and its corresponding circular and epicyclic frequencies as functions of the cylindrical radius . We thus derive the resonance diagram of NGC 4570, which presents the main radial orbital frequencies versus the radius in the equatorial plane (Fig. 6). Given the small distance of the ring from the centre, we assume it to be at the ILR (). According to the resonance diagram, this implies a pattern speed of and sets the locations of the UHR, co-rotation (CR, ), and OLR at , and , respectively. The locations of these resonances are indicated as vertical lines in Fig. 1 to 4.
These radii are in excellent agreement with the ones emphasized in Sect. 2. The radius of the UHR () corresponds nearly exactly with the observed location of the secondary peaks (). Both the ILR and the UHR are located in the region dominated by bulge light. The nuclear disc is located inside the ILR. The outer disc starts just outside CR () and dominates the light outside the OLR.

The UHR ring, when present, usually encircles the bar which would therefore have a radial extent of pc. Both the high pattern speed and the small size of the bar suggest that the bar is comparable to nuclear bars observed in several (close to face-on) spiral galaxies. Möllenhoff, Matthias & Gerhard (1995) presented the case of M94, a ringed Sab galaxy, where they detect the presence of a small bar (major axis of kpc) with a pattern speed of and which contributes only % of the total light inside its extent. The bar-like system of M 94 may be very similar to what we observe in NGC 4570.
3.5 Robustness of the resonances radii
The circular and epicycle frequencies are defined in an axisymmetric potential and hence only used here as approximations. It is striking to see how well the observed locations of the peaks are consistent with a simple resonance diagram derived from such axisymmetric model. In strong bars, ILR rings are often elongated (typical axis ratios lower than 0.8) and perpendicular to the bar: they follow the main family of orbits which passes into the family (elongated parallel to the bar) upon crossing the ILR (e.g., Contopoulos & Grosbol 1989). In such case, the locations of the peaks associated with these elongated rings depend on the viewing angle and in general will not coincide exactly with the resonance radii derived as outlined above. This tells us that the potential of NGC 4570 may not depart very strongly from axisymmetry, i.e., the bar potential is weak (see also Section 3.7).
We tested the dependence of the location of the resonances on the model in three ways. We first derived the resonance diagram for a new MGE model whose central part was fitted using the band HST image: the UHR, CR and OLR resonances are then moved to , and respectively, which corresponds to a decrease of about 5%. Secondly, we allowed the of the different components to vary, in order to take into account a possible variation of with : the amplitude of the variation was chosen consistently with the observed colour gradients. The derived empirical errors for the location of the individual resonances (UHR, CR and OLR) were all smaller than 10%. We finally checked the effect of the uncertainty of the inclination angle, and found it to be negligible (% for ). The predicted radii for the UHR, CR, and OLR resonances are thus found to be rather robust. In what follows, we use the former values derived from an edge-on model with constant mass-to-light ratio ().
3.6 Nature and origin of the rings
As mentioned in Section 3.1 gas rings are a natural consequence of the presence of a bar. However, we did not detect any emission lines in our WHT spectra, which should include the H and [OIII] emission lines. Furthermore, NGC 4570 has neither been detected in X rays, nor in HI or 100 m flux (Knapp et al. 1989; Wrobel 1991). At HST resolution the peaks represent about 10% of the local surface brightness in the band (which covers the wavelengths of the [OIII] emission lines). In the band, in which no strong emission lines are expected, the peaks still contain about 7% of the local light. This demonstrates that the light associated with is mostly stellar. The same holds for the UHR-ring.
According to our MGE model, NGC 4570 has a total luminous mass of M⊙. For a stellar population with a mean age of yr, we estimate that the entire galaxy produces of gas through stellar mass loss (Ciotti et al. 1991). Only the gas located inside CR is transported inwards, whereas outside CR gas is transported towards the OLR. Approximately 20% of the total mass of NGC 4570 is located inside CR. We therefore find that the mass of the ILR ring could be generated in less than 40 Myr by stellar mass loss. This shows that the absence of any detected ISM does not oppose strong difficulties against interpreting the observed peaks as bar-induced resonance rings, since the gas mass required is easily supplied by internal mass loss.
A colour-magnitude diagram of the inner region of NGC 4570 is presented in Fig. 7: here each dot represents a pixel of the Planetary Camera (PC) CCD. The overall inclined shape of the diagram reflects the colour gradient in the galaxy. The asterisks mark the pixels at the position of the two peaks. They are clearly bluer than their immediate surrounding. Taking into account the relative contribution of the peaks to the local surface brightness (absolute maxima of 22%, 13% and 10.5% in the , and bands respectively) we estimate the true colour of the nuclear ring to be and . According to the single burst, stellar population models of Worthey (1994), these colours correspond to a rather young population with an age of less than Gyr and a metallicity close to Solar. Although stellar population models may be inaccurate (see e.g., Bruzual 1996), we suggest that the nuclear ring formed from gas which, driven by a tumbling triaxial distortion, accumulated at the ILR and underwent subsequent star formation in the last couple of Gyrs.

The case of the UHR ring is less clear as it is less contrasted against the background light and appears as a rather clumpy structure. It is slightly more contrasted in the band than in the band. However we do not detect the peaks in the band. If the UHR ring were as blue as the ILR ring, the peaks should represent about 10% of the local luminosity in the band. This is unfortunately too close to the noise level in the band image for us to conclude on the true colour of the UHR ring.
It is also important to emphasize the fact that the colour gradient shows a clear break at the CR radius, which marks the inner cut-off of the outer disc. This is strikingly similar, at least qualitatively, to the results obtained in the bar simulations by Friedli, Benz & Kennicutt (1994, see their Fig. 1, panel d; see also Friedli & Benz 1995). Their study shows that the presence of a bar can significantly affect the abundance distribution: in their simulations, the abundance gradient after 1 Gyr is nearly flat in the disc outside CR, shallow in the bar, and very steep in the central region where a nuclear starburst was triggered by an increased gas fueling. In the case of NGC 4570, it would thus be important to examine the link between the observed colours and e.g., the metal line indices.
3.7 Kinematic signatures of a bar
Although bars are difficult to detect photometrically in edge-on systems, Kuijken & Merrifield (1995) have shown that bars do produce a strong kinematic signature. Due to the lack of available closed orbits near co-rotation, the projected -plane shows a “figure-of-eight”-shape: at radii inside CR, the velocity profiles are double peaked resulting in a characteristic figure-of-eight variation with radius. The two peaks reflect orbits in the bar and in the disc outside CR projected along the line-of-sight. Since gas is forced to move on closed, non-intersecting orbits, this kinematic bar-signature shows up most clearly with emission lines. However, as long as not too many stars are on chaotic orbits, it should in principle show up from absorption line spectra as well. Indeed, Kuijken & Merrifield (1995) have found this characteristic “figure-of-eight”-shape in the absorption line spectra of two edge-on systems with peanut-shaped bulges.
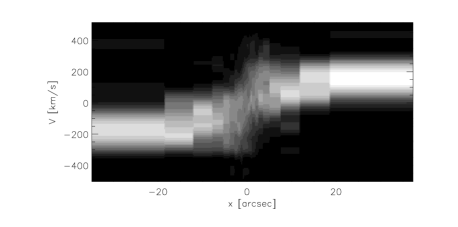
We have constructed a -diagram for NGC 4570 from the major axis WHT spectrum using the unresolved Gaussian decomposition (UGD) algorithm developed by Kuijken & Merrifield (1993). This method models the VPs as the sum of a set of unresolved Gaussian distributions with fixed means and dispersions. The (non-negative) weights of each of these Gaussians are then determined using quadratic programming techniques. We spatially rebinned our spectrum to obtain a signal-to-noise of at least 40 per . Each VP was then modeled as the sum of Gaussians with dispersion, and whose means are separated by (we have checked that the choice of these values does not influence the conclusion reached here). The resulting -diagram is shown in Fig. 8. Although some LOSVDs in the central are “flat-topped” or double-peaked, we do not detect a “figure-of-eight” in the -diagram. Unfortunately, this does not provide a definite test regarding the presence of a small scale bar in NGC 4570: the bar could be weak and/or seen at an intermediate angle between edge-on and end-on, both of which can impede detection of the “figure-of-eight” shape (Merrifield 1996). Furthermore, since our presumed bar is very small ( pc), the “figure-of-eight”-shape should occur inside that radius. However, the (hot) bulge component dominates the light in that region, making it very hard to detect the characteristics of the bar against this bulge background.
4 A secular evolution model
It is generally believed that bars are formed through the process of swing-amplification (Toomre 1981). However, the initial presence of an ILR would prohibit the waves from reaching the centre and therefore damp them. The steep stellar cusp in NGC 4570 ensures the presence of such an ILR. So either the perturbation of the disc was strong enough to saturate the ILR (e.g., due to a tidal interaction), or the cusp (and therewith the ILR) was not present when the bar formed, but is merely a product of the gas flow towards the centre induced by the bar. The nucleus () of NGC 4570 exhibits a large H line strength value of as well as a high Mg (see BJM98). This, in addition to the central red colours ( and ), suggests the presence of a relatively young and metal-rich stellar component. Furthermore, the steep colour gradient starts inside the presumed ILR (see Sect. 2.1.3). This strongly favors the hypothesis of the nuclear disc and cusp being the result of pre-enriched gas accretion with a subsequent burst of star formation. We therefore suggest that the triaxial distortion was stronger in the past, and has been partially dissolved due to the growth of a central mass-concentration (and therewith the creation of a strong ILR). Several studies have shown that the growth of a central mass concentration weakens the bar, and eventually dissolves it if the nucleus reaches a few percent (typically ) of the total mass of the galaxy (e.g., Pfenniger & Norman 1990; Norman, Sellwood & Hasan 1996). If we assume that both the central cusp (), and the nuclear disc () were formed from bar-induced gas inflow, the central region of NGC 4570 raised its mass by less than of the total luminous mass (). Such a moderate increase of the central mass concentration may not completely destroy the bar, but merely weaken it (Norman et al. 1996). Hence a rapidly tumbling bar could survive in the central region. In this scenario, it is to be expected that when the bar formed, no ILR was present. We found that upon subtracting the central cusp from our MGE-model, the resulting potential has an -curve which is zero at , and reaches a maximum of at . Therefore, a perturbation with a pattern speed of in this potential will not have an ILR, and can form a bar by means of swing amplification.
These are two further arguments that seem to suggest that the ILR ring was formed after the bar. The first is the fact that the blue colour of the nuclear ring indicates that it is very probably younger than the stellar component inside the ILR. The second argument is based on how well the rings can survive (partial) bar dissolution. When the bar dissolves, the potential shape evolves from triaxial to axisymmetric. Whether the rings survive this evolution first depends on the timescale of the dissolution of the bar. If that timescale is sufficiently smaller than the rotational period at the radius of the ring , stars in the ring experience violent relaxation (Lynden-Bell 1967): stars loose energy if they are located along the major-axis of the bar, and gain energy along the minor axis of the bar: the ring is consequently destroyed. However, if the bar dissolution timescale is much larger than the potential change is adiabatic, and the actions of the orbits that make up the ring are adiabatic invariants. The ring then slowly shapes itself (i.e., becomes rounder) to the time-varying potential. Sellwood (1996) performed simulations, in which he mimicked the gas flow towards the centre by gradually increasing the central density. He found that the harmonic (which sustains the bar) drops by a factor 10 in less than one bar rotation period which is yr in the case of NGC 4570. Considering the rotation period at the ILR ( yr), as well as the very small radial extent of the ILR ring (its diameter is ), argues in favor of the nuclear ring having formed after partial destruction of the bar.
5 Conclusions
We have presented photometric evidence for the presence of two rings in the edge-on S0 galaxy NGC 4570. The main disc of this galaxy has an inner cut-off, inside of which a bright nuclear disc resides. The locations of the rings are consistent with the Inner Lindblad and Ultra Harmonic resonances induced by a rapidly tumbling, triaxial potential with a pattern speed of . The locations of the resonances correspond to local features in the morphology, colours and kinematics of NGC 4570. In particular, the outer disc has its inner cut-off close to CR, consistent with the picture that this cut-off originates from the bar (early-type bars generally end near CR, Combes & Elmegreen 1993). The line strengths and colours of the central nucleus (inside the ILR) suggests a metal-rich and rather young stellar population. The ring at the ILR is bluer than its immediate surrounding, which together with the complete absence of any observed ISM, indicates that it consists of a relatively young ( Gyr) stellar population.
We have thus proposed a tentative scenario for the formation and secular evolution of NGC 4570. We have argued that a rapidly tumbling bar formed in NGC 4570 driving gas inwards thus forming part of the central structure (e.g., cusp and nuclear disc). Due to this central mass accumulation a strong ILR is created, and the bar then weakened. This was followed by the formation of an ILR gas ring which underwent subsequent star formation. The observed feature at the UHR also seems to be a genuine ring feature, since both observations and N-body simulations have shown that rings often form at the UHR as well. However, deeper photometric observations and a comparison of observed kinematics at the UHR with N-body simulations are required to confirm this hypothesis.
It is intriguing that no ISM is observed in NGC 4570, whereas the formation of rings clearly requires the presence of gas. However, estimates of the mass of the rings, do not require a large gas supply, but are consistent with them having formed from stellar mass loss of the older population of stars.
Several spiral galaxies with double disc structure and/or multiple rings whose locations are consistent with the resonant radii of a single pattern speed are known: Emsellem et al. (1996) presented the case of the Sombrero galaxy, M 104, an Sa which exhibits UHR and OLR rings as well as two distinct discs. The Sb galaxy NGC 7217 harbors three rings (at ILR, UHR, and OLR), but lacks any photometric evidence for a bar (Athanassoula 1996). Freeman type II discs and stellar rings have also been observed in a significant number of lenticular galaxies: Seifert & Scorza (1996) detected rings or double disc structures in % of their sample of 15 S0s. Although this sample has to be completed and higher spatial resolution data obtained (e.g., to search for nuclear discs and rings), this number is consistent with the percentage of more face-on disc galaxies which show photometric evidence for a bar or oval distortion (Combes 1995 and references therein). All this strongly suggests that double disc structures are common and most likely the result of bar driven secular evolution. In this paper we have presented the case of NGC 4570, the first S0 galaxy known that shows the presence of two stellar rings in addition to a double disc structure. We have discussed a secular evolution scenario to form this complex morphology, and which may also apply to other S0 galaxies with double disc structure and/or ring(s).
Acknowledgments
This paper has strongly benefited from discussions with F. Combes, M. Sevenster, and D. Friedli. We are grateful to K. Kuijken for kindly providing the UGD software. We thank M. Sevenster and T. de Zeeuw for a careful reading of the manuscript, and the referee for his comments that helped improving the paper significantly. FCvdB was supported by the Netherlands Foundation for Astronomical Research (ASTRON), # 782-373-055, and by a Hubble Fellowship, #HF-01102.11-97A, awarded by STScI.
References
- [1] Athanassoula E., 1996, Barred Galaxies, ASP Conf. Series 91, eds. R. Buta, D. A. Crocker & B. G. Elmegreen, p 309
- [2] Baggett W. E., Baggett S. M., Anderson K. S. J., 1996, Barred Galaxies, ASP Conf. Series 91, Eds R. Buta, D. A. Crocker & B. G. Elmegreen, p 91
- [3] Binney J.J., Tremaine S., 1987, Galactic Dynamics, Princeton University Press, Princeton
- [4] Bruzual G.A., 1996, New Light on Galaxy Evolution, eds R. Bender, R.L. Davies, Kluwer Academic Publishers, p.61
- [5] Buta R., 1995, ApJS 96, 39
- [6] Buta R., Combes, F., 1996, Fund. Cosmic Physics 17, 95
- [7] Ciotti L., D’Ercole, A., Pellegrini, S., Renzini, A., 1991, ApJ 376, 380
- [8] Combes F., 1995, The Formation and Evolution of Galaxies, V Canary Islands Winter School, eds C. Munõz-Tuñón, F. Sánchez, p 319
- [9] Combes F., Elmegreen B. G., 1993, A&A 271, 391
- [10] Contopoulos G., Grosbol P., 1989, ARAA 1, 261
- [11] Emsellem E., Monnet G., Bacon R., 1994, A&A, 285, 723
- [12] Emsellem E., Bacon R., Monnet G., Poulain, P., 1996, A&A, 312, 777
- [13] Fisher D., Franx M., Illingworth G., 1996, ApJ, 459, 110
- [14] Freeman K.C., 1970, ApJ, 160, 811
- [15] Friedli D., Benz W., 1995, A&A, 301, 649
- [16] Friedli D., Benz W., Kennicutt, R., 1994, ApJ, 430, L105
- [17] Friedli D., Martinet L., 1993, A&A, 277, 27
- [18] Jedrzejewski R.I., 1987, MNRAS, 226, 747
- [19] Jungwiert B., Palouš J., 1996, A&A, 311, 397
- [20] Knapp G.R, Guhathakurta P., Kim D.-W., Jura M., 1989, ApJS, 70, 329
- [21] Kuijken K., Merrifield M. R., 1993, MNRAS, 264, 712
- [22] Kuijken K., Merrifield M. R., 1995, ApJ 443, L13
- [23] Lauer, T. R., et al. 1995, AJ, 110, 2622
- [24] Lesch H., Biermann P. L., Crusius A., Reuter H. P., Dalhem M., Barteldress A., Wielebinski R., 1990, MNRAS 242, 194
- [25] Lynden-Bell D., 1967, MNRAS, 136, 101
- [26] Merrifield M. R., 1996, Barred Galaxies, ASP Conf. Series 91, eds. R. Buta, D. A. Crocker & B. G. Elmegreen, p 179
- [27] Möllenhoff C., Matthias M., Gerhard O. E., 1995, A&A 301, 359
- [28] Norman C.A., Sellwood J.A., Hasan H., 1996, ApJ, 462, 114
- [29] Pfenniger D., Norman C.A., 1990, ApJ, 363, 391
- [30] Schwarz M.P., 1984, MNRAS, 209, 93
- [31] Scorza C., van den Bosch F.C., 1998, MNRAS, submitted
- [32] Seifert W., Scorza C., 1996, A&A, 310, 75
- [33] Sellwood J. A., 1996, Barred Galaxies, ASP Conf. Series 91, Eds. R. Buta, D. A. Crocker & B. G. Elmegreen, p 259
- [34] Toomre A., 1981, Structure and Evolution of Normal Galaxies, eds. S.M. Fall & D. Lynden-Bell, Cambridge University Press, p. 231
- [35] van den Bosch F.C., Ferrarese L., Jaffe W., Ford H.C., O’Connell R.W., 1994, AJ 108, 1579
- [36] van den Bosch F.C., Jaffe W., van der Marel R.P., 1998, MNRAS, 293, 343 (BJM98)
- [37] Wada K., Habe A., 1995, MNRAS 277, 433
- [38] Worthey G., 1994, ApJS, 95, 107
- [39] Wrobel J.M., 1991, AJ, 101, 127