An Upper Limit on the Infrared Background Density from HEGRA data on Mkn 501
Abstract
The energy spectrum of Mkn 501 in the TeV energy regime, as measured by the HEGRA (High Energy Gamma Ray Astronomy) Čerenkov telescopes during its low state in 1995/96 and during a fraction of the 1997 outburst in the TeV energy regime, is shown to place stringent upper limits on the still unknown infrared photon density in the energy region between 3 and eV. Assuming two different shapes for the unknown infrared photon spectrum in this energy range we calculate upper limits on the infrared photon density on the basis of the power-law fit obtained for the observed spectrum up to the maximum energy.
, , , , ,
1 Introduction
The cosmologically important extragalactical
diffuse infrared background
(DIRB) in the astronomical window
from the optical to the infrared (IR)
has not yet been directly determined experimentally due to
large sytematic errors driven
by local effects. As realized
already a long time ago,
the detection of extragalactic TeV- sources
would enable one to indirectly measure this photon density due
to unavoidable pair production losses of TeV photons in
infrared photon fields
(Gould & Schréder 1966, Stecker et al. 1992).
Interpreting the Whipple data of Mkn 421 (redshift = 0.031), Stecker et al. (1994)
claimed to have seen an exponential cut-off
resulting from cosmic absorption
of an otherwise smooth power law -ray spectrum.
The authors suggested that the IR-density is given by
cm-3eV-1
where refers to the normalization factor of the Hubble constant
(km s-1 Mpc-1). A
similar analysis has been carried out by Dwek & Slavin (Dwek & Slavin 1994).
The inferred large values of the diffuse near-infrared background density
extrapolated to the infrared would imply that it is virtually impossible
to discover any extragalactic source above a few TeV.
However, Biller et al. (Biller et al. 1995) correctly pointed out that
unless the source spectrum is known, one measured TeV source can only yield
an upper limit, because the cut-off may be due to internal absorption at the
source. They obtain a conservative upper limit of eV cm-3 at eV.
In the meantime, besides Mkn 421 (Punch et al. 1992, Petry et al. 1996)
Mkn 501 (redshift = 0.034) is now the
second extragalactic TeV source to be
discovered and extensively monitored
with the Whipple and HEGRA Čerenkov
telescopes (Kerrick et al. 1995a, Bradbury et al. 1997).
Both objects belong to the blazar subclass of
galaxies showing powerful non-stellar activity characterized by
rapidly variable, polarized continuum emission.
As the outburst of Mkn 501 in early March 1997
(Aharonian et al. 1997) and
the two outbursts of Mkn 421 in Spring of 1995 and 1996
(Kerrick et al. 1995b, Gaidos et al. 1996, Buckley et al. 1996) have shown, both objects
also exhibit rapid variability with large amplitudes in the TeV energy range.
The HEGRA collaboration showed that
between March 16 and March 20 (about 27 hours observation
time) the Mkn 501
energy spectrum in the TeV energy range
extended beyond 10 TeV without a visible break in the power law
spectrum with a differential power
law index of 2.49 0.11 (stat.) 0.25 (syst.) (Aharonian et al. 1997).
During the quiescent state of Mkn 501 in 1996, this source was
observed with the HEGRA CT1 telescope for 220 hours.
The measured energy spectrum for this
period can be described by a differential power
law index of 2.5 0.4 (total error) (Petry 1997).
In the following we first discuss the current situation
regarding models and observations of the DIRB and then
derive an upper limit on the DIRB from the measured energy spectrum
of Mkn 501 in 1997 for IR photon energies between 3 eV and
3 eV.
2 Models and Observations of the DIRB
The current experimental and model situation regarding the DIRB is summarized in fig. 1. Since the published energy spectra for both of the extragalactic sources show no spectral break we do not incorporate the claimed detections of the DIRB density based on preliminary Mkn 421 spectra (Stecker et al. 1994).

We include, however, the recent tentative detection of the
far-infrared background radiation (Puget et al. 1996) by COBE which
is an important
step towards a direct measurement of the flux in the IR-regime
and which is at the moment
rather weakly constrained by the results given by Hauser
in Calzetti et al. (1995).
Due to the cosmological implications of the DIRB photon density
a great number of
diffuse IR models ranging from simple power laws to multicomponent spectra
have been developed by many authors.
A large number of parameters
such as the star/galaxy formation rate, the
number distribution of star masses, the dust content and all cosmological
parameters enter into these models. In fig. 1
we show the predictions of two complex models: The model
which we
later employ
for the numerical calculation
is by MacMinn & Primack (MacMinn & Primack 1996) who have
calculated the DIRB for various realizations of cosmological parameters and
dark matter models. The results clearly
depend on the set of parameters, and the flux predictions vary at most by a
factor of 3. Accounting for the uncertainties of the model an
average DIRB spectrum is assumed in the following.
The model by Fall, Charlot & Pei (Fall et al. 1996)
is based on the assumption that the star formation rate is directly
related to the consumption of neutral gas.
The density of neutral gas can
be determined from analyses of Ly absorption lines as seen in distant
quasar spectra thus leading to a cosmological rate of star formation out
to distances of . Once the rate is known, the emissivity of the
universe in the IR can be calculated as a function of . The dashed curve
in fig. 1 shows
the case where the neutral gas is fully consumed during the formation
process referred to as the closed box scenario.
3 Gamma-ray absorption
For -rays of energy propagating from a distant source at redshift towards a terrestrial observer the threshold energy for pair creation in interactions with low energy photons of present-day energy from an isotropic diffuse background radiation field is given by
| (1) |
where denotes the cosine of the scattering angle. A soft photon density strongly varying with energy is thus reflected in the optical depth determining the number density of target photons at the resonant energy . The pair creation cross section is given by
| (2) |
with
| (3) |
Here cm2 denotes the Thomson cross section. For the computation of the optical depth we use the geodesic radial displacement function . With the proper physical distance, , between a pair of well-separated points as a function of time given by , the cosmological expansion rate is with the dimensionsless function . Under the assumption that the mean mass density is dominated by non-relativistic matter the cosmological equation for the expansion rate is given by (see e. g. Peebles 1993, eq. (13.3))
| (4) |
where and are the three contributions to the Hubble constant due to the present mean mass density, the radius of space curvature, and the cosmological constant , respectively, with . For a cosmological model with , , and negligible space curvature the function simplifies to and the optical depth can be written as
| (5) | |||
| (6) |
for a non-evolving present-day background density , i.e.
where the prime indicates comoving frame quantities. Numerical results
for the optical depth using specific models for the background radiation
will be obtained below.
Under the assumption of a particular model for the IR-density
one can numerically integrate equation (5) and obtain the
optical depth .
For a source spectrum
the observed spectrum is then simply
given by .
While
for an optical depth smaller than unity the universe appears transparent,
it becomes opaque for larger values of .
This defines the -ray horizon () which
is the size of the visible -ray universe at a given energy.
The -ray horizon is shown for two values of the Hubble constant
in fig. 2.
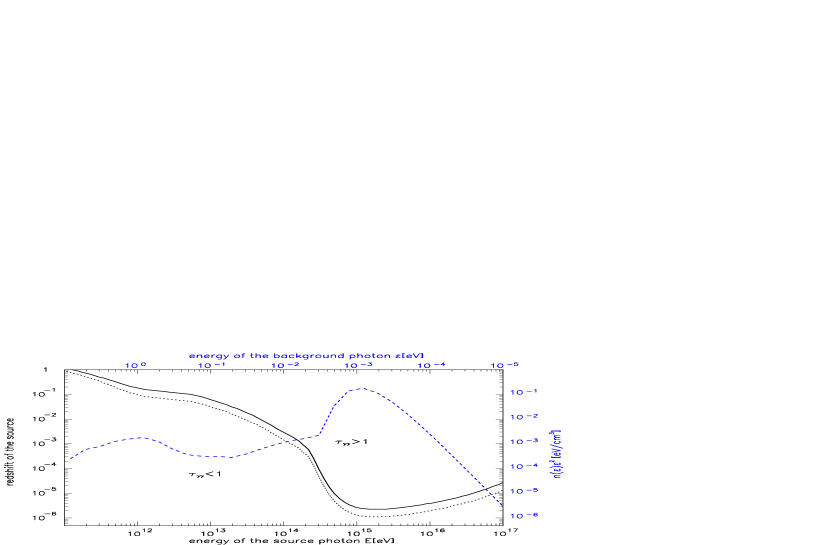
It turns out that at energies between 1010 and 1015 eV the size of the visible universe is a decreasing function of energy. Note that the adopted model does not take into account the extragalactic diffuse radio background which only becomes important above the characteristic energies of air showers accessible by HEGRA-type experiments.
4 Results
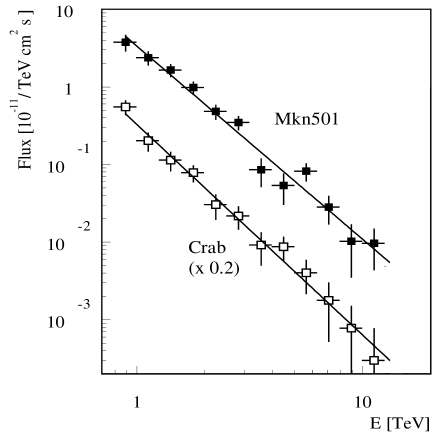
Petry (Petry 1997) and Aharonian et al. (Aharonian et al. 1997) have shown that the TeV energy spectrum of Mkn 501 can be described by an unattenuated power law with differential indices of (total error) in 1996 and (stat.) in May 1997, respectively. For the analysis of the 1996 data taken with the HEGRA CT1 telescope during about 220 hours of observation time in fig. 3 we show the integral flux spectrum with the fitted power law index of (total error) indicating the reduced error in the fit of the integral spectrum due to the correlated bins. This flux is compared to the Crab nebula integral spectrum as measured in the 1995/96 observation period with the CT1 telescope (37 hours). From the analysis of the 1997 Mkn 501 (27 hours) and Crab nebula data (10 hours) as measured with the HEGRA CT system we show the differential flux spectra in fig. 4.

From the observed unattenuated energy spectrum
extending up to 10 TeV we conclude that
the optical depth for this source is less than unity, i. e. ,
. To derive the upper limit
on the DIRB photon density we
take
and , and assume a specific shape of the IR-density.
For the energy range eV eV we make an ansatz
for the infrared spectrum based on the
results of two different models (outside this energy range only the MacMinn &
Primack model shown in fig. 1 is used):
(i) with
the pivot energy point
and (ii) the shape of the spectrum in this energy range is assumed to
be identical with the models by
MacMinn & Primack but its absolute level is
varied in the calculation. The results for
the first ansatz are presented in fig. 5 where values of and
below the curve are still allowed by the detection of Mkn 501 at
10 TeV. To illustrate the impact of a still not excluded
observation of the unabsorbed spectrum extending up to 15 TeV,
a second curve was added in the figure.

Using the second model ansatz the observation of Mkn 501 at 10 TeV
restricts the normalization of the spectral segment between
eV and eV to (times the flux
assumed in this work). At the pivot energy point of eV we thus determine upper limits of
eV/cm3
for the MacMinn & Primack model and eV/cm3
for the powerlaw ansatz and assuming the slope of the spectrum
to be flat () around the pivot point.
A comparison with fig. 1, where we have added the
upper limit curve derived using the MacMinn & Primack ansatz, indicates
that these limits are
about two orders of magnitude below those accessible
by direct measurements at this energy and that they are compatible
with the tentative FIRAS measurement of the IR density (Puget et al. 1996).
As pointed out in the introduction, the measurement of single spectra,
even if a break-off feature is observed, does not permit
a determination of the actual
level of the DIRB density. Up to the end of the 1997 observation period (October 1997)
the blazar Mkn 501 continued to be in a high state with respect to
TeV emission. The increasing statistics will enable
Čerenkov telescope experiments to extend observations
to higher energies and search for cut-off features.
The relationship between the infrared photon density
in the energy range from eV to eV,
assuming a powerlaw spectrum
, and the maximum observable energy, i. e.,
with optical depth = 1,
for different values of redshift is shown in fig. 6.
If e. g. no
cut-off is observed up to around 70 TeV we would thus derive,
using the above described procedure, an upper limit on the DIRB density
of about 0.1 times the average MacMinn & Primack model prediction.

5 Conclusions
Based on the observation
of the unabsorbed Mkn 501 -spectrum extending beyond 10 TeV,
we have derived a stringent upper limit on the
extragalactic diffuse infrared photon energy density in the energy range
from to eV of 1.8 times
the prediction of an average model by MacMinn & Primack.
This translates into an upper
limit of the energy density at the used pivot energy point of eV of
eV/cm3.
For the second ansatz, i. e. ,
a power-law ansatz for the DIRB around this pivot energy point,
we determined upper limits on the normalization as a function of the
spectral index, e. g. for a flat
spectrum , the resulting upper limit is
eV/cm3.
These upper limits are about 2 orders of magnitude below upper limits
derived from
current direct measurements at this energy and are not in
contradiction to a value of the DIRB density
derived from preliminary evidence of TeV emission
reported by Meyer & Westerhoff ( Meyer & Westerhoff 1996).
The results presented in this paper are well compatible with other
analyses of the infrared photon density based
on the HEGRA CT data of Mkn 501 (Mannheim 1997, Stanev & Franceschini 1997).
They are also in good agreement with an empirical calculation
of the DIRB based on galaxy luminosity functions in the IR (Malkan & Stecker
1997) which in turn is in good agreement with recent DIRB models
derived from star formation data (Guiderdoni et al. 1997).
References
- [1] Aharonian F.A. et al.,1997, submitted to A&A
- [2] Biller S.D., Akerlof C.W., Buckley J.H, et al., 1995, ApJ 445, 227
- [3] Boulanger F. and Perault M., 1988, ApJ 330, 964.
- [4] Bradbury S.M., Deckers T., Petry D., et al., 1997, A&A 320, L5
- [5] Buckley J.H., et al., 1996, ApJ 472, L9
- [6] Calzetti D., Livio M., Madau P. (eds), 1995, Extragalactic background radiation, Space Telescope Science Institute Symposium, vol.7, Cambridge Univ. Press
- [7] Dwek E. and Slavin J., 1994, ApJ 436, 696
- [8] Fall S.M., Charlot S., and Pei Y.C., 1996, ApJ 464, L43
- [9] Gaidos J.A., et al., 1996, Nature 383, 319
- [10] Gould R. J. and Schréder G., 1966, Phys. Rev. Lett. 16, 252
- [11] Guiderdoni B. et al., 1997, Nature 390, 257
- [12] Hacking P.B. and Soifer B.T., 1991, ApJ 367, L49
- [13] Kerrick A. D. et al. , 1995a, ApJ 452, L59
- [14] Kerrick A. D., et al., 1995b, ApJ 438, L59
- [15] MacMinn D. and Primack J.R., 1996, Spac. Sci. Rev. 75, no.1-2, 413
- [16] Malkan M. A. and Stecker F. W., 1997, ApJ in press, astro-ph/9710072
- [17] Mannheim K., 1997, Science, to appear
- [18] Meyer H. and Westerhoff S., 1996, Proceedings of the Heidelberg Workshop on GAMMA-RAY EMITTING AGN, Heidelberg, Germany
- [19] Peebles P.J.E., 1993, Principles of Physical Cosmology, Princeton Univ. Press
- [20] Petry D., Bradbury S.M., Konopelko A., et al., 1996, A&A 311, L13
- [21] Petry D., 1997, PhD thesis, MPI für Physik, München (MPI-PhE/97-27)
- [22] Puget J.L., Abergel A., Bernard J.P., et al., 1996, A&A 308, L5
- [23] Punch C.W., et al., 1992, Nature 358, 477
- [24] Stanev T. and Franceschini A., 1997, astro-ph/9708162
- [25] Stecker F. W., de Jager O. C., Salamon M. H., 1992, ApJ 390, L49
- [26] Stecker F. W., de Jager O. C., Salamon M. H., 1994, Nature 369, 294