Mixed Early and Late-Type Properties in the Bar of NGC 6221: Evidence for Evolution along the Hubble Sequence?††thanks: Based on observations collected at the European Southern Observatory, La Silla (Chile).
Abstract
Rotation curves and velocity dispersion profiles are presented for both the stellar and gaseous components along five different position angles (P.A.=, , , , and ) of the nearby barred spiral NGC 6221. The observed kinematics extends out to about from the nucleus. Narrow and broad-band imaging is also presented. The radial profiles of the fluxes ratio [] ( 6583.4 Å)/H reveal the presence of a ring-like structure of ionized gas, with a radius of about and a deprojected circular velocity of about 280 . The analysis of the dynamics of the bar indicates this ring is related to the presence of an inner Lindblad resonance (ILR) at 1.3 kpc. NGC 6221 is found to exhibit intermediate properties between those of the early-type barred galaxies: the presence of a gaseous ring at an ILR, the bar edge located between the ILR’s and the corotation radius beyond the steep rising portion of the rotation curve, the dust-lane pattern, and those of the late-type galaxies: an almost exponential surface brightness profile, the presence of H regions along all the bar, the spiral-arm pattern. It is consistent with scenarios of bar-induced evolution from later to earlier-type galaxies111Tables 3, 4, 5, 6, 7 and 8 are only available in electronic form at the CDS via anonymous ftp to cdsarc.u-strasbg.fr (130.79.128.5) or via http://cdsweb.u-strasbg.fr/Abstract.html.
Key Words.:
galaxies: individual: NGC 6221 – galaxies: kinematics and dynamics – galaxies: bars – galaxies: evolution – galaxies: interactions1 Introduction
NGC~6221 is a nearby spiral classified as Sbc(s) by Sandage & Tammann (1981) and as SBc(s) by de Vaucouleurs et al. (1991). In The Carnagie Atlas of Galaxies (Panel 189) Sandage and Bedke (1994) describe its morphology as semichaotic with two symmetric heavy dust lanes starting from the nucleus and threading through the middle of the opposite thick arms, which begin at the centre. They also stated that although the galaxy is not strongly barred its dust pattern is similar to that of prototype SBb galaxies, characterized by two straight dust lanes. An overview of the optical properties of the galaxy is given in Table 1.
NGC 6221 forms an apparent physical pair with the late-type spiral NGC~6215. They have a systemic velocity of (this paper) and (RC3) respectively. Their angular distance is about 26′ (RC3) corresponding to a projected linear separation of about 227 kpc at a mean distance of 30 Mpc () The galaxy is also possibly interacting with two newly discovered low-surface brightness galaxies nearby (Koribalski 1996a).
The dynamics of the ionized gas component in this galaxy has been studied by Pence & Blackman in 1984 (hereafter P&B). They measured a conspicuous S-shaped pattern in the ionized gas velocity field, showing that large velocity gradients occur at the position of the dust lanes in the bar. They have been interpreted as the signature of shock fronts of the gas which reverses its motion from outward to inward as it passes through them.
Philipps (1979) reported that the nuclear spectrum of NGC 6221 exhibits signatures of emission originating from regions and also a weak Seyfert 2 component. He concluded however that the emission line spectrum can be interpreted as gas being ionized by hot young stars without the need to introduce a non-thermal component in the galaxy nucleus. The analysis of the spatial distribution of the ionized gas (Durret & Bergeron 1987) confirmed this picture. Some dozens of regions were identified in the disk region extending as far as 9 kpc from the galaxy nucleus. Although the emission in the nucleus appears to be extended (), the authors conclude that the main ionizing sources are OB stars and that UV and X-ray radiation from the nuclear source might not penetrate the heavily obscured nuclear region. Dottori et al. (1996) also recently suggested that the nucleus of NGC 6221 may harbour sources of type and also a Seyfert 2 source.
In this paper we study the kinematics of the ionized gas and the stellar components in NGC 6221. We present the velocity curves and the velocity dispersion profiles of gas and stars obtained along five different position angles by means of long-slit spectroscopy.
2 Observations and data reduction
2.1 Narrow and Broad-Band Imaging
Two narrow-band images of NGC 6221 were extracted from the ESO NTT archive. They were taken on the night of May 6, 1994 with the NTT Telescope at La Silla. The No. 25 Tektronix TK1024M CCD with pixels was used as detector in combination with SUSI. Each 24mm image pixel corresponds to 0.13. The CCD gain and the readout noise were determined to be 3.4 e- per ADU and 5.9 e-, respectively.
The emission-band image was obtained with the interference ESO filter No. 692 isolating the spectral region containing the redshifted H and [] ( 6583.4 Å) emission lines. The continuum-band image was taken with the interference ESO filter No. 696 isolating an emission-free spectral region. The exposure time was 20 minutes for each filter. The seeing was about
| parameter | value |
|---|---|
| Name | NGC 6221 |
| Morphological type | Sbc(s)a; .SBS5b |
| Position (equinox 2000.0)b | |
| right ascension | 16h 52m |
| declination | ∘ 12′ 59′′ |
| Heliocentric systemic velocity c | |
| Position angle P.Ab | 5∘ |
| Isophotal diameters Dd25b | |
| Inclination | 44∘ |
| Total corrected magnitude b | mag |
-
a
from Sandage & Tamman (1981)
-
b
from de Vaucouleurs et al. (1991)
-
c
from this paper
-
d
from log R25 of de Vaucouleurs et al. (1991)
Standard reduction of the two images was performed using the original available data. The two images were aligned using field stars as reference (with an accuracy better than 0.2 pixel). In each image the sky level was estimated in areas of the frames unaffected by the galaxy light and then subtracted. The continuum-band image was subtracted from the emission-band image after an appropriate intensity scaling, allowing for transmission differences between the filters. No attempt was made to calibrate in flux the resulting pure-emission image of NGC 6221.
Two broad-band images of NGC 6221 in the and the band respectively were extracted from the DENIS data archive (Epchtein et al. 1997). Their reduction was routine.
The reduction of the broad and narrow-band images and the surface photometry of the NTT continuum and DENIS and -band frames was performed by means of standard procedures within the ESO-MIDAS software package.
2.2 Long-Slit Spectroscopy
The spectroscopic observations of NGC 6221 were carried out at the ESO 1.52 m Spectroscopic Telescope at La Silla using the Cassegrain Boller & Chivens Spectrograph in the nights of April 30 and May 2, 1992. The No. 26 1200 grating blazed at 5730 Å, was used in the first order in combination with a 2.5 slit. The No. 24 FA2048L CCD with 20482048 pixels was adopted as detector. It yielded a wavelength coverage of Å between about 4900 and about 6900 Å with a reciprocal dispersion of 65.1 . The instrumental resolution was determined measuring the FWHM of the emission lines of the comparison spectra. We checked that such measured FWHM’s do not depend on wavelength and we found a mean value of FWHM = 2.35 Å (i.e. Å which corresponds in the range of the observed emission lines to ). Each 15mm spectrum pixel corresponds to 0.98Å.
The long-slit spectra of NGC 6221 were obtained at different position angles in order to map the velocity field. The observing log is given in Table 2. The seeing value was about . Each object spectrum was bracketed by two helium-argon calibration spectra. The stars HR 3431 (K4 III), HR 5601 (K0.5 III), HR 6318 (K4 III) and HR 7597 (K0 III) were observed as velocity templates. The standard spectral reduction was performed by using the ESO-MIDAS package. All the spectra were bias subtracted, flat-field corrected by quartz lamp exposures and wavelength calibrated by fitting the position of the comparison lines with cubic polynomials. Pixels affected by cosmic ray events were identified and then corrected. The contribution of night sky was determined from the edge regions (not contaminated by galaxy light) of each spectrum and then subtracted.
| Date | PA | exp. time | comments |
|---|---|---|---|
| [∘] | [s] | ||
| 30Apr1992 | 5 | 3600 | major axis |
| 02May1992 | 50 | 3300 | |
| 02May1992 | 95 | 3600 | minor axis |
| 02May1992 | 125 | 3300 | bar major axis |
| 30Apr1992 | 155 | 3600 |
The stellar velocities and velocity dispersions were measured from the absorption lines in the wavelength range between about 4900 Å and 6200 Å using the Fourier Correlation Quotient technique (Bender 1990) as applied by Bender et al. (1994). The measured radial velocities were corrected to the heliocentric frame of reference. The heliocentric correction was and for April, 30 and May, 2 respectively.
The stellar kinematics measured along the different position angles is given in Table 3. The table provides the position angle (Col. 1), the radial distance from the galaxy centre in arcsec (Col. 2), the observed heliocentric velocity with its respective error (Cols. 3, and 4), and the velocity dispersion with errors (Cols. 5 and 6) in , and the Gauss-Hermite coefficients wtih errors (Cols. 7 and 8) and (Cols. 9 and 10).
The gas velocities and velocity dispersions were measured by means of the MIDAS package ALICE from the H and [] ( 6583.4 Å) emission lines. The position, the FWHM and the uncalibrated flux of each emission line were individually determined by interactively fitting a Gaussian plus a second order polynomial to the emission and its surrounding continuum. The wavelength of the Gaussian centre was converted to the velocity , and then the heliocentric correction was applied. The velocity errors were derived as in Bertola et al. (1996). The Gaussian FWHM was corrected for the instrumental FWHM and then converted to the velocity dispersion . The velocities and the velocity dispersions derived from the two emission lines agree within 5%. At each radius the weighted mean of the velocities and the average of the velocity dispersions were taken as the velocity and velocity dispersion of the NGC 6221 ionized gas respectively.
The ionized gas kinematics measured along the different position angles is given in the five Tables 4–8. Each table provides the radial distance from the galaxy centre in arcsec (Col. 1), the H observed heliocentric velocity with its respective error (Cols. 2 and 3) and velocity dispersion (Col. 4) in , the [] observed heliocentric velocity with error (Cols. 5 and 6) and velocity dispersion (Col. 7) in , the []/H flux ratio (Col. 8), and the averaged ionized gas heliocentric velocity with error (Cols. 9 and 10) and velocity dispersion with error (Cols. 11 and 12) in .
3 Results
3.1 The Surface Photometry
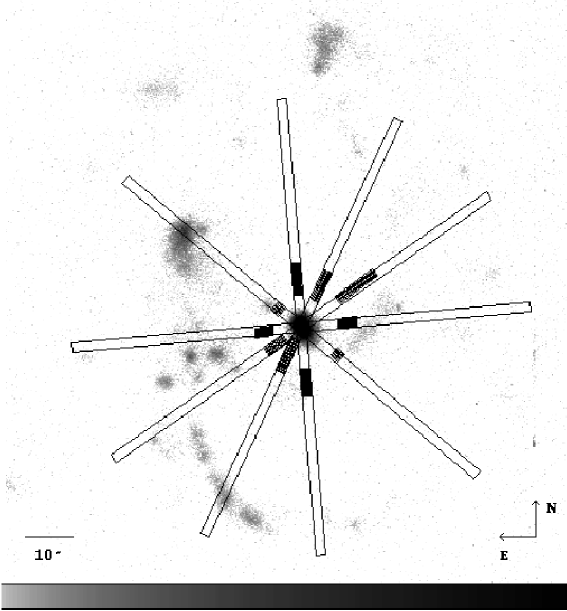
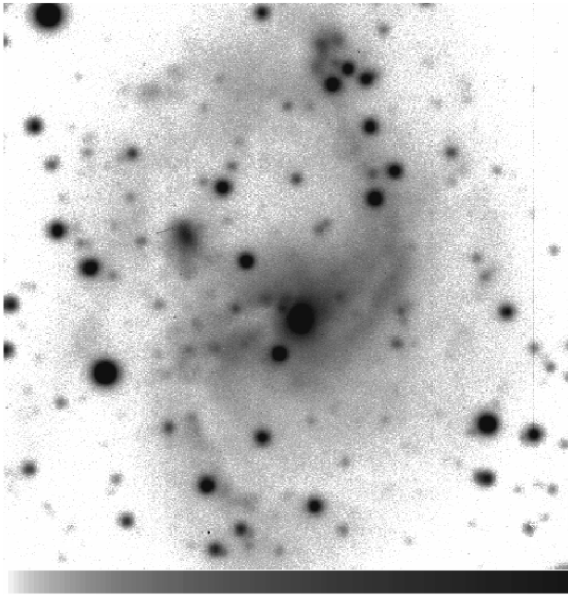
The spatial distribution of the H[] emission is displayed in Fig. 1 together with the slit positions of the long-slit spectra. Most of the emission originates from knots in the spiral arm regions. These knots are the typical signatures of the presence of regions. The emission is also found to originate close to the dust lanes. The complex dust lane structures in the area of the bulge and bar are evident in the continuum image of NGC 6221 (Fig. 2). We estimate a bar projected radius of about in agreement with Elmegreen & Elmegreen (1985).

From the isophotal analysis of the continuum image and the two DENIS images in the bands I and J, the position of the bar was determined. The maximum in ellipticity and the plateau of the position angle profile around P.A. (Fig. 3) were used as indicators of the bar component. This position angle value is also consistent with the orientation of the dust lanes in Fig. 2. P&B derive for NGC 6221 a position angle for the line-of-nodes of . They also stated that the major axis of the bar is exactly perpendicular to the line-of-nodes. We believe they confused the position angles of the major axis of galaxy with that of the bar as can be seen by Fig. 2 in this paper and by Plates 2 and 3 in their paper and from our velocity field. The uncalibrated surface brightness profile of the bar shows an exponential decrease, although heavily influenced by the presence of dust lanes.

3.2 The Radial Profiles of the []/H Ratio

The radial profiles of the fluxes ratio [] ( 6583.4 Å)/H were calculated for all position angles and are presented in Fig. 4. The value of the ratio ([]/H) indicates that the emission is mainly from regions, even in the bulge. The central regions where []/H are marked as black bars along each slit position in Fig. 1. They constitute a ring-like structure with a radius of about ( kpc for the assumed distance), which is is located at the distance from the centre corresponding to the position of a ILR due to the presence of the bar (see § 3.4 for the discussion). The presence of this nuclear gaseous ring is consistent with the observations of Koribalsky (1996b).
3.3 The Ionized Gas and Stellar Kinematics
The measured ionized gas and stellar kinematics of the galaxy NGC 6221 are presented for the observed position angles in Figs. 5–9.
In all the spectra we found an offset of between the stellar kinematical centre (obtained from the position of the maximum intensity of continuum) and the gaseous kinematical centre (estimated from the maximum emission of the H and [] lines).
The position of the gaseous kinematical centre coincides with that estimated by P&B. For to the systemic velocity we measured while P&B obtained a slightly larger value of . If we use the emission lines data as reference for the centre, we find for all intermediate position angles that the folded velocity and velocity dispersion curves of ionized gas and stars present strong asymmetries. On the other hand, using the absorption lines data as reference for the centre the asymmetries of the folded kinematical profiles are minimized. In the following the absorption line data are therefore used to give the true centre for both ionized gas and stars.
In order to bring out the asymmetries in the gas velocity curves we compare them with the empirically derived curve of circular velocity projected onto the different position angles. We adopted the equation of the rotation curve of galaxy represented as a sequence of flattened spheroids of Brandt (1960) as applied by Bettoni & Galletta (1997) for their sample of barred galaxies. The parameters of the curve were found by the best fit to the major axis NE side of ionized gas rotation curve (which has the more regular pattern) assuming a galaxy inclination of (RC3). The resulting curve has been folded for the major axis SW side. Then it has been projected onto the remaining the position angles assuming that the mean motions were symmetric with respect to the galaxy rotation axis. These projected curves (see Figs. 5-9) allow us to estimate when ionized gas and stars deviate from circular motions.
3.3.1 The Major Axis (P.A.)
The kinematics of the ionized gas and starsmeasured along the NGC 6221 optical major axis is shown in Fig. 5.


The ionized gas kinematics extends to about ( kpc) on the receding SE side and to about ( kpc) on the approaching SW side. We found that our gas rotational velocity data agrees within the errors with the measurements obtained by P&B along their spectrum G (P.A.) and deprojected to our position angle. We obtain more detailed measurements in the central region where the velocity gradient is strong ( for ). The velocity dispersion of the gas show within the bulge a peaked trend for with a maximum value of about 130 . In the outer region dominated by the disk component the velocity dispersion is found to be constant at a value of about 50 . Similar peaked velocity dispersion profiles are also found in bulges of elliptical (e.g. Zeilinger et al. 1996) and lenticular galaxies (e.g. Bertola et al. 1995). For the gas velocity curve is very asymmetric as shown by the comparison with the empirical circular velocity curve. In this radial range the gas velocity along the receding side is about 20 lower then the circular velocity. It is about 60 higher along the approaching side. An abrupt change in the slope of the gas velocity curve and a local maximum in the gas velocity dispersion is also observed at about . No emission is detected for .
The stellar kinematics data extend from about ( kpc) on the SE side to near the centre of the galaxy. The velocities of the stars follow closely the trend of the velocities of the gas. The stellar velocity dispersion profile is peaked with a central value of about 200 . At larger radii it drops off to a value of about 70 along the NE side. For the SW side it was not possible to measure the stellar kinematics due to the poor ratio of the absorption lines.
The stellar kinematics of the bulge is found to be consistent with a hot stellar system ( at ). The fact that the velocity dispersion of the gaseous component is of the same order as that of the stellar one indicates a significant contribution of random motions to the dynamical support of the gas as dicussed by Bertola et al. (1995) for a sample of S0 galaxies.
3.3.2 The Intermediate Axis at P.A.
The kinematics of ionized gas and stars measured along the NGC 6221 P.A. is shown in Fig. 6.
The gas kinematics is observed to about ( kpc) on the NE side and to about ( kpc) on the other side. For this intermediate axis our gas velocity data agrees within the errors with those of P&B (spectrum J). The central velocity gradient ( for ) is lower than on the major axis. The gas velocity dispersion has a central maximum of about 120 . It decreases slowly to about 40 with the distance from the centre.
The stellar velocity curve is close to the gaseous one. Except for the stellar velocity dispersion remains higher than the gaseous one of about 20 . The stellar data are as extended as the gas data in the NE side and limited to about ( kpc). The SW side is characterized by regions without emission lines and with low absoption lines. This produces the large errors in the measurement of the velocity of the gas and makes impossible to determine the stellar kinematics.
3.3.3 The Minor Axis (P.A.)
The kinematics of ionized gas and stars measured along the NGC 6221 optical minor axis are shown in Fig. 7.
The gas kinematics is measured to about ( kpc) and to about ( kpc) on the NW and SE side respectively. The gas velocity measurements obtained by P&B along their spectrum B (P.A.) deprojected to P.A. agree within the data errors with the velocities we found along this axis. If we assume an axisymmetric potential for a galaxy we expect to find a zero velocity gradient along the minor axis; nevertheless, here we observe a ‘wavy pattern’ in the gas velocity curve at this position angle. P&B defined this behaviour as a ‘conspicuous S-shaped pattern’ on the isovelocity contours of the gas. For the gas velocity follows the circular velocity only on the NW side. The folded velocity curve is asymmetric for , with a maximum velocity difference between the NW and SE side of about 60 .
In spite of the fact that the minor axis differs by about from the bar position angle, the virtual absence of projected circular motions at this angle makes it possible to study in great detail how the bar affects the dynamics of gas and stars. The non-circular motions have an observed maximum amplitude of about 100 , which is found to be in agreement with the rather general predictions by Roberts et al. (1979), who estimate velocities in the range of 50 to 150 for bar-induced radial components of gas flow. From the analysis of Fig. 2 a projected radial extent of is estimated for the bar component, and this is found to be in agreement with the kinematical data. The gaseous velocity dispersion profile in the region of the bar is found to be constant with a value of about 70 distinctly different from the two preceding postion angles (i.e. at and ) where the profile was peaked at the centre. Outside the bar region the gas velocity dispersion is lower than 50 .
From the above, we can explain the ‘wavy pattern’ in the gas velocity curve along the minor axis as follows. For the central the velocity of the gas shows a negative gradient because it follows the family orbits, a little further out the gradient is inverted on both sides of the velocity curve. This can be explained if we consider that beyond the position of the outer ILR (located at a deprojected radius ) the gas follow the family orbits out to the corotation radius (at a deprojected radius ). Outside the corotation the bar influence declines and the velocity of the gas tends to the systemic velocity, at least on the NW side.
The star kinematics is measured up to a distance of about ( kpc) in the NW side and up to about ( kpc) in the SE side. The velocity curve for the stars agrees within the error limits with the circular velocity. At this angle the velocity dispersion appears significantly higher for the stars than for the gas. The stellar velocity dispersion is higher than 90 at all radii peaking to about 150 in the centre. For the SE side () of the spectra it was not possible to obtain measurements of the stellar kinematics.
3.3.4 The Bar Major Axis (P.A.)
The kinematics of ionized gas and stars measured along the NGC 6221 P.A. are shown in Fig. 8. From the photometrical data we deduced that this is the position angle of the major axis of NGC 6221 bar.
The gas kinematics extends to about ( kpc) from the nucleus on either side. P&B did not obtain gas velocity measures for this angle. The gas velocity curve is strongly asymmetric. It follows the predicted circular velocity only along the approching SE side. On the receding NW side the observed gas velocity is lower (), equal () and higher () than the circular velocity. The observed maximum deviation from the empirical circular velocity is about 80 at . The gas velocity dispersion profile has an ‘M-shaped’ appearance due to the presence of two local maxima. It peaks at about 120 in the centre and at about 140 at . For the outer regions it decreases and it becomes constant with a value lower than 40 .
The stellar kinematics is observed to about ( kpc) on the NW side and to about ( kpc) on the SE side. The stars rotate more slowy than gas with a higher velocity dispersion at all radii. This has a central maximum of about 160 , and remains higher than 80 at larger radii.
3.3.5 The Intermediate Axis at P.A.
The kinematics of ionized gas and stars measured along the NGC 6221 P.A. are shown in Fig. 9.
The gas kinematics is measured up to ( kpc) and up to ( kpc) in the approaching and in the receding side respectively. P&B do not present gas velocity data are at this position angle. The gas velocity curve has the same appearance as that along the major axis, with the exception of a lower velocity gradient. Along all the SE side the observed velocity differs from the circular value by about 60 . The gas velocity dispersion profile has a central maximum of about 140 decreasing to values lower than 60 for .
The stellar kinematics is observed to about ( kpc) on either side of the centre. The stars rotate with similar velocity to the gaseous component. They also show the same velocity dispersion profile as the gas. The ratio for the absorption lines is very low for the SE side where the stellar kinematics is measured only at about from the centre.
3.4 The Location of the Lindblad Resonances
With the empirical curve of the circular velocity derived in the section § 3.3 we are able to calculate the angular velocity and the epicyclic frequency where is the distance from the centre deprojected on the galaxy plane. In Fig. 10 the curves , and are plotted in the inner ( kpc) from the centre.
If we assume the observed ring of ionized gas to be at the outer ILR we derive the pattern speed of the bar from the condition . We have ( kpc) and we find for the bar of NGC 6221 that kpc-1 taking in account all the uncertainties. For this value of there is another intersection with the curve giving the location of the inner ILR. The radius of the inner ILR is small ( kpc), and its precise location is uncertain as it is comparable to the seeing resolution of our observation.
Corotation is located at the radius where the bar pattern speed and the angular velocity are equal, i.e. . We find that the corotation radius is at a distance ( kpc) from the centre. This is consistent with Fig. 2 where the bar seems to finish between and corresponding to about if deprojected onto the galaxy plane.
No outer Lindblad resonance (OLR) is found in the radial range of the observe gas kinematics because the condition is not satified for any value of the radius .

4 Discussion and Conclusion
The possible link between bar component and nuclear activity has a long history either in the observational and in the theoretical field (e.g. Shlosman 1994). Recent observations have lead Ho et al. (1997) to disagree with this idea and to conclude that, even though the presence of a bar can enhance star formation in the bulge region, it does not affect significantly the active nucleus. Our data for NGC 6221 support this interpretation, because the physical properties of the central line emitting region indicate clearly that ionization comes from the presence of stellar sources. An AGN and its observational signatures might be obscured by gas and dust, but this is, of course, speculation.
The asymmetries of the velocity curves outside the bar region may be due to a tidal distorsion caused by NGC 6215. Koribalski (1996a) discovered an bridge between NGC 6221 and NGC 6215 and later (Koribalski 1996b) suggested a possible interaction of NGC 6221 with the two newly discovered low-surface brightness galaxies nearby, namely BK1 and BK2.
Elmegreen & Elmegreen (1989) and later Keel (1996) proposed a dichotomy of bar properties between early-type (Sbc and earlier) and late-type galaxies (Sc and later) based on observational properties such as bar size, density profile of the bar, star formation, and so on. Early-type bars tend to be a dominant component in the galaxy with a flat density profile extending out to the corotation radius, where they drive symmetric spiral arms (Combes & Elmegreen 1993). On the contrary, bars in late-type galaxies are small with exponentially decreasing density profiles, which extend only to the ILR radius. These kind of bars are unable to influence the wave pattern of the stellar disk. This view is also supported by the model of Combes & Elmegreen (1993).
NGC 6221 is found to exhibit intermediate properties between early-type and late-type barred spiral galaxies, as discussed below:
- i) Late-type features:
-
The surface brightness profile shows an exponential decrease; the star formation, i.e. the H emission, is detected along all the bar; the arm structure is typical of a late-type.
- ii) Early-type features:
-
The edge of bar is located between the outer ILR radius and the corotation radius beyond the rising part of the velocity curve; the strong gradient of gas velocity curve in the central kpc; the dust-lane pattern is similar to that of the prototype SBb galaxies (see NGC~1300 in Panels S8 and 154 in the CAG as example); the radial profiles of the fluxes ratio of the H and [] emission lines reveal the presence of a ring structure associated with an ILR; moreover NGC 6221 is interacting with NGC 6215, and Elmegreen et al. (1990) have demonstrated the presence of bars in paired early-type spirals.
Indeed the case of NGC 6221 is analogous to that of certain other galaxies, notably NGC 1300 (Combes & Elmegreen 1993). It has been classified as a late-type barred spiral because of the presence of gas, star formation and spiral arms, but it could be considered as an early-type due to the dynamical properties of its bar.
Pfenniger (1992) has suggested that a major effect due to the presence of a bar could be that the galaxy evolves towards earlier morphological types. Our study indicates that NGC 6221 is a typical case of a late-type barred spiral evolving to an earlier type. If our interpretation is correct, it is understandable that there is so difficult to reach agreement about its morphological classification which is Sbc(s) in RSA and SBc(s) in RC3. Sometimes the criteria of classification in the Hubble sequence cannot describe exactly the complicated scenario of the evolution of galaxies, as appears to be the case for NGC 6221.
Acknowledgements.
The DENIS team and in particular the operations team at La Silla is warmly thanked for making this work possible. The DENIS project is supported by the SCIENCE and the Human Capital and Mobility plans of the European Commission under grants CT920791 and CT940627, the European Southern Observatory, in France by the Institut National des Sciences de l’ Univers, the Education Ministery and the Centre National de la Recherche Scientifique, in Germany by the State of Baden-Wuerttenberg, in Spain by the DGICYT, in Italy by the Consiglio Nazionale delle Ricerche, in Austria by the Science Fund (P8700-PHY,P10036-PHY) and Federal Ministry of Science, Transport and the Arts, in Brazil by the Foundation for the development of Scientific Research of the State of Sao Paulo (FADESP). JCV acknowledges the support by a grant of the Telescopio Nazionale Galileo and Osservatorio Astronomico di Padova. WWZ acknowledges the support of the Jubiläumsfonds der Österreichischen Nationalbank (grant 6323). The research of MS is supported by the Austrian Science Fund projects P9638-AST and S7308. EMC acknowledges the head of IAC for hospitality during the preparation of this paper. This work was partially supported by grant PB94-1107 of the Spanish DGICYT. The authors thank S. García Burrillo for his valuable comments about bars, and B. Koribalski for her useful information about NGC 6221 interaction with its companions.References
- (1) Bender, R. 1990, A&A, 229, 441
- (2) Bender, R., Saglia, R.P., Gerhard. O.E. 1994, MNRAS, 269, 785
- (3) Bertola, F., Cinzano, P., Corsini, E.M., Rix, H.-W., Zeilinger, W.W. 1995, ApJ 448, L13
- (4) Bertola, F., Cinzano, P., Corsini, E.M., Pizzella, A., Persic, M., Salucci, P. 1996, ApJ, 458, L67
- (5) Bettoni, D., Galletta, G. 1997, A&AS, 124, 61
- (6) Brandt, J.C. 1960, ApJ, 131, 293
- (7) Combes, F., Elmegreen, B.G. 1993, A&A, 271, 391
- (8) de Vaucouleurs, G., de Vaucouleurs, A., Corwin, H.G.Jr., Buta, R.J., Paturel, G., Fouquè, P. 1991, Third Reference Catalogue of Bright Galaxies, Springer-Verlag, New York (RC3)
- (9) Dottori, H., Duval M.F., Carranza, G., Goldes, G., Diaz, R., Paolantonio, S. 1996, RMxAA, 4, 136
- (10) Durret, F., Bergeron, J. 1987, A&A, 173, 219
- (11) Elmegreen, B.G., Elmegreen, D.M. 1985, ApJ, 288, 438
- (12) Elmegreen, B.G., Elmegreen, D.M. 1989, ApJ, 342, 677
- (13) Elmegreen, D.M., Bellin, A.D., Elmegreen, B.G. 1990, ApJ, 364, 415
- (14) Epchtein, N., Debatz, B., Capoani, L., et al. (49 authors) 1997, The Messenger, 87, 27
- (15) Ho, L.C., Filippenko, A.V., Sargent, W.L.W. 1997, ApJ, 487, 591
- (16) Keel, W.C. 1996, In: Barred Galaxies, IAU Coll. 117, Buta R., Crocker D.A., Elmegreen B.G. (eds.), ASP Conf. Ser. 91, ASP, San Francisco, p. 56
- (17) Koribalski, B. 1996a, In: Barred Galaxies, IAU Coll. 117, Buta R., Crocker D.A., Elmegreen B.G. (eds.), ASP Conf. Ser. 91, ASP, San Francisco, p. 172
- (18) Koribalski, B., 1996b, In: The Minnesota Lectures on Extragalactic Neutral Hydrogen, Skillman E.D. (ed.), ASP Conf. Series 106, ASP, San Francisco, p. 238
- (19) Pence, W.D., Blackman, C.P. 1984, MNRAS 207, 9
- (20) Pfenniger, D. 1992, In: Physics of Nearby Galaxies: Nature or Nurture?, 27th Rencontre de Moriond, Thuan T.X., Balkowsky C., Tran Thanh Van J. (eds.), Editons Frontieres, Gif-sur-Yvette, p. 519
- (21) Philipps, M.M. 1979, ApJ 227, L121
- (22) Roberts, W.W.Jr., Huntley, J.M., van Albada, G.D. 1979, ApJ, 233, 67
- (23) Sandage, A., Bedke, J. 1994, The Carnegie Atlas of Galaxies, Carnegie Institution, Flintridge Foundation, Washington (CAG)
- (24) Sandage, A., Tammann, J. 1981, A Revised Shapley-Ames Catalog of Bright Galaxies, Carnegie Institution, Washington (RSA)
- (25) Shlosman, I., 1994, Mass-Transfer Induced Activity in Galaxies, Cambridge University Press, Cambridge
- (26) Zeilinger, W.W., Pizzella, A., Amico, P., Bertin, G., Bertola, F., Buson, L.M., Danziger, I.J., Dejonghe, H., Sadler, E.M., Saglia, R.P., De Zeeuw, P.T. 1996, A&AS 120, 257