X-ray Spectral Properties of -ray Bursts
Abstract
We summarize the spectral characteristics of a sample of 22 bright -ray bursts detected with the -ray burst sensors aboard the satellite Ginga. This instrument employed a proportional and scintillation counter to provide sensitivity to photons in the 2 - 400 keV range, providing a unique opportunity to characterize the largely unexplored X-ray properties of -ray bursts. The photon spectra of the Ginga bursts are well described by a low energy slope, a bend energy, and a high energy slope. In the energy range where they can be compared, this result is consistent with burst spectral analyses obtained from the BATSE experiment aboard the Compton Observatory. However, below 20 keV we find evidence for a positive spectral number index in approximately 40% of our burst sample, with some evidence for a strong rolloff at lower energies in a few events. We find that the distribution of spectral bend energies extends below 10 keV. The observed ratio of energy emitted in the X-rays relative to the -rays can be much larger than a few percent and, in fact, is sometimes larger than unity. The average for our sample is 24%.
Introduction
Twenty-five years after their discovery, -ray bursts (GRB) continue to defy explanation. Analysis of burst energy spectra remains one of the principal methods for determining the physical processes responsible for these events. Results from the Burst and Transient Source Experiment (BATSE) on the Compton Gamma Ray Observatory (CGRO) have demonstrated the diversity of GRB spectral continua in the keV range B93 , however, few instruments to date have probed the X-ray regime of GRB between 2 and 20 keV. Based on the first detections of X-rays in the 1-8 keV range from GRB Wheat , the GRB detector (GBD) flown aboard the Ginga satellite was specifically designed to investigate burst spectra in the X-ray regime Mur89 . Ginga was launched in February of 1987, and the GBD was operational from March, 1987 until the reentry of the spacecraft in October, 1991. Several important results have emerged from the study of burst spectra recorded with the GBD. For example, Ginga has observed X-ray tails in a number of bursts, as well as X-ray preactivity in one event Yos89 ; Mur92 . More recently, Beppo-Sax has observed several bursts in both X-rays and -rays and discovered soft X-ray afterglows Piro ; Costa . This latter discovery has opened the way for the long sought GRB counterparts, including one with a measured redshift Metz .
Before BATSE, the analysis of GRB spectra suggested that their continua could be fit by a range of models, with power law, optically thin thermal bremsstrahlung and thermal synchrotron formulae providing acceptable fits to many spectra Mazets ; Hurley . It is not at all clear, however, that the corresponding physical processes are responsible for the observed spectra.
Instrument Summary and Analysis
The GBD consisted of a proportional counter (PC) covering the 2-25 keV range and a scintillation counter (SC) recording photons between 15-400 keV. Each detector had an 60 cm2 effective area. In burst mode the GBD recorded spectral data at 0.5 s intervals for 16 s prior to and 48 s after the trigger (MRO data). In the event that MRO data was not available for a burst, we used the spectral data from the “real time” telemetry modes. For these bursts, spectral data were available with either 2, 16, or 64 second accumulations. For most bursts a linear fit to the MRO data in each energy channel provided a reasonable fit to the background. Events with large variations in the background were rejected from our analysis. For several events, the background was estimated from real-time data. The background subtracted spectra were then fitted using a standard minimization technique. We have adopted the spectral model employed by B93 because of its relative simplicity and ability to accurately characterize a wide range of spectral continua, in addition this choice facilitates direct comparison of our results with BATSE bursts. This model has the form
| (1) |
| (2) |
where is an overall scale factor, is the low energy slope, is the high energy slope and is the exponential cutoff or bend energy. From the GRB identified by the GBD Og , we selected for analysis 22 bright events for which good spectral data were available.
Sky positions for four of the events in our sample are known because of simultaneous detections with either BATSE or WATCH. For the remaining events, the incidence angle of the photons into the detectors is uncertain ( equals normal incidence). Since the detector response is a function of this angle, the inferred source spectrum and thus peak intensity of these events is also somewhat uncertain. We selected for the incidence angle when the angle was unknown. This is a typical angle considering that the mechanical support for the window on the PC acts as a collimator limiting the field of view to an opening angle of degrees. We used Monte Carlo simulations to evaluate the impact of the unknown incidence angle. For each simulation, we selected a random incidence angle between 0 and 60 degrees. We calculated a response matrix and used it with the burst’s best fit parameters to generate simulated spectra. Background was added and Poisson statistics applied. We then analyzed the simulated data the same way we analyzed the burst data: an estimated background was subtracted and the best fit parameters were found based on a response matrix corresponding to . Based on these simulations we conclude that the lack of knowledge of the incidence angle into Ginga does not introduce much more uncertainty than the counting statistics. On average, because of the uncertain incidence angle, the confidence region for is 22% larger and the confidence region for is larger by 0.06 than that produced by counting statistics alone (cf. Stroh for details of the simulations).
X-ray Spectral Characteristics of GINGA Bursts
Our spectral fits are generally acceptable, with of order unity for most of the bursts. In agreement with B93 we find that a range in the model parameters is required to adequately describe GRB spectra. Of particular interest is the behavior of the Ginga sample at X-ray energies. About 40% of the bursts in the sample show a positive spectral slope below 20 keV (i.e., ), with the suggestion of rolloff toward lower energies in a few of the bursts ( as large as ). Unfortunately, the lack of data below 1 keV, and the often weak signal below 5-10 keV precludes us from establishing the physical process (photoelectric absorption, self-absorption) that may be involved in specific bursts. The remainder of the burst spectra continue to increase below 10 keV. Observations of the low-energy asymptote can place constraints on several GRB models, most notably the synchrotron shock model which predicts that should be between -3/2 and -1/2 Katz . BATSE data have been used to argue that some GRB violate these limits during some time-resolved samples Crider . We find violations of these limits in the time-integrated events.
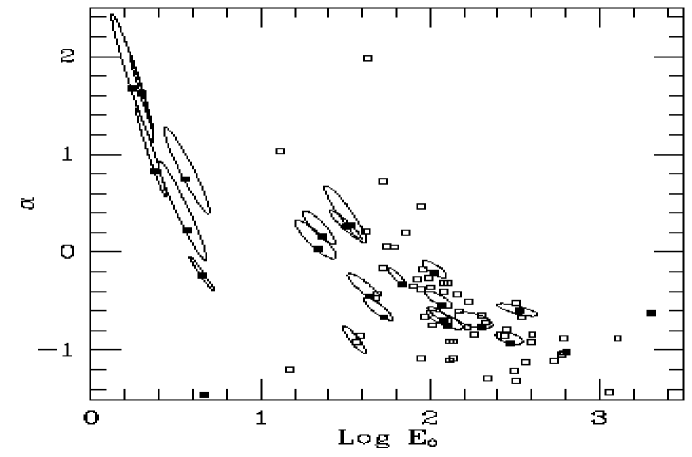
In Figure 1, we show the 68% confidence regions for 20 of the bursts in our sample. These confidence regions include our estimate of the effects of the uncertain incidence angle. For two bursts we only show the best fit parameters as solid squares because a simple power law could nearly fit the entire spectra. In Figure 1 we also show the new Ginga results with those of B93 . The open squares are the BATSE results and the solid squares are the Ginga results. Many of the Ginga points lie within the range found by BATSE. However, the lowest found by BATSE was 14 keV (set, of course, by the lowest energy observed by BATSE). Ginga extends values down to 2 keV. BATSE had a small fraction (15%) of events with whereas Ginga has 40% of events with . In general this is because there is a correlation between and such that the lower energy range of Ginga samples a parameter space with more events with . For the 76 points, the Pearson’s coefficient is -0.62. The formal significance is about 4 although that ignores the complicated error bars that are caused by the fact that the observations tend to agree with a range of . However, the existence of the correlation seems reasonable: there are virtually no events seen by BATSE at large , large and few low , low events seen by Ginga.
In our sample of bursts, we find that can be both positive and negative. Negative ’s are often seen in time-integrated BATSE spectra. Positive ’s where the spectrum rolls over at low energies are usually only seen in time resolved BATSE spectra Crider .
The Ginga trigger range (50 to 400 keV) was virtually the same as BATSE’s. Thus, we do not think we are sampling a different population of bursts, yet we get a different range of fit parameters. The lack of events with ’s between 6 and 20 keV cannot be used to support two populations because we do not have enough events. One possible explanation might be that GRBs have two break energies, one often in the 50 to 500 keV range and the other near 5 keV. Both BATSE and Ginga fit with only a single break energy so BATSE tends to find breaks near the center of its energy range and we tend to find breaks in our energy range. Without good high energy observations of bursts with low , it is difficult to know whether they also have a high energy bend.
Preece utilized a BATSE low energy discriminator channel and detected emission in excess of what would be expected from a fit at higher energy. They report excesses in 15% of the investigated BATSE bursts. One of our bursts, GB880205, shows a clear strong excess at low energy and two other Ginga bursts, GB880830 and GB910418, probably also show an excess. For GR910418, Preece also reported an excess. From Preece we would expect about 3 of our bursts to show an excess so we are consistent with the BATSE result.
References
- (1) Band. D., et al. 1993, ApJ, 413, 281
- (2) Costa, E. et al. 1997, Nature, 387, 783
- (3) Crider, A., et al. 1997, ApJ, 479, L93
- (4) Hurley, K. 1989, in NATO ASI Series C, Vol. 270, Cosmic Gamma Rays, Neutrinos, and Related Astrophysics, ed. M. M. Shapiro & J. P. Wefel (Dordrecht: Kluwer), 337
- (5) Katz, J. I., 1994, ApJ, 432, L107
- (6) Mazets, E. P., Golenetskii, S. V., Ilyinskii, V. N., Aptekar, R. L., 1982, Astrophys. Space Sci., 82, 261
- (7) Metzger, A. E., Parker, R. H., Gilman, D., Peterson, L. E., & Trombka, J. I., 1974, ApJ, 194, L19
- (8) Murakami, T., Inoue, H., van Paradijs, J., Fenimore, E., & Yoshida, A., 1992b, in Gamma-Ray Bursts, ed. C. Ho, R. I. Epstein & E. E. Fenimore, (Cambridge: Cambridge University Press), 239
- (9) Murakami, T. et al. 1989, PASJ, 41, 405
- (10) Ogasaka, Y., Murakami, T., Nishimura, J., Yoshida, A. & Fenimore, E. E., 1991, ApJ, 383, L61.
- (11) Piro, L. et al. 1997, A&A, in press.
- (12) Preece, R., et al., 1996, ApJ, 473, 310
- (13) Strohmayer, T. E., Fenimore, E. E., Murakami, T. & Yoshida, A. 1997, ApJ, in press.
- (14) Wheaton, W. A., et al. 1973, ApJ, 185, L57
- (15) Yoshida, A., et al. 1989, PASJ, 41, 509