Abstract
We present our measurements of the deuterium to hydrogen ratio (D/H) in QSO absorption systems, which give D/H = 3.40 based on analysis of four independent systems. We discuss the properties of two systems which provide the strongest constraints on D/H. We outline the systematic effects involved in measurements of D/H and introduce a sophisticated method of analysis which properly accounts for these effects.
Key words: Cosmology: nucleosynthesis, abundances; Quasars: absorption lines
Section 1 Introduction
The status of standard big bang nucleosynthesis (BBN) has been extensively reviewed in these proceedings and in the recent literature (Copi et al. 1995; Sarkar 1996; Hata et al. 1997; Cardall & Fuller 1996; Fuller & Cardall 1996; Schramm & Turner 1997). It has been emphasized that a determination of the primordial deuterium abundance has the potential to constrain the predictions of BBN, test the standard model, and give a precise measure of the present-day baryon density. Recent measurements of D/H towards bright, distant QSOs are now realizing this potential, and are already giving improved constraints on the models of BBN. (Tytler & Burles 1997).
Hogan (1998) gives a thorough overview of the present status of extragalactic D/H measurements; here we focus on measurements of the systems for which we have obtained high-quality spectra with the HIRES spectrograph (Vogt et al. 1994) and Keck1 10-m telescope.
Section 2 The Measurements
We have analyzed four high-redshift QSO absorption systems which place useful constraints on D/H. We show the limits on D/H in each of these systems in Fig. 1. Two of the systems, towards Q1251+3644 and Q1759+7539 have larger uncertainties for different reasons. Q1251+3644 is a faint QSO (V=19), and over 10 hours of observing time yields a spectrum with modest signal-to-noise ratio (SNR = 10) at high-resolution. The SNR drops quickly at lower wavelengths, and we cannot extract useful information from the highest order Lyman lines as a result. The system towards Q1759+7539 is a complex system of absorbers with a very high neutral hydrogen column density, log N(H I) (all column densities expressed in cm-2 ). The analysis of that system gives only an upper limit on D/H, at the 95% confidence level; the constraints are obtained from comparing the line profiles of Ly and Ly to the profile of Ly . The method used to extract the limits on D/H will be described below. These results are preliminary, and improved constraints will require more data to allow a robust analysis.

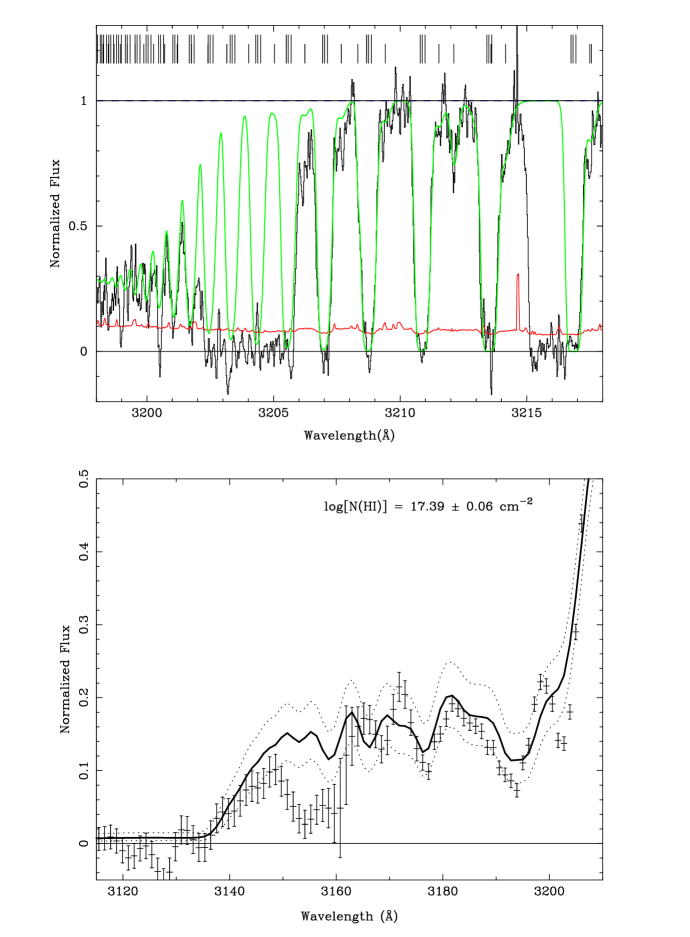
Top: HIRES spectrum (FWHM = 8 km/s) showing Lyman lines 11 through 24, and model fit with three components and total H I column density, log N(H I) = 17.31.
Bottom: Lick spectrum (FWHM = 4 Å) showing residual flux and model fit shortward of Lyman limit. The solid line shows the best fit model with log N(H I) = 17.39, and dotted lines represent 68% confidence levels. Absorption shortward of 3135 Å is due to a lower redshift Lyman limit system.
Tytler et al. (1996) made the first measurement of low D/H in the absorption system at towards Q1937–1009. We analyzed the high-resolution spectrum (8 hrs of exposure), which resolved the entire Lyman series up to Ly-19, as well as associated metal lines. By profile fitting the Lyman lines, with the position of the velocity components given by the metal lines, we find D/H = 2.3 (statistical and systematic errors). The largest uncertainty in the measurement is the neutral hydrogen column density, log N(H I) = 17.94 , and the uncertainty stems from the saturated Lyman profiles (discussed in detail below). We then obtained a high quality low-resolution spectra from Keck with LRIS (Oke et al. 1995), which gave better sensitivity shortward of the Lyman limit, to directly measure the total N(H I) in the system and therefore place better constraints on D/H. Utilizing both the high and low-resolution spectra, we find log N(H I) = 17.86 by a direct measurement of the optical depth shortward of the Lyman limit at 4200 Å (Burles & Tytler 1997a). With this constraint and a more sophisticated fitting procedure, we measure D/H = 3.3 (Burles & Tytler 1997b).
We discovered an absorption system at towards Q1009+2956 ideal for a measurement of D/H. This system has a lower hydrogen column density, log N(H I) = . The highest order Lyman lines become unsaturated, which yields a precise measurement of N(H I) in both low and high resolution spectra (Fig. 2). Over twelve hours of Keck+HIRES produced a very high quality spectrum of the entire Lyman series, resolving the entire series up to Ly-22. We find strong evidence for contamination of the deuterium Ly absorption feature, which unfortunately introduces the largest uncertainty in the measurement. With the contamination included in the analysis, we measure D/H = 4.0 (Burles & Tytler 1997c).
The four independent systems support a low primordial abundance of deuterium, and together give D/H = 3.4 . If this represents the primordial value, nucleosynthesis calculations from standard BBN models with three light neutrinos give the baryon-to-photon ratio, and the baryon density, . We arrive at very small statistical errors (10% at 95% confidence), so we must confront the existence of systematic effects. In the remainder of this paper we present a sophisticated method that we use in order to properly account for the systematic effects currently known.
Section 3 An Improved Method to Measure D/H
Many groups have reported detection of deuterium in absorption along the line of sight to distant QSOs (Songaila et al. 1994; Carswell et al. 1994; Tytler et al. 1996, Wampler et al. 1996; Rugers & Hogan 1996a,b; Webb et al. 1997; Burles & Tytler 1997b,c). Here, we put forward an improved method to measure D/H, which has many advantages over the current, widely used, methods.

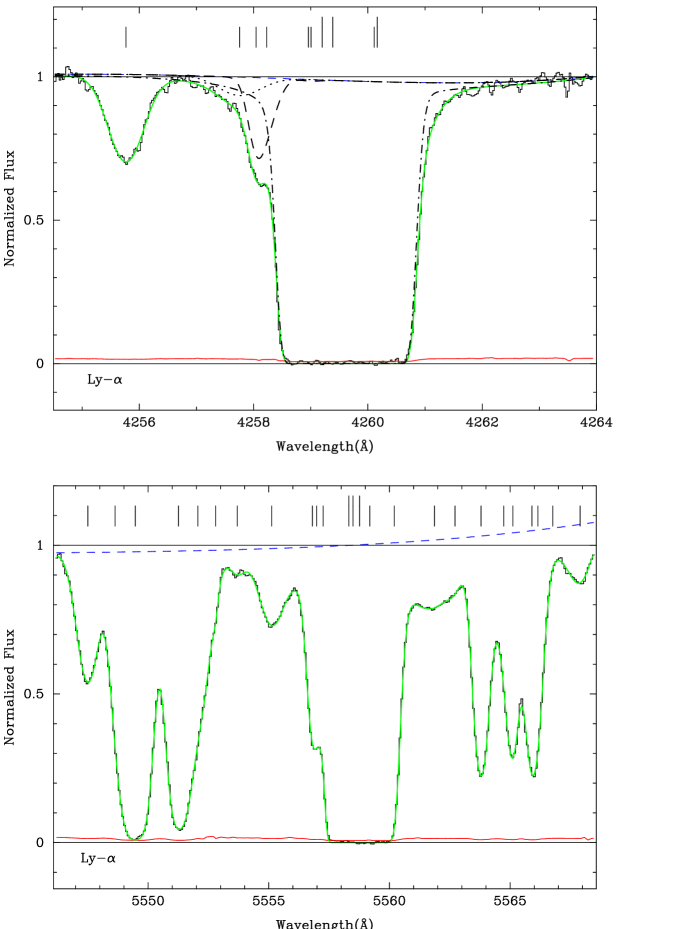
Bottom: Ly region of system towards Q1937–1009. The dashed line shows the best fit continuum level.
The goal is to extract from the spectrum of a QSO absorption system the most likely value of D/H, and the confidence intervals about that value. We are still required to model the D/H absorption system (DHAS) with a finite set of parameters (based on physical assumptions) to compare to the observed spectrum. With a given model, we can quickly minimize the difference between model and data, parameterized as , and use the final parameters to find the most likely value of D/H. But the uncertainty in D/H depends on correlations in the parameters, and is non-trivial to extract from the best fit solution.
The function depends on the N parameters included to model the observed spectrum. Instead of mapping the function in the full N dimensional parameter space, we choose to map versus a single parameter, D/H (known as the “ridge” method). Towards Q1937-1009, for example, we compare a model with 234 free parameters to regions of the high-resolution spectrum which total 1298 pixels. We note the inventory of free parameters: 3 main components in Lyman limit system with 4 parameters each (N(H I), , T, ) + 9 spectral regions with a total of 29 parameters for the continuum + 64 other H I lines with 3 parameters each (N(H I), , ) which are near and affect the absorption lines of the D/H system + 1 parameter for D/H: 3 x 4 + 29 + 64 x 3 + 1 = 234. To construct the minimized function versus D/H alone, we choose a value for D/H, fix D/H for the iteration, and allow the other 233 parameters to freely change to minimize . We choose and fix a new value for D/H, and minimize again. The results for both Q1937–1009 (this example) and Q1009+2956 are shown in Fig. 3. In Fig. 4 (bottom panel), note the large number (19) of H I lines which must be included in the Ly region of Q1937-1009.
In this paper we present the difficulties inherent to measurements of D/H in QSO absorption systems, and discuss techniques we have implemented to overcome the systematic effects. We outline an improved method to measure D/H, which accounts for the total uncertainty, in contrast to the statistically uncorrelated errors of D and H column densities summed in quadrature. We show that the best two current measurements of D/H are complementary and give a robust measure of the primordial value, .
Section 4 Systematic uncertainties in D/H measurements
In this section, we describe the systematic uncertainties which are known to exist in measurements of D/H in QSO absorption systems. We explain how we account for the systematics, with the assumption that the nature of the effect is understood.
4.1 Intrinsic QSO continuum
The observed QSO spectra are combinations of the intrinsic spectrum of the source with intervening absorption features. In the measurement of D/H, we are solely interested in the intervening features. We attempt and require the removal of the intrinsic QSO spectrum (continuum) to analyze the absorption features in the observed spectrum. The QSO continuum changes on much longer wavelength scales than the narrow absorption lines. A polynomial of low-order traces the smooth variations of the QSO continuum and gives the normalization of the observed spectrum to the QSO continuum. This procedure (called “continuum fitting”) is not exact, and even worse, not well defined. However, abundance measurements in QSO absorption systems have not taken into account the uncertainties introduced by subjectively fitting a fixed continuum to the observed spectrum. Once a continuum fit is complete, the solution is assumed, for all practical purposes, correct with no uncertainty. We have overcome this problem by assuming the continuum is not fixed or well determined. As a part of the abundance measurements, we include free parameters to account for the unknown shape and level of the continuum in regions of interest in the observed spectrum. We still fit an initial continuum (a first guess), but this is not assumed absolute or correct, only a likely estimate. The procedure has been outlined in Burles & Tytler (1997b), and should be adopted for all abundance measurements which could be influenced by continuum uncertainties.
As examples, we show the Ly regions of Q1009+2956 (top) and Q1937–1009 (bottom) in Fig 4. The initial continuum estimate is the solid line at unity and is used to normalize the spectrum before profile fitting. The smooth dashed line near unity is the resulting best fit continuum with five free parameters. The level of the final continuum lies near the initial estimate on the D/H Ly feature, which confirms that the initial estimate was fairly well chosen. Allowing for a free continuum does not necessarily change the central value, but ensures that the final uncertainties take properly into account the uncertain nature of the intrinsic QSO continuum.
4.2 Hydrogen Contamination of Deuterium
The absorption features of the Lyman series of H I and D I are modeled to measure D/H in QSO absorption systems. These features reside exclusively in the Ly forest and are subject to blending, and therefore, contamination from other Lyman absorption. The line density of the Ly forest rises steeply with redshift, so measurements at higher redshift, , are subject to more contamination from random, unrelated Ly lines. The a posteriori probability of unrelated H I contamination can be estimated from the statistical distirbution of Ly forest lines. (Steigman 1994, Tytler et al. 1996, Tytler & Burles 1997, Jedamzik & Fuller 1997, Hogan 1998). On the other hand, structure in the absorption systems will increase with decreasing redshift, so contamination of measurements at lower redshift, , is dominated by Lyman absorption correlated on scales of the D-H velocity separation, 82 km s-1 . We must test for the presence of contamination in all measurements and ensure that the final results properly account for its existence. Contamination always gives lower values of D/H. A measurement which does not include contamination in the analysis gives an upper limit on D/H. In Fig. 4, we show the individual profiles of H I (dot-dashed) and D I (dashed) in the Lyman limit system and unrelated H I contamination redward of the D I profile (dotted line). Contamination was included in analysis towards both Q1937–1009 and Q1009+2956.
4.3 Saturated Absorption features
In measurements of D/H, one must select systems with high neutral hydrogen column densities, log N(H I) , to be sensitive to D/H values less than 10-4. In these systems, most of the lines of the Lyman series have saturated (optical depth, ) line centers. We obtain spectra with high signal-to-noise ratio (SNR) of the region shortward of the Lyman limit to independently constrain N(H I). It is possible to obtain a direct measurement of the total H I column in systems with 17 log N(H I) 18, 0.6 6.0, where is the optical depth of Lyman continuum absorption at 912 Å (rest frame). The residual flux shortward of the Lyman limit provides a direct estimate of N(H I), independent of other characteristics of the system (e.g. velocity dispersion or deuterium column density). To obtain an accurate measurement, we must account for unrelated Lyman absorption from other systems and the uncertainty of the intrinsic QSO continuum near the Lyman limit (see sec. 4.1). The majority of the Lyman absorption features can be specified by their related absorption features in high-resolution spectra (at higher wavelengths). The remaining features are statistically included from well determined Ly forest distributions [Kirkman & Tytler 1997]. The QSO continuum near the Lyman limit can be determined to better than 10% by utilizing high-resolution spectra (c.f. Burles & Tytler 1997a). The uncertainty in the N(H I) measurement is proportional to the continuum uncertainty, N(H I) (cont) . In Fig. 2, we show the Lyman limit region of the D/H system in two separate spectra of Q1009+2956. The high resolution spectrum (top, FWHM = 8 km s-1 , 0.09 Å) shows the resolved high order Lyman lines up to Lyman-22. The Lyman lines become unsaturated at the highest orders, and give an optical depth in the continuum, . The low resolution spectrum (bottom, FWHM = 4 Å) has better sensitivity and shows significant flux shortward of the Lyman limit at 3200 Å.
A one-parameter model, N(H I), is compared with the low resolution spectra to find the most probable value and confidence intervals of N(H I) (Burles & Tytler 1997a). The features seen in the model fit in Fig. 2 are higher-order Lyman lines (Ly and above) associated with Lyman lines measured at longer wavelengths in the high resolution spectrum. Ly absorption within is drawn from a distribution and included in the Monte Carlo analysis which gives the maximum likelihood of N(H I): log N(H I) = 17.39 , which includes the uncertainties from extrapolation of the unabsorbed QSO continuum.
4.4 The Case of Mesoturbulence
Levshakov et al. (1998, and references therein) have studied the effects of correlations in turbulent velocity fields (mesoturbulence), on line formation in the Ly forest. The standard line profiles (Voigt) are, in fact, the special case of mesoturbulence when the correlation length goes to zero. A substantial amount of work has been published to understand the impact of mesoturbulence on the abundance measurements in absorption systems, with emphasis on D/H (Levshakov & Kegel 1997, Levshakov et al. 1997, Levshakov et al. 1998). We would like to point out a few observational constraints on mesoturbulence, and the limited role it plays (in our view) in measurements of D/H.
(1) The turbulent component should be consistent with all lines in the absorption system. Mesoturbulent profiles will significantly differ from Voigt profiles only when the turbulent component is comparable or larger than the thermal component. Both components contribute to the total velocity dispersion () which is measured in high resolution spectra: Comparisons of the metal line widths (e.g. C, Si) to the hydrogen and deuterium line widths place strict limits on the turbulent component. The heavy metal lines (Si and above) are dominated by turbulence at temperatures K and their velocity dispersion usually gives a good measure of the turbulence in the system. In the two systems we have measured D/H, towards Q1937-1009 and Q1009+2956, the metal lines are very narrow, which give very low velocity dispersions, km s-1 . The hydrogen lines are much wider, with typical widths km s-1 , which shows that thermal, uncorrelated, line formation is dominant in the optically thick Lyman lines.
(2) The line profiles of mesoturbulence can be distinguished from Voigt profiles by fitting the entire Lyman series (Levshakov & Kegel 1996). The requirement for invoking mesoturbulence should be determined by the observational data. If the Lyman series lines show evidence for mesoturbulent profiles, then one should take it into account. In D/H systems to date, simple Voigt profiles can explain all of the profiles in the Lyman series and do not require the mesoturbulent model.
(3) Mesoturbulence is likely to play an important role in a wide variety of absorption line studies. The hydrogen lines in QSO spectra which do show deuterium belong to a class of absorbers with the narrowest intrinsic widths, and are therefore subject to the least amount of turbulent broadening. On the other hand, optically thick absorption lines of heavy metals (for instance, in damped-Ly systems) are prime candidates for studies of mesoturbulence.
4.5 Line blending
The D/H absorption systems do not have simple, symmetric profiles which can be modeled as a single component. Analysis of the absorption profiles of the Lyman lines and associated metal lines requires multiple components. The components are usually separated by less than the intrinsic line widths of the individual components, which gives rise to blended profiles of the Lyman series. The severe blending represents a loss of information. The parameters describing individual components are poorly constrained, but those describing the entire system can be characterized and measured. Here lies the problem: the set of parameters describing the multiple components of the D/H system are not orthogonal when the components are blended. The uncertainties in the parameters are strongly correlated, and the variance in the parameters does not represent the total uncertainty. Therefore, one cannot measure the individual column densities of D and H accurately in each absorption component.
Acknowledgements
We are extremely grateful to the W. M. Keck foundation which made this work possible. We would like to thank our hosts at ISSI in Bern, J. Geiss and R. von Steiger, for their hospitality, and the editors of these proceedings, N. Prantzos, M. Tosi, and R. von Steiger for their help.
References
- Burles & Tytler 1997a Burles, S., & Tytler, D. 1997, AJ, 114, 1330
- Burles & Tytler 1997b Burles, S., & Tytler, D. 1997, ApJ, in press, astro-ph/9712108
- Burles & Tytler 1997c Burles, S., & Tytler, D. 1997, submitted to ApJ, astro-ph/9712109
- Cardall & Fuller 1996 Cardall, C. Y. & Fuller, G. M. 1996, ApJ, 472, 435
- Carswell et al. 1994 Carswell, R. F., Rauch, M., Weymann, R. J., Cooke, A. J. & Webb, J. K. 1994, MNRAS, 268, L1
- Carswell et al. 1996 Carswell, R. F., Webb, J. K., Lanzetta, K. M., Baldwin, J. A., Cooke, A. J., Williger, G. M., Rauch, M., Irwin, M. J., Robertson, J. G., & Shaver, P. A. 1996, MNRAS, 278, 506
- Copi et al. 1995 Copi, C.J., Schramm, D.N. & Turner, M.S. 1995, Science, 267, 192
- Fuller & Cardall 1996 Fuller, G. M., & Cardall, C. Y. 1996, Nucl. Phys. B, 51, 71
- Hata et al. 1997 Hata, N., Steigman, G., Bludman, S., & Langacker, P. 1997, Phys. Rev. D, 55, 540
- Hogan 1998 Hogan, C. J. 1998, this volume
- Jedamzik & Fuller 1997 Jedamzik, K. & Fuller, G. M. 1997, ApJ, 483, 560
- Kirkman & Tytler 1997 Kirkman, D. & Tytler, D. 1997, ApJ, 484, 848
- Levshakov & Kegel 1996 Levshakov, S. A., & Kegel, W. H. 1996, MNRAS, 278, 497
- Levshakov & Takahara 1996 Levshakov, S. A., & Takahara, F. 1996, MNRAS, 279, 651
- Levshakov & Kegel 1997 Levshakov, S. A., & Kegel, W. H. 1997, MNRAS, 288, 787
- Levshakov et al. 1997 Levshakov, S. A., Kegel, W. H., Takahara, F. 1997, submitted to MNRAS
- Levshakov et al. 1998 Levshakov, S. A., Kegel, W. H., Takahara, F. 1998, this volume
- Oke et al. 1995 Oke, J. B., Cohen, J. G., Carr, M., Cromer, J., Dingizian, A., Harris, F. H., Labrecque, S., Lucinio, R., Schaal, W., Epps, H., Miller, J. 1995, PASP, 107, 375
- Rugers & Hogan 1996a Rugers, M., & Hogan, C. 1996, ApJ, 459, L1
- Rugers & Hogan 1996b Rugers, M., & Hogan, C. 1996, AJ, 111, 2135
- Sarkar 1996 Sarkar, S. 1996, Rep. Prog. Phys., 59, 1493
- Schramm & Turner 1997 Schramm, D. N. & Turner, M. S. 1997, submitted to Rev. Mod. Phys.
- Smith et al. 1993 Smith , M. S., Kawano, L. H. & Malaney, R. A. 1993, ApJS, 85, 219
- Songaila et al. 1994 Songaila. A., Cowie, L. L., Hogan C. J. & Rugers, M. 1994, Nature, 368, 599
- Songaila et al. 1997 Songaila, A., Wampler, E. J., & Cowie, L. L. 1997, Nature, 385, 137
- Steigman 1994 Steigman, G. 1994, MNRAS, 269, L53
- Tytler et al. 1996 Tytler, D., Fan, X-M., & Burles, S. 1996, 381, 207
- Tytler & Burles 1997 Tytler, D., & Burles, S. 1997, in ”Origin of Matter and Evolution of Galaxies”, eds. T. Kajino, Y. Yoshii & S. Kubono (World Scientific Publ. Co.: Singapore), 37
- Vogt et al. 1994 Vogt, S. et al. 1994, Proc. SPIE, 2198, 362
- Walker et al. 1991 Walker, T. P., Steigman, G., Schramm, D. N., Olive, K. A. & Kang, H. S. 1991 ApJ, 376, 51
- Wampler 1996 Wampler, E. J. 1996, Nature, 383, 308
- Wampler et al. 1996 Wampler, E.J., Williger, G.M., Baldwin, J.A., Carswell, R.F., Hazard, C. & Mcmahon, R.G. 1996, A&A, 316, 33
- Webb et al. 1997 Webb, J. K., Carswell, R. F., Lanzetta, K. M., Ferlet, R., Lemoine, M., Vidal-Madjar, A., & Bowen, D. V. 1997, Nature, 388, 250