X-Ray Emission from the Radio Pulsar PSR J11056107
Abstract
We have detected significant X-ray emission from the direction of the young radio pulsar PSR J11056107 using the ASCA Observatory. The detection includes background-subtracted source counts derived using data from all four ASCA detectors. The emission shows no evidence of pulsations; the pulsed fraction is less than 31%, at the 90% confidence level. The X-ray emission can be characterized by a power-law spectrum with photon index , for a neutral hydrogen column density N cm-2. The unabsorbed keV flux assuming the power-law model is ( ergs cm-2 s-1. The implied efficiency for conversion of spin-down luminosity to ASCA-band emission is (, assuming a distance of 7 kpc to the source. Within the limited statistics, the source is consistent with being unresolved. We argue that the X-rays are best explained as originating from a pulsar-powered synchrotron nebula.
keywords:
stars: neutron — pulsars: individual: (PSR J11056107) — supernova remnants — X-rays: starsTo appear in the Astrophysical Journal Letters
gotthelf@gsfc.nasa.gov
vicky@space.mit.edu
1 Introduction
X-ray observations of radio pulsars provide a powerful probe of the energetics and emission mechanisms of rotation-powered neutron stars. Though pulsars have traditionally been most easily studied at radio wavelengths, that emission represents a small fraction of the neutron star energy budget, which is fed by rotational energy loss due to magnetic dipole braking. It is thought that the bulk of this “spin-down luminosity” emerges in the form of a relativistic wind. The interaction of the wind with the surrounding medium can lead to observable synchrotron emission in the X-ray band, as in the Crab Nebula. Thermal X-rays are also detected from the neutron star surface in some cases, as are pulsed, non-thermal X-rays from the magnetosphere. Recently the number of X-ray identified rotation-powered pulsars has grown sufficiently large that studying the properties of the population as a whole is possible (see Becker & Trümper 1997 for a recent review). Particularly important targets for X-ray observations are the youngest members of the pulsar population, because of their large spin-down luminosities.
The recently discovered young radio pulsar PSR J11056107 has a spin period 63 ms, a characteristic spin-down age kyr, and a spin-down luminosity 1036 erg s-1 (Kaspi et al. 1997). The pulsar’s dispersion measure implies that it is 7 kpc from the Earth (Taylor & Cordes 1993). PSR J11056107 is positionally coincident with the high-energy -ray CGRO/EGRET source 2EG J11036106. If the two are associated, the observed -ray flux implies an efficiency for conversion of spin-down luminosity to -rays of 3% for a beaming angle of 1 sr. The pulsar is located 25′ from the center of the supernova remnant MSH 1161A, which suggests that the two may be associated. At 7 kpc, if the characteristic age is the true age (but see Kaspi et al. 1997 for a discussion) and if the apparent geometric center of the remnant is the approximate pulsar birth location, the pulsar’s implied transverse velocity is 650 km s-1. This velocity is high, but within the range of typical young pulsar velocities (Lyne & Lorimer 1994). Nevertheless, the large uncertainties in the age and distance estimates toward both sources and absence of independent evidence for a large velocity make an association tentative at best (c.f. Kaspi 1996).
We report here on ASCA observations of the PSR J11056107 field, which reveal a faint X-ray source in the direction of the pulsar.
2 Observations
A two-day-long observation of PSR J11056107 was performed by the ASCA Observatory (Tanaka et al. 1994) on 1996 June 21–23. Data were acquired with all four imaging spectrometers, each in the focal plane of its own foil mirror: two Solid State Imaging Spectrometers (SIS-0, SIS-1), and two Gas Imaging Spectrometers (GIS-2, GIS-3). These spectrometers offer moderate energy () and imaging resolution in their keV energy band-passes. The GIS has a higher effective area above keV and a greater net observation time than the SIS.
To search for pulsations from PSR J11056107, GIS data were collected in the highest time resolution configuration (, , or depending on data acquisition rate). SIS data were acquired in 2 CCD mode, with 8 s integrations, using a combination of FAINT and BRIGHT modes (see the ASCA Data Analysis Guide for details). The target was placed off the corner of SIS-0 CCD-0, as close to the mean telescope optical axis as was practical, to minimize vignetting losses. The data were edited to exclude times of high background contamination using the standard “REV2” screening criteria. This rejects time intervals of South Atlantic Anomaly passages, Earth block, bright Earth limb in the field-of-view, and periods of high particle activity. The resulting effective observation time is ks (GIS) and ks (SIS) for the two pairs of sensors. The CLEANSIS algorithm (Gotthelf 1993) was used to identify and remove hot and flickering CCD pixels in the SIS data.
3 Image
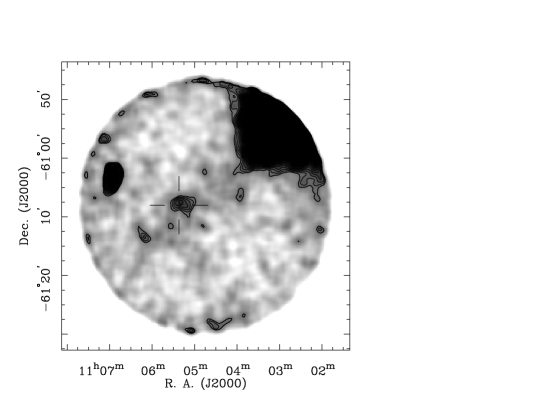
Flat-fielded images were generated by aligning and co-adding exposure-corrected images from the pairs of instruments. Exposure maps were generated with ASCAEXPO, ASCA software which uses the satellite aspect solution, instrument map (GIS), chip alignment, and hot pixel map (SIS) to determine the exposure time for each sky image pixel. The exposure correction was highly effective in removing GIS instrumental structure due to the window support grid. Figure 1a displays the resultant smoothed broad-band image for the GIS. The image reveals the supernova remnant towards the northern edge of the field-of-view, an unresolved, serendipitous point source close to the Eastern edge, and a faint source near the pulsar position.
We performed an unbiased source search on the GIS data using a modified box search algorithm set for a weak source threshold. For each test cell on the sky image we fit the putative source profile to a model for the PSF plus background; the exposure map is used to compute the statistical errors of the fit. We detected both the faint source and the serendipitous object. The only other sources detected by this search were the significant flux deviations associated with parts of the remnant in the north. Here we discuss the putative target detection and leave the analysis of the serendipitous source, AXS 11066103, to a future paper.
The measured X-ray position of the faint source is from the radio position of PSR J11056107 (see Table 1). This is consistent with the ASCA error circle (Gotthelf 1996), which introduces a systematic offset to the image in a random sky direction. This offset dominates over the source position measurement error of . We estimate that the probability of detecting a source with comparable flux by chance in the GIS active area, which has a radius of , to be . For this estimate we have assumed there is such source per deg2 and that the spatial resolution is . We therefore consider this a detection of PSR J11056107 and proceed to estimate the detection significance and source flux.
To estimate the significance of the detection, we ignore the complexities of the ASCA point-spread function and compare the number of counts collected from an optimal 4′ diameter aperture centered on the source with that from a concentric annulus. The relatively small number of counts available in the source region makes the approximation reasonable. The total number of counts in the GIS source aperture is 840, of which 616 are expected from the background, implying a pulsar detection. We have normalized the counts in the background annulus (13,400 cts) to the source aperture by the relative exposure area (). The source is also detected in the individual GIS sensors, but at the expected lower significance (see Table 2). Our estimates of the detection significance (the signal-to-noise ratio, ) take into account both the source and background variance:
| (1) |
where is the number of background subtracted source counts, derived from , the total number of counts in the aperture, and , the number of background counts, normalized to the source aperture by the relative exposure area . Here, gives the total exposure time by summing the exposure map () pixels covering the source or background aperture. Notice that if all pixels contain the same exposure time, then is equivalent to the usual area ratio of the source to background aperture.
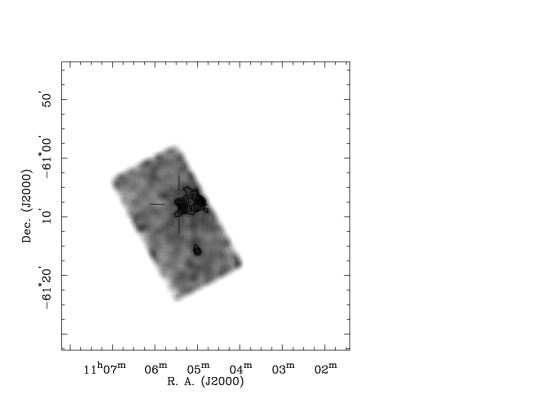
We next examined the flat-fielded SIS image, similarly co-added and smoothed on arcminute scales as with the GIS. There is also evidence of enhanced emission around the location of the pulsar, within the expected error circle (see Fig. 1b). The detected number of counts at the putative pulsar position is too small to fully resolve the familiar cross pattern of the PSF, as the morphology is dominated by Poisson fluctuations (see Hwang & Gotthelf 1997 §2.2 for a discussion of the significance of peaks in similarly processed images). It is reassuring that the brightest pixel in the SIS image is coincident with the GIS location of PSR J11056107. Using the same method outlined for the GIS we derive a SIS detection from 235 background subtracted source counts.
Thus, including data from all four telescopes aboard ASCA, we find a total of 459 background-subtracted source counts from the direction of PSR J11056107, with a significance of detection of 10.8.
We note that there is ambiguous evidence for extended emission between the pulsar and remnant. Also, there is perhaps another faint point source within a few arcminutes of the pulsar. This additional flux is evidently very soft as it is not seen in the GIS image and is confined to the soft-band SIS image ( keV). However, it is not evident in archive ROSAT PSPC data of the region. Another faint point source, below the GIS broad-band source detection threshold, is apparent in the soft-band SIS image just south of the pulsar and does correspond to faint PSPC emission.
3.1 Spectrum
Although the number of source counts from the pulsar is too small to distinguish among spectral models, we assume a simple absorbed power-law model to characterize the spectrum and extract a flux measurement. We concentrate our spectral analysis on the GIS, rather than SIS, as the former has greater sensitivity to photons above keV and has a greater field-of-view for background estimation. Source counts from GIS-2 and GIS-3 were extracted using a diameter circular region and the fits were restricted to the keV energy range. Background counts were obtained from a region west of the source region. This is far enough to provide a background dominated by local emission but still within the region of enhanced emission, most likely similar to the source background.
We estimate the equivalent neutral hydrogen column density toward the X-ray source using the measured value toward MSH 1161A, N cm-2 (Rho 1995). This is consistent with the value estimated using the standard “rule-of-thumb” of 10 neutral hydrogen atoms per free electron (Seward & Wang 1988), cm-2, given the pulsar dispersion measure, pc cm-3 (Kaspi et al. 1997). Radio observations of the field show that there is no large line-of-sight HII region that could contribute significantly to the dispersion measure (B. Stappers, B. Gaensler, personal communication). A fit to the background-subtracted spectrum with a power-law model using the above column density yields a photon index of . The implied unabsorbed keV flux is ( ergs cm-2 s-1. The predicted SIS count rates for the above model are consistent with the SIS detection.
As discussed below, the pulsar’s X-ray luminosity is important for interpreting the origin of the X-ray emission. Therefore, we test the robustness of our flux measurement in face of the uncertain column density. Allowing both the power-law index and column density to vary, we find best fit parameters of and N cm-2. The implied keV flux of ergs cm-2 s-1 is statistically unchanged from the previous fit. We also held NH fixed at half and twice the nominal value of cm-2. With half the hydrogen column, neither the implied flux ( ergs cm-2 s-1) nor the power law index () differs significantly. With twice the column density, the best-fit power law index is , implying a flux of ergs cm-2 s-1, again not significantly different. We conclude that our flux measurement is insensitive above keV to the assumed NH, within the reasonable range explored.
3.2 Timing
We carried out a timing analysis using the events recorded by the two GIS instruments. We selected events from a 4′ diameter aperture centered on the source, using data acquired at the high and medium data rates only. This produced total of events. We then folded the events using an ephemeris obtained from radio timing observations of PSR J11056107 at the Parkes radio telescope. The ephemeris, valid from 1996 May 10 through 1996 July 4, consists of the following parameters: s-1, s-2, s-3, referred to epoch MJD 50240.0, where is the rotation frequency. No pulsation was apparent in the folded light curve. To set an upper limit to the pulsed fraction, we injected an artificial pulsed signal of variable pulsed fraction and duty cycle 0.5, until it was detected at the 90% confidence level using a standard test. Our upper limit to the pulsed fraction determined in this way is 0.31.
4 Discussion
Because PSR J11056107 has a characteristic age kyr, thermal emission from the surface should have effective temperature no higher than 100 eV (see Ögelman 1995 and references therein). The corresponding blackbody flux, assuming the 7 kpc distance and a neutron star radius of 10 km, is 2.3 erg cm-2 s-1. For this spectrum and flux, the ASCA GIS count rate should be no more than 4 cps for reasonable values of . This count rate is some two orders of magnitude below the observed rate (see Table 2). Thus, thermal emission cannot be the origin of the X-rays we detect from PSR J11056107.
The most energetic pulsars in the known population exhibit hard-spectrum pulsations due to emission from the magnetosphere. Such pulsations are characterized by large pulsed fractions (Becker & Trümper 1997 and references therein), much larger than the upper limits we set using our ASCA/GIS data for PSR J11056107. This is not surprising given the characteristic age of PSR J11056107, which suggests it will exhibit properties like those of Vela-type pulsars, which do not show strong X-ray pulsations (e.g. Ögelman, Finley & Zimmerman 1993). Deeper observations could reveal pulsations due to a small magnetospheric component, but the bulk of the observed flux, being unpulsed, must have a separate origin.
The observed X-ray emission could originate from an optically thin hot gas bubble emitting thermal bremsstrahlung radiation, possibly a faint, previously unknown supernova remnant. If kyr is the system’s true age, the hypothetical remnant would probably be in the radiative phase. Then, the remnant radius, where is the supernova initial energy in units of erg, is the initial surrounding interstellar medium number density, and is the age of the remnant in units of yr (see Lozinskaya 1992 and references therein). For and taking pc, corresponding to the maximum size of the remnant given the ASCA/GIS spatial resolution and assuming a distance of 7 kpc, . Thus either this supernova released far less energy than is typical, or it expanded into a region of density 300 cm-3. Neither seems likely. Furthermore, there is no evidence for radio emission from a putative remnant (B. Stappers, B. Gaensler, personal communication). It is possible that the observed X-ray emission comes from only a small part of a larger region, whose surface brightness is too faint to be observed. Only a spectrum and deeper observations can decide unambiguously.
The likeliest origin for the X-rays detected from PSR J11056107 is a synchrotron nebula powered by the pulsar via a relativistic wind. The most famous pulsar wind nebula surrounds the Crab pulsar (Rees & Gunn 1974; Kennel & Coroniti 1984; Emmering & Chevalier 1987; Gallant & Arons 1994). There the pulsar wind pressure is presumably confined by the unseen expanding shell. In pulsar wind nebulae, the wind relativistic electrons and positrons (and possibly heavy ions, Hoshino et al. 1992) are confined, accelerated at the reverse shock, and radiate synchrotron emission. For PSR J11056107, given the absence of evidence for a confining shell, the pulsar wind is probably confined by ram pressure (Cheng 1983; Kulkarni et al. 1992; Fruchter et al. 1992; Wang, Li, & Begelman 1993; Finley, Srinivasan, & Park 1996; Romani, Cordes & Yadigaroglu 1997).
Here we show that a ram-pressure confined synchrotron nebula is consistent with the ASCA detection of PSR J11056107. Equating the interstellar medium ram pressure with that of the pulsar wind, assuming a thin shock for simplicity, the distance of the shock apex from the pulsar is given by
| (2) |
where is the fraction of channeled into the wind, is the ambient density, and is the pulsar velocity. It is reasonable to assume given the low efficiency for conversion to high-energy -rays (Kaspi et al. 1997). Let H atom cm-3 and km s-1). Then cm. The magnetic field just upstream of the shock, , is given by
| (3) |
where is the ratio of the magnetic energy flux to the kinetic energy flux of the pulsar wind upstream of the shock. Observations of the Crab pulsar show that (Kennel & Coroniti 1984). Just downstream of the shock, from shock jump conditions (e.g. Arons & Tavani 1993). We find G, where . The pulsar wind flow time scale is s. The time scale for synchrotron cooling is given by s, where is the post-shock pair Lorentz factor (e.g. Rybicki & Lightman 1979). The synchrotron cooling efficiency for pairs having is therefore , where . The bolometric luminosity in synchrotron emission , which is dominated by the highest energy pairs, is given for pairs by , where is the fraction of pairs having . This predicted bolometric luminosity is 4–5 times smaller than the observed ASCA-band luminosity alone. Relaxing the assumption that exacerbates the problem. However, the observations can be accounted for in a number of ways: (i) if all of the post-shock wind pairs have Lorentz factors or is significantly larger than 0.005, implying different wind properties from those inferred from the Crab pulsar (e.g. Hoshino et al. 1992; Gallant & Arons 1994); (ii) the thin shock assumption does not apply and we have underestimated ; (iii) the pulsar resides in an overdense region having cm-3; (iv) the actual space velocity is larger than assumed above, i.e. . Case (iv) would be consistent with estimates of the pulsar velocity distribution (e.g. Lyne & Lorimer 1994), and with the velocity implied on the basis of a possible association with the supernova remnant MSH 1161A (Kaspi et al. 1997). Estimates of the SNR shock velocity (P. Slane, personal communication) suggest an even higher pulsar space velocity (c.f. Frail et al. 1996). Extrapolating the ASCA-band flux to the ROSAT band assuming a power-law index of , we find a soft X-ray luminosity of PSR J11056107 larger by nearly an order of magnitude compared with those of other pulsars of comparable age and . If similar pulsars have similar wind properties, this suggests differing environments and/or space velocities. Caution is of course required given the systematic uncertainties due to the distance model and poorly determined X-ray spectra.
Improved spectral measurements and high spatial resolution X-ray imaging of the source may distinguish among the above possibilities. For the faint thermal remnant model or cases (i) and (ii) above, the emission should be spatially resolvable by AXAF. For a high velocity pulsar, the shock apex distance would not be resolvable, but the swept back extended bow shock “tail” morphology might be apparent.
Acknowledgements.
We thank M. Bailes, R. Manchester and R. Pace for acquiring radio timing data for PSR J11056107, and B. Gaensler, P. Slane, and B. Stappers for discussing data prior to publication. We thank J. Arons, M. van Putten, G. Vasisht, and Q. D. Wang for useful discussions. This work was supported by NASA grant NAG-51436. V.M.K. received additional support from Hubble Fellowship grant number HF-1061.01-94A from the STScI, which is operated by the AURA, under NASA contract NAS5-26555. E.V.G. is supported by USRA under NASA contract NAS5-32490.References
- [1] Arons, J., & Tavani, M. 1993, ApJ, 403, 249
- [2] Cheng, A. F. 1983, ApJ, 275, 790
- [3] Becker, W., & Trümper, J. 1997, AA, 326, 682
- [4] Emmering, R. T., & Chevalier, R. A. 1987, ApJ, 321, 334
- [5] Finley, J. P., Srinivasan, R., & Park, S. 1996, ApJ, 466, 938
- [6] Frail, D. A., Giacani, E. G., Goss, W. M., & Dubner, G. 1996, ApJ, 464, L165
- [7] Fruchter, A. S., Bookbinder, J., Garcia, M. R., & Bailyn, C. D. 1992, Nature, 359, 303
- [8] Gallant, Y. A., & Arons, J. 1994, ApJ, 435, 230
- [9] Gotthelf, E. V. 1993, CLEANSIS, in FTOOLS software package, HEASARC (Greenbelt: NASA/GSFC)
- [10] Gotthelf, E. V. 1996, in ASCANEWS, #4, 31, HEASARC (Greenbelt: NASA/GSFC)
- [11] Hoshino, M., Arons, J., Gallant, Y. A., & Langdon, A. B. 1992, ApJ, 390, 454
- [12] Hwang, U., & Gotthelf, E. V. 1997, ApJ, 475, 665.
- [13] Kaspi, V. M. 1996, in Pulsars: Problems and Progress, IAU Coll. 160, ASP, 105, 375
- [14] Kaspi, V. M., Bailes, M., Manchester, R. N., Stappers, B. W., Sandhu, J. S., Navarro, J., & D’Amico, N. 1997, ApJ, 485, 820
- [15] Kennel, C. F., & Coroniti, F. V. 1984, ApJ, 283, 694
- [16] Kulkarni, S. R., Phinney, E. S., Evans, C. R., & Hasinger, G. 1992, Nature, 359, 300
- [17] Lozinskaya, T. A. 1992, Supernovae and Stellar Wind in the Interstellar Medium, American Institute of Physics, 207
- [18] Lyne, A. G., & Lorimer, D. R. 1994, Nature, 369, 127
- [19] Ögelman, H., Finley, J. P., & Zimmerman, H. U. 1993, Nature, 361, 1360
- [20] Ögelman, H. 1995, in The Lives of the Neutron Stars, M. A. Alpar et al.(eds.), Kluwer Academic Publishers, 101
- [21] Rees, M. J., & Gunn, J. E. 1974, MNRAS, 167, 1
- [22] Rho, J. 1995, PhD thesis, University of Maryland
- [23] Romani, R. W., Cordes, J. M., & Yadigaroglu, I. A. 1997, ApJ, 484, L137
- [24] Rybicki, G. B., & Lightman, A. P. 1979, Radiative Processes in Astrophysics, John Wiley, & Sons, 192
- [25] Seward, F. D., & Wang, Z. U. 1988, ApJ, 332, 199
- [26] Tanaka, Y., Inoue, H., & Holt, S. S. 1994, PASJ, 46, L3
- [27] Taylor, J. H., & Cordes, J. M. 1993, ApJ, 411, 674
- [28] Wang, Q. D., Li, Z.Y., & Begelman, M. C., 1993, Nature, 364, 127
- [29]
| Source | Right Ascension | Declination |
|---|---|---|
| PSR J11056107 (radio)aaThe radio position is uncertainty by 0.7′′. | ||
| PSR J11056107 (ASCA) |
c c c c c c
\tablewidth0pt
\tablecaptionASCA detection of PSR J11056107
\tablehead
\colheadSensor & \colheadExposure \colheadCount Rate\tablenotemarka Bgd Rate\tablenotemarkb \colheadSignificance\tablenotemarkc
\colhead(ksec) \colhead( cps) \colhead( cps) \colhead()
\startdataSIS-0 & 38.9 12.9 9.5 5.8 \nlSIS-1 37.8 10.5 7.9 4.9 \nlGIS-2 55.9 6.6 5.2 4.1 \nlGIS-3 55.8 8.3 5.8 6.5 \nlTotal 188.4 – – 10.8 \nl\enddata\tablenotetextaTotal source plus background count rate in a diameter aperture centered on the ASCA PSR J11056107 position.
\tablenotetextbBackground count rate in a annulus concentric with the source position and normalized to the source aperture (see text). The background annulus for the SIS is truncated by the CCD boundary.
\tablenotetextcSee text for definition.