03(03.04.1; 07.09.1; 07.19.1: 09.13.1; 20.01.2)
A.P. Fairall
Extragalactic Large-Scale Structures behind the Southern Milky Way. – II. Redshifts Obtained at the SAAO in the Crux region
Abstract
In our systematic optical galaxy search behind the southern Milky Way, 3760 (mostly unknown) galaxies with diameters D were identified in the Crux region (, Woudt & Kraan-Korteweg 1997). Prior to this investigation, only 65 of these galaxies had known redshifts. In order to map the galaxy distribution in redshift space we obtained spectra for 226 bright (B) objects with the 1.9m telescope of the South African Astronomical Observatory (SAAO).
Redshifts could be determined for 209 objects, of which 173 have good signal-to-noise ratios. Of the 36 tentative redshifts, four are confirmed through independent values in the literature. The redshifts of three objects indicate them to be galactic of origin. One of these confirms a suspected Planetary Nebula. For 17 of the galaxies, no redshift could be determined due to poor signal-to-noise ratios.
In addition, 26 redshifts have have been measured in the Hydra-Antlia region investigated earlier (Kraan-Korteweg, Fairall & Balkowski 1995), of which one is a tentative estimate.
Two main structures crossing the Galactic Plane in the Crux region have now become clear. A narrow, nearby filament from () = () to the Centaurus cluster can be traced. This filament runs almost parallel to the extension of the Hydra–Antlia clusters found earlier and is part of what we have earlier termed the “Centaurus Wall” extending in redshift-space between km s-1 (Fairall & Paverd 1995). The main outcome of this survey however, is the recognition of another massive extended structure between km s-1 . This broad structure, dubbed the Norma Supercluster (Woudt et al. 1997), runs nearly parallel to the Galactic Plane from Vela to ACO 3627 (its centre) from where it continues to the Pavo cluster. This massive structure is believed to be associated with the Great Attractor.
The survey has furthermore revealed a set of cellular structures, similar to those seen in redshift space at higher galactic latitudes, but never before seen so clearly behind the Milky Way.
keywords:
redshifts of galaxies – clustering of galaxies – zone of avoidance – large-scale structure of the Universe1 Introduction
This paper is the second in a series reporting redshifts for galaxies found at very low galactic latitudes, obtained for the purpose of mapping large-scale structures previously hidden by the southern Milky Way. The first paper (Kraan-Korteweg, Fairall & Balkowski 1995 - hereafter Paper I) dealt with the Hydra–Antlia region; it also gave full details of the nature of the survey. The present paper covers the “Crux” region immediately neighbouring Hydra–Antlia; it does not repeat information given in Paper I, to which the reader is referred for an extensive description of the motivation, survey and observing procedures.
As before, galaxies in the general galactic latitude range have been found by scanning film copies of the SRC IIIaJ survey under 50 times magnification, the details of which will be presented as a catalogue (Woudt & Kraan-Korteweg 1997, hereafter WKK97). For the present work, some 500 square degrees of sky has been searched. It involves 21 fields limited at , namely F62-67, F94-98, F130-134 and F171-175.
Figure 1 shows the distribution of the 3760 galaxies found in the Crux region. Only % (= 87) of these galaxies had been catalogued before by Lauberts (1982). The entire area surveyed so far by us is indicated in Figure 1. The dashed line on the right demarcates the Hydra–Antlia region, the middle section (solid line) is the Crux region whereas the dashed line on the left shows the Great Attractor region.
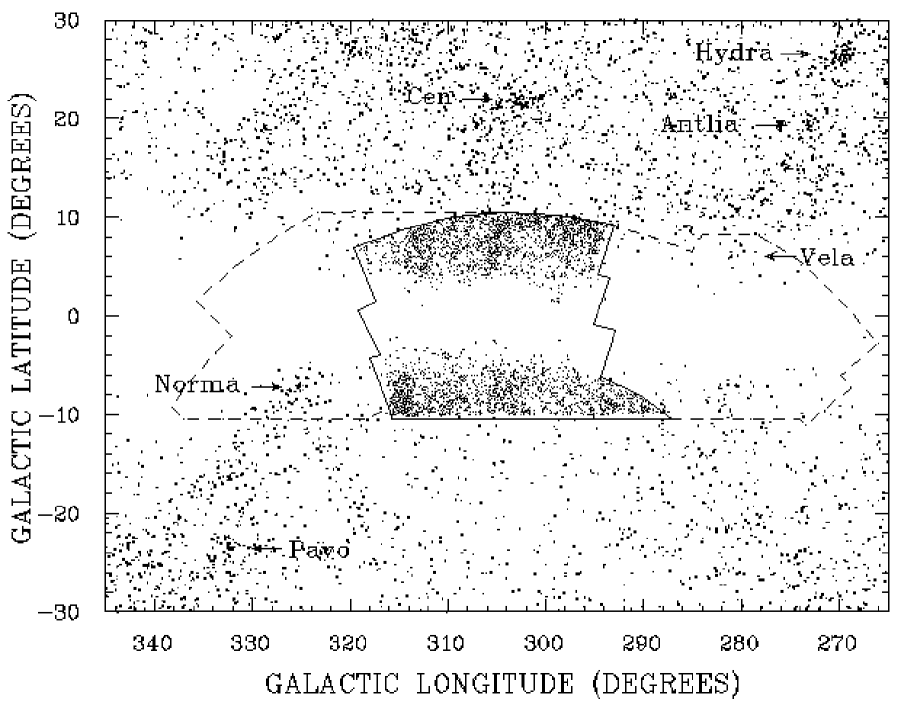
The newly found galaxies in the Crux region significantly reduce the width of the “Zone of Avoidance” (ZOA) created by the Milky Way. Nevertheless there is a generally sharp cutoff along the northern boundary at and a more gradual but irregular extinction between and on the southern edge. The forthcoming blind HI-survey with the multi-beam system at Parkes should unveil the remaining parts of the extragalactic sky between these boundaries.
The distribution of optically detected galaxies inside the Crux region is far from smooth. North of the Milky Way, there are three apparent concentrations at galactic longitudes and . The latter two suggest a continuation of the Centaurus Wall into the ZOA. South of the Milky Way, there is a concentration (at ) which is most likely a distant overdensity as the survey reveals a corresponding excess of smaller fainter galaxies.
The Crux region does include part of the “Great Attractor” (GA) (Lynden-Bell et al. 1987). However, the main component of the GA lies within the boundaries of our neighbouring search area () including the centre of the GA which Kolatt et al. (1995) predict at , . That region will be covered in a third paper in this series; it is dominated by ACO 3627 – hereafter named the Norma cluster – already recognised as a nearby massive cluster (Kraan-Korteweg et al. 1996 - hereafter KK96) while work on this survey was in progress.
2 Observations
As before, spectroscopic observations of the more widespread brighter (B) galaxies, identified in our survey, have been carried out with the 1.9 m Radcliffe reflector and UNIT Spectrograph at the South African Astronomical Observatory during four weeks in 1993 – 1995, and are reported in Section 2 below. We have also continued to complement these observations by programmes using the MEFOS (multi-fibre) spectrograph system (Felenbok et al. 1997) on the 3.6m telescope at the European Southern Observatory (for fainter distant galaxies), and using the Parkes radio telescope (to cope with nearby galaxies of low optical brightness). The outcome of these complementary programmes will be presented separately.
The observations at SAAO were carried out over 3500 – 7000Å with a resolution of 3Å per pixel. Integration times typically range from 500 to 2500 seconds. The procedures used for observations, and the reductions carried out thereafter at the University of Cape Town, are the same as described in Paper I.
![[Uncaptioned image]](/html/astro-ph/9705152/assets/x2.png)
![[Uncaptioned image]](/html/astro-ph/9705152/assets/x3.png)
![[Uncaptioned image]](/html/astro-ph/9705152/assets/x4.png)
![[Uncaptioned image]](/html/astro-ph/9705152/assets/x5.png)
The entries in Table 1 are as follows:
- Column 1 and 2:
-
Identification of the galaxy as given in WKK97 and Lauberts identification (Lauberts, 1982).
- Column 3 and 4:
-
Right Ascension and Declination (1950.0). The positions were measured with the Optronics machine at the ESO in Garching and have an accuracy of about 1 arcsec.
- Column 5 and 6:
-
Galactic longitude and latitude .
- Column 7:
-
Large and small diameters (in arcsec). The diameters are measured approximately to the isophote of 24.5 mag arcsec-2 and have a scatter of .
- Column 8:
-
Apparent magnitude BJ. The magnitudes are estimates from the film copies of the SRC IIIaJ Survey based on the above given diameters and an estimate of the average surface brightness of the galaxy. The magnitudes and diameters in the Crux region are estimated by PAW but show no significant deviation from the magnitude and diameter estimates in the Hydra–Antlia region as determined by RCKK (Paper I and Table 2). A more detailed discussion on this subject will follow in WKK97.
- Column 9:
-
Morphological type. The morphological types are coded similarly to the precepts of the Second Reference Catalogue (de Vaucouleurs et al. 1976). Due to the varying foreground extinction a homogenous and detailed type classification could not always be accomplished and some codes were added: In the first column F for E/S0 was added to the normal designations of E, L, S and I. In the fourth column the subtypes E, M and L are introduced next to the general subtypes 0 to 9. They stand for early spiral (S0/a-Sab), middle spiral (Sb-Sd) and late spiral or irregular (Sdm-Im). The cruder subtypes are a direct indication of the fewer details visible in the obscured galaxy image. The questionmark at the end marks uncertainty of the main type, the colon uncertainty in the subtype.
- Column 10 and 11:
-
Heliocentric velocity (cz) and error as derived from the absorption features. The errors may appear large as they are estimated external errors, and not internal errors (see Paper I). The square brackets indicate a tentative redshift.
- Column 12 and 13:
-
Heliocentric velocity and error measured from the emission lines (identified in column 14) when present. The square brackets indicate a tentative redshift.
- Column 14:
-
Identified emission lines:
1 2 3 4 5 6 7 OII] H H [OIII] [OIII] H [NII] 3727 4340 4861 4959 5007 6563 6584 A colon indicates the identification is tentative.
![[Uncaptioned image]](/html/astro-ph/9705152/assets/x6.png)
![[Uncaptioned image]](/html/astro-ph/9705152/assets/x7.png)
- Column 15:
-
Code for additional remarks:
1 – WKK 150: The redshift measured at the SAAO for this galaxy is in disagreement with the value quoted in the literature ( km s-1 , Fisher et al. 1995). It might be due to an identification error; a neighbouring galaxy (WKK 158) was found to be in good agreement with the value quoted in the literature.
2 – The redshifts for these galaxies are tentative only, but confirmed by independent redshifts from the literature.
Sy2 – These four galaxies have been classified as Seyfert 2.
PN – WKK P8: This object was classified as a possible PN, but was not listed in PNe list of Acker 1992. It has now been confirmed as a PN.
Gal – Identification as galaxy questionable, spectra indicates a galactic origin.
– Redshifts are also available in the literature.
Table 2 represents an addendum to our Paper I, giving further redshift measurements for galaxies in the Hydra–Antlia region. The format is the same as for Table 1 and the entries in Table 2 are as in Table 1 with the exception of:
- Column 1:
-
Identification of the galaxy as given in Kraan-Korteweg (1997) for galaxies with the prefix KK, or from Salem & Kraan-Korteweg (1997) for galaxies with the prefix SKK.
- Column 8:
-
Apparent magnitude BJ as determined by RCKK. These values are derived similar to the ones quoted in Paper I.
- Column 15:
-
Code for additional remarks:
3 – KK1196: The redshift measured at the SAAO for this galaxy is in slight disagreement with the value quoted in the literature ( km s-1 , Huchtmeier & Richter 1989).
4 – L216- 5: The redshift measured at the SAAO for this galaxy is in slight disagreement with the value quoted in the literature ( km s-1 , Visvanathan & v.d. Bergh 1992).
# – These galaxies are not in our search area, but do lie in the “Zone of Avoidance”. The diameters and type are from Lauberts 1982.
Special cases:
In the course of this survey we have given special attention to a number of objects that, based on their optical appearance, might be Planetary Nebulae (PNe). In the Crux region there a four such objects and these observations are described elsewhere (Kraan-Korteweg et al. 1996b): Two of the four PNe candidates were too faint to be detected, one was confirmed as being a PN (PNG 299.5+02.5) and one object was classified as a new PN (PNG 298.3+06.7).
Table 3 lists galaxies for which the spectra has too poor a signal-to-noise ratio for a redshift to be extracted. For one galaxy (WKK 647) the spectrum was dominated by a superimposed foreground star and no reliable redshift could be extracted.
Table 4 lists the galaxies with their optical properties as determined in our Crux survey, for which redshifts have already been published in the literature. Although now reobserved by us, these galaxies clearly would have been included in our observations, since they meet our selection criteria. Columns 1-9 are the same as in Table 1. Column 10 and 11 list the heliocentric velocities and errors (if given). The velocity in column 10 has been adopted from the source identified in column 12, where the number corresponds to:
-
1.
Dressler 1991, The supergalactic plane redshift survey.
-
2.
Strauss et al. 1992, A redshift survey of IRAS galaxies.
-
3.
Visvanathan & v.d. Bergh 1992, Luminous spiral galaxies in the direction of the Great Attractor.
-
4.
Fairall 1983, Spectroscopic survey of southern compact and bright-nucleus galaxies.
-
5.
Fisher et al. 1995, The IRAS 1.2 Jy Survey.
-
6.
Fairall 1996, The Southern Redshift Catalogue.
2.1 Comparison to other measurements
Although the galaxies we observed were initially selected on the basis of having no published redshifts, more recent publications have provided redshifts from other investigators for 20 of the galaxies in Table 1 and Table 2. This overlap, however, allows a suitable comparison between our sample and others. We find
which shows no significant systematic error, and agrees well within our average standard deviation.
Similarly, we have allowed a small overlap between the SAAO galaxies and our complementary programmes using Mefos and Parkes radio observations, for which we find
The comparison with the MEFOS and Parkes data is based on 5 and 12 galaxies respectively. Again, the agreement is acceptable with our standard deviation; the latter in any case probably reflects low surface-brightness galaxies, for which our errors are at their largest values.
3 Coverage and Completeness
We have obtained reliable redshifts for 173 galaxies, with tentative redshifts for a further 36 objects, as set out in Table 1. The tentative redshifts are not used in any of the subsequent plots or analyses.
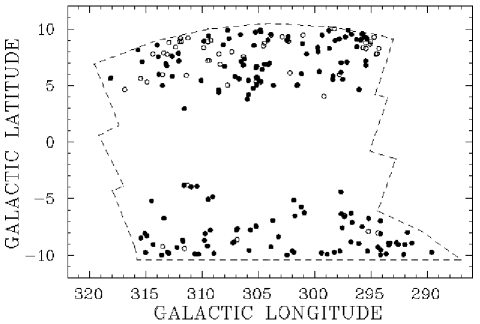
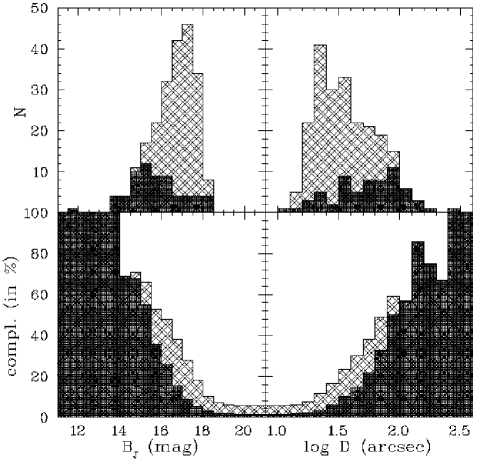
Figure 2 shows the sky coverage of the galaxies with reliable redshifts, depicted by solid circles. The coverage can be seen to be reasonably uniform, on both the north and south sides of the galactic obscuration. By contrast, the data from Table 4 – galaxies with previously known redshifts as depicted by the open circles – is strongly concentrated north of the plane. This is due to the redshift surveys in that area that focussed on the Great Attractor (esp. Dressler 1991, Visvanathan & van den Bergh 1992).
Figure 3 presents a comparison of the magnitudes and major-axis distribution of the observed galaxies; it shows general similarity to the corresponding plot in Paper I. The sharp magnitude cut-off indicates the limiting performance of the 1.9m telescope for galaxies fainter than (B).
These observations trace the bright end of the magnitude distribution of the 3760 galaxies in the Crux region very well. We are 70% complete for galaxies brighter than (B) and even 54% complete for galaxies brighter than (B). These numbers are comparable to the completeness figures in the Hydra–Antlia region. As before, a number of bright galaxies are missed by this survey. They are extended low surface brightness spiral galaxies. In the meantime, they have been observed with the Parkes 64–m telescope and will be reported on elsewhere.
4 Identification of Large-Scale Structures
4.1 Velocity distribution
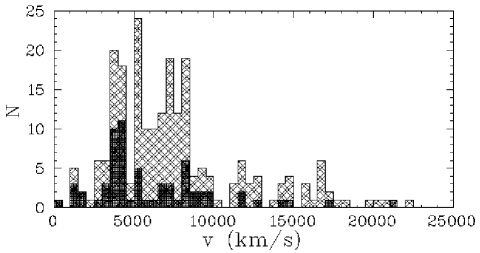
The histogram of redshifts shown in Figure 4 reveals a broad concentration of galaxies around km s-1 , with a probable dip at km s-1 . This is quite different to the single peak centred at km s-1 for the neighbouring Hydra–Antlia region to the west (Paper I), and the dominating peak at km s-1 of the Norma cluster (KK96) to the east. It suggests that quite different large-scale structures may be present in this Crux region, which we shall examine in greater detail below.
4.2 Sky projection
In regard to the interpretation of data in three-dimensional redshift space, particularly in the absence of magnitude controls, the reader is directed to the introductory discussion in Section 3.2 of Paper I. In interpreting these plots, note that the Hydra–Antlia ZOA region is covered observationally as deep as the current Crux region, whereas other low–latitude regions only have very sparse redshift information
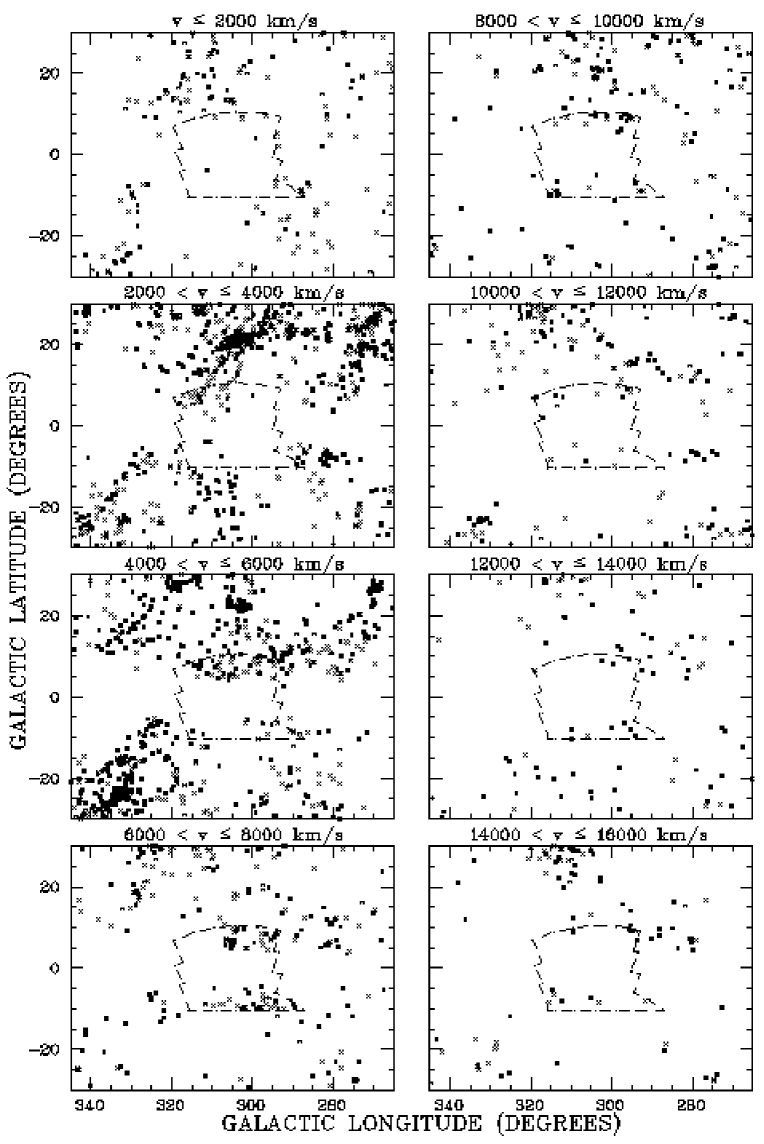
Figure 5 shows the surveyed region and its surrounding volume sliced in redshift intervals of km s-1 . As already indicated, most of the data points, within the outlined Crux region, are from the new observations. Conspicuous features occur in the second and third slices - matching the excess already noted in the histogram of Figure 4.
In the second slice, the new data reinforce the presence of a narrow filamentary structure running all the way from , to the Centaurus cluster at , . This is believed to be part of a Great Wall-like structure seen edge-on – the Centaurus Wall. The new observations fill in a portion of this feature previously hidden by the Milky Way - as might be expected of a continuous massive structure. The break, due to the obscuration close to the galactic plane is now much narrower. The new data in the top-left corner of the Crux region is concentrated in the km s-1 range - slightly closer than most other condensations within the wall. There are also indications of weaker filaments: One crosses north-south at while another passes just outside the south-east corner of the surveyed area.
However, the most important structure revealed by the present survey occurs in the third slice down. This is a concentration of galaxies centred at km s-1 in the upper (northern) segment of the surveyed volume. Together with the neighbouring galaxies outside the survey volume, it suggests a large-scale structure running more or less horizontally across the diagram. We have earlier labelled this structure as the “Norma supercluster” (Woudt et al. 1997). Traces can also be seen in the following slice, so the feature is also probably wall-like seen roughly side on - i.e. its width (or depth in Fig 5) being some km s-1 and its thickness several hundred km s-1 unless much is still hidden by the dense obscuration. We shall see however (in Fig 6) that this feature is more complex. For the moment note the concentration at in the fourth slice - coincident with that seen earlier in Figure 1. Bearing in mind its greater distance, compared to the Centaurus Wall mentioned above, this new structure must be similarly massive. The Norma cluster is situated where these two massive structures – the Centaurus Wall and the Norma supercluster – intersect.
Features at greater redshifts are understandably narrower in angular dimensions, and more difficult to discern: The fourth slice shows a feature running along the southern boundary of the Crux region. Beyond that, the data is generally too sparse, except for a weak concentration at km s-1 in the south-east (bottom left), that corresponds to the relatively distant overdensity noted earlier.
4.3 Pie diagrams
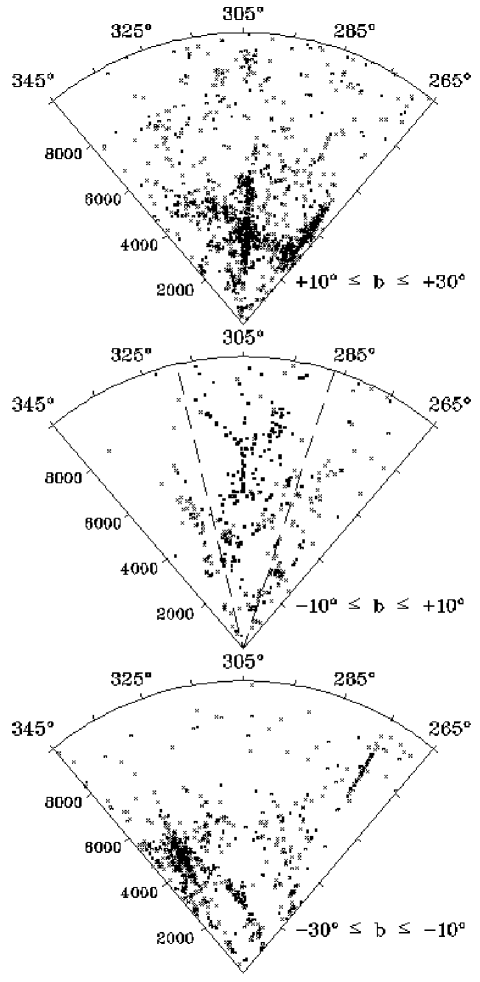
Our final set of plots, Figure 6, shows slices in galactic latitude; the uppermost including the Centaurus and Hydra clusters, the lowest the Pavo cluster.
The product of our survey appears as the middle slice, which would otherwise be largely blank. Instead, the slice reveals a cellular structure - familiar from plots elsewhere in the sky (eg Fairall et al. 1990) - but never before discerned so clearly at so low a galactic latitude. Presumably, the appearance is somewhat assisted by a favourable angle of cut. The cell sizes, and the voids so contained, are km s-1 in diameter.
Of particular interest is a radial feature (from 5300 to 7000 km s-1 ), almost dead centre, that corresponds to the concentration at galactic longitude . The feature could be the “finger of God” of a small cluster except it is not discernable as such in a central longitude slice (not reproduced here).
5 Summary.
The main finding of this survey has been an overdensity of galaxies in the km s-1 range in redshift. Rather than a single feature, this overdensity represents a set of distinct cellular structures similar to those seen at higher galactic latitudes and for which Figure 6 (middle plot) provides a mapping. The survey also provides more detailed mapping of the “Centaurus Wall” where it crosses the Milky Way.
Acknowledgements.
The authors would like to thank the night assistants Francois van Wyk and Fred Marang as well as the staff at the SAAO for their hospitality. APF and PAW are supported by the South African FRD. The research by RCKK is being supported with an EC-grant. Financial support was provided by CNRS through the Cosmology GDR program. This research has made use of the NASA/IPAC Extragalactic Database (NED), which is operated by the Jet Propulsion Laboratory, Caltech, under contract with the National Aeronautics and Space Administration.References
- [1] Dressler, A. 1991, ApJS 75, 241
- [2] Fairall, A.P. 1983, MNRAS 203, 47
- [3] Fairall, A.P., Palumbo, G.G.C., Vettolani, G., et al. 1990, MNRAS 247, 21P
- [4] Fairall, A.P., Paverd, W.R. 1995 in “Wide-Field Spectroscopy and the Distant Universe”, eds. S.J. Maddox and A. Aragon-Salamanca, World Scientific, Singapore, 121
- [5] Fairall, A.P. 1996, the Southern Redshift Catalogue, maintained at the University of Cape Town (available from fairall@uctvms.uct.ac.za)
- [6] Felenbok, P., Guérin, J., Fernandez, A., et al. 1997, Experimental Astronomy, in press
- [7] Fisher, K.B., Huchra, J.P., Strauss, M.A., et al. 1995, ApJS 100, 69
- [8] Huchtmeier, W.K., Richter O.-G. 1989, The General Catalogue of HI-Observations of Galaxies, New York: Springer-Verlag
- [9] Kolatt, T., Dekel, A., Lahav, O. 1995, MNRAS,
- [10] Kraan-Korteweg, R.C., Fairall, A.P., Balkowski, C., 1995 (Paper I), A&A 297, 617
- [11] Kraan-Korteweg, R.C., Woudt, P.A., Cayatte, V., et al. 1996 (KK96), Nature 379, 519
- [12] Kraan-Korteweg, R.C., Fairall, A.P., Woudt, P.A., et al. 1996, A&A 315, 549
- [13] Kraan-Korteweg, R.C. 1997 in preparation
- [14] Lauberts,A. 1982, The ESO/Uppsala Survey of the ESO (B) Atlas, ESO: Garching
- [15] Lynden-Bell, D., Faber, S.M., Burstein, D., et al. 1988, ApJ 326, 19
- [16] Salem, C., Kraan-Korteweg, R.C. 1997 in preparation
- [17] Strauss, M.A., Huchra, J.P., Davis, M., et al. 1992, ApJS 83, 29
- [18] Vaucouleurs, G. de, Vaucouleurs, A. de, Corwin, H.G. 1976, Second Reference Catalogue of Bright Galaxies (RC2), University of Texas Press, Austin
- [19] Visvanathan, N., van den Bergh, S. 1992, AJ 103, 1057
- [20] Woudt, P.A., Kraan-Korteweg, R.C. 1997 (WKK97), in preparation
- [21] Woudt, P.A., Fairall, A.P., Kraan-Korteweg, R.C., 1997, in “Dark and Visible Matter in Galaxies and Cosmological Implications”, eds. M. Persic and P. Salucci, A.S.P. Conf.Ser., in press.