High–Redshift Superclustering of QSO Absorption Line Systems
on 100 Mpc Scales
Abstract
We have analyzed the clustering of C iv absorption line systems in an extensive new catalog of heavy element QSO absorbers. The catalog permits exploration of clustering over a large range in both scale (from about 1 to over 300 Mpc) and redshift ( from 1.2 to 4.5). We find significant evidence (; ) that C iv absorbers are clustered on comoving scales of 100 Mpc () and less — similar to the size of voids and walls found in galaxy redshift surveys of the local universe () — with a mean correlation function over these scales. We find, on these scales, that the mean correlation function at low (), medium (), and high redshift () is , , and , respectively. Thus, the superclustering is present even at high redshift; furthermore, it does not appear that the superclustering scale, in comoving coordinates, has changed significantly since then. We find 7 QSOs with rich groups of absorbers (potential superclusters) that account for a significant portion of the clustering signal, with 2 at redshift . We find that the superclustering is just as evident if we take instead of 0.5; however, the inferred scale of clustering is then 240 Mpc, which is larger than the largest scales of clustering known at present. This discrepancy may be indicative of a larger value of , and hence . The evolution of the correlation function on 50 Mpc scales is consistent with that expected in cosmologies with density parameter ranging from 0.1 to 1. Finally, we find no evidence for clustering on scales greater than 100 Mpc () or 240 Mpc ().
keywords:
catalogs — cosmology: observations — large–scale structure of universe — quasars: absorption linesElectronic mail: jmq@oddjob.uchicago.edu , devb@oddjob.uchicago.edu ,
don@oddjob.uchicago.edu
1 Introduction
It has been recognized for some time now that QSO absorption line systems are particularly effective probes of large–scale structure in the universe (see, e.g., Shaver & Robertson (1983); Crotts, Melott, & York (1985)). This is because the absorbers trace matter lying on the QSO line of sight, which can extend over a sizable redshift interval out to high redshifts. Thus, the absorbers trace both the large–scale structure (on scales out to hundreds of Mpc) and its evolution in time, since the clustering pattern can be examined as a function of redshift out to . The evolution of large–scale structure is of great interest, since, in the gravitational instability picture, it depends sensitively on the mean mass density (Peebles (1980), 1993).
We are not concerned here with the relationship between the absorbers and galaxy haloes, or with small–scale structure. However, in another paper (Quashnock & Vanden Berk (1996)) we discuss the small–scale clustering of absorbers and relate it to galaxy clustering.
In this Letter, we present results of an analysis of line–of–sight correlations of C iv absorption line systems, using a new and extensive catalog of absorbers (Vanden Berk et al. 1996a ). This catalog contains data on all QSO heavy–element absorption lines in the literature, complete up to December 1995, with some additional entries since then. It is an updated version of the catalog of York et al. (1991), but is more than twice the size, with over 2200 absorbers listed over 500 QSOs, and is the largest sample of heavy–element absorbers compiled to date. More details can be found in the earlier version of the catalog, as well as in our recent paper (Vanden Berk et al. 1996b ) in which we find that the number of absorbers is correlated with the intrinsic brightness of the QSO, suggesting that QSOs are lensed by matter associated with the absorbers. A preliminary study suggests that the absorber correlation function is not strongly dependent on the intrinsic brightness of the QSO. We describe the correlation analysis in §2, present our results in §3, and discuss the implications of these in §4.
2 Correlation Analysis of C iv Absorbers
Here we briefly describe our procedure for calculating the line–of–sight correlation function, . Unless otherwise noted, we take and . We follow the usual convention and take to be the Hubble constant in units of 100 km s-1 Mpc-1.
To produce a more uniform set of absorbers from the inhomogeneous catalog, we have applied the following selection criteria to the QSO spectra and absorbers. The Ly forest region of each spectrum was excluded because identification of heavy–element lines there is problematic. This means we examine absorbers within about 60,000 km s-1, or about 400 Mpc, of the QSO. The so–called associated region within 5000 km s-1 of each QSO emission redshift has also been excluded, since the number density of absorbers there may not be representative of that for absorbers farther removed in redshift from their QSOs (Aldcroft, Bechtold, & Elvis (1994)). Thus a typical redshift range for a line of sight is . All of the selected absorption systems must at least have an identified C iv doublet, and if no other line was identified, the equivalent width ratio of the 1548 Å component to the 1551 Å component must be within the listed measurement errors. In addition, the equivalent width of the 1548 Å component must have been detected at more than the level, and have a rest value of at least Å. In order to avoid aliasing of power (Tytler, Sandoval, & Fan (1993)) on the large scales of interest because of the very pronounced peak in the correlation function on small scales (Sargent, Boksenberg, & Steidel (1988); Quashnock & Vanden Berk (1996)), we have combined all absorbers lying within 3.5 comoving Mpc of each other ( km s-1) into a single system with redshift equal to the average redshift of the components and with equivalent width equal to that of the strongest component. Because of this, we have included only spectra with resolutions that allow absorber comoving separations Mpc to be resolved.
These selection criteria leave a total of 360 C iv absorption systems, with redshifts from 1.2 to 4.5, scattered among 373 QSO lines of sight. The distribution in the total number of absorbers over the line of sight is consistent with that from a uniform distribution. For number of absorbers per line of sight 0 through 7, the observed versus expected number of lines of sight are (207, 190.34), (67, 82.52), (49, 52.23), (22, 28.24), (16, 12.92), (9, 4.61), (1, 1.60), and (2, 0.39). A KS–test shows that the two distributions are consistent with each other (). This shows that the average distribution of absorbers on 400 Mpc scales is uniform.
To study the distribution on smaller scales, we use the C iv line–of–sight correlation function, , which is calculated by binning the comoving separation, , of absorber pairs and comparing the number of real pairs, , in a bin to the average number of pairs, , generated from 100 Monte Carlo simulations; namely, . The simulated absorber samples are generated by randomly redistributing all of the real absorbers among the QSO spectra, subject to the condition that the absorbers could have been detected in both redshift and equivalent width in their randomly selected QSO spectra. This technique is possible because the catalog of absorbers lists the wavelength limits and equivalent width limits for each of the listed QSO spectra. This technique has the virtue that the redshift and equivalent width number densities of all the simulated data sets are exactly the same as for the real data set, so that the real and simulated data sets have the same evolution of physical properties as a function of redshift. The region of scatter around the null hypothesis of no clustering () is given by the standard deviation of in the 100 random simulations, whereas the error in the estimator of in each bin is (Peebles (1980)). When clustering is present, these errors will be different.
3 Results
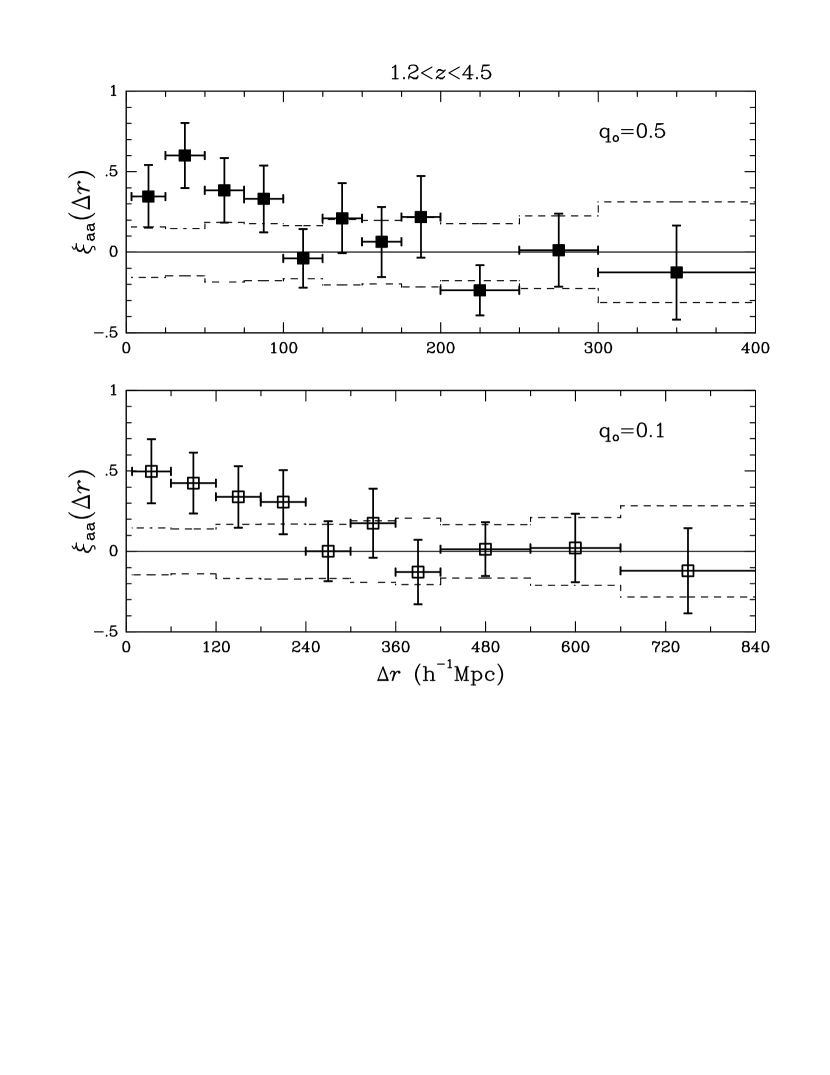
The size and extent of the absorber catalog of Vanden Berk et al. (1996a) permits exploration of clustering over an unprecedented range in scale (from about 1 to over 300 Mpc) and redshift ( from 1.2 to 4.5). Figure 1 shows the line–of–sight correlation function of C iv absorbers, , as a function of absorber comoving separation, , for the entire sample of absorbers. The results are shown for both a (top panel, 25 Mpc bins) and a (bottom panel, 60 Mpc bins) cosmology.111Larger bins are required for because, at high redshift, a larger comoving separation arises from a fixed redshift interval . The vertical error bars through the data points are errors in the estimator for , which differ from the region of scatter (dashed line, calculated by Monte Carlo using the bootstrap technique described above) around the no–clustering null hypothesis.
Remarkably, there appears to be significant clustering in the first four bins of Figure 1: The mean correlation for those bins is () or (). Here the errors quoted are the errors in the estimate of the correlation function (corresponding to the error bars in Figure 1). In assessing the significance of these results, however, the appropriate measure of departure from uniformity is the region of scatter around the null hypothesis (corresponding to the dashed lines in Figure 1), which equals 0.085 () or 0.082 (). Thus, the positive correlation seen in the first four bins of Figure 1 has a significance of , if , and if . Therefore, there is significant evidence of clustering of matter traced by C iv absorbers on scales up to 100 Mpc () or 240 Mpc ().
There is no evidence from Figure 1 for clustering on comoving scales greater than these. The mean correlation of the last six bins in Figure 1 is ( or 0.1), which is consistent with zero.
We have investigated the evolution of the superclustering by dividing the absorber sample into three approximately equal redshift sub–samples. Figure 2 shows , as a function of absorber comoving separation, (), for low (, top panel), medium (, middle panel), and high (, bottom panel) redshift absorber sub–samples. Larger bins for the comoving separation were used in Figure 2 because of the smaller number of absorbers in each sub–sample. The error bars are as in Figure 1.
The correlation function estimator is positive in the first two bins (corresponding to scales of 100 Mpc and less, like the first four bins in Figure 1, top panel) in all three panels of Figure 2: The mean correlation () is for the low redshift sub–sample, for the medium redshift sub–sample, and for the high redshift sub–sample. The values for are essentially the same as these.
Thus, the significant superclustering seen in Figure 1 is present in all three redshift sub–samples in Figure 2, so that the superclustering is present even at redshift . Furthermore, it does not appear that the superclustering scale, in comoving coordinates, has changed significantly since then.
4 Discussion
We have found evidence for the existence of large–scale superclustering that has existed since redshift and has a comoving scale Mpc () or 240 Mpc () that has not changed much since then. We have examined the clustering signal more closely and find that a large portion comes from 7 QSO lines of sight that have groups of 4 or more C iv absorbers within a 100 Mpc interval (). (From Monte Carlo simulations, we expect only QSOs with such groups.) When these are removed, the mean correlation function on scales of 100 Mpc and less () is . Table 1 lists these 7 QSOs, along with the properties of their groups of C iv absorbers.
Several of the groups in Table 1 have been previously identified as potential superclusters (Romani, Filippenko, & Steidel (1991); Aragón-Salamanca et al. (1994)); indeed, superclustering has been suggested because of an unusual concentration of absorbers, within several tens of megaparsecs, in the lines of sight of 1037–2704 and 1038–2712 (Jakobsen et al. (1986); Sargent & Steidel (1987); Robertson (1987); Dinshaw & Impey (1996); Lespine & Petitjean (1996)), and 0237–233 (Boissé (1987); Heisler, Hogan, & White (1989); Foltz et al. (1993)). However, there was concern that any inferred superclustering might be overestimated because of aliasing of small–scale power. Like Dinshaw & Impey (1996), we find that superclustering is not caused by aliasing, since it remains after combining all absorbers lying within 3.5 Mpc of each other into a single system. (For example, we count the 11 absorbers of 0237–233 in a 100 Mpc interval as being 4 independent systems.) We have found two potential superclusters in the spectra of QSOs 2126–158 and 2359+068, at redshift .
The superclustering is indicative of generic large–scale clustering in the universe, out to high redshift , on a scale frozen in comoving coordinates that is — if — similar to the size of the voids and walls in galaxy redshift surveys of the local universe (), such as the CfA survey (Geller & Huchra (1989)) and others (Kirshner et al. (1981); Chincarini, Giovanelli, & Haynes (1983); da Costa et al. (1994); Landy et al. (1996)). It also appears consistent with the general finding of Broadhurst et al. (1990) that galaxies are clustered on very large scales, although we have not confirmed that there is quasi–periodic clustering with power peaked at 128 Mpc. It may also have been found in quasars (Kravtsov (1996)).
Our estimate of the superclustering scale increases to 240 Mpc if (see Figure 1), which is larger than the largest scales of clustering known at present. If the structures traced by C iv absorbers are of the same nature as those seen locally in galaxy redshift surveys, the superclustering scale should have a value closer to 100 Mpc . This may be indicative of a larger value of , and hence .
In Figure 3, we show the mean correlation function, , on scales of 50 Mpc and less, as a function of redshift , for the entire data set of absorbers (solid symbols), and for strong Mg ii absorbers (Steidel & Sargent (1992), open symbol), with . Also shown is its expected dependence on redshift, calculated from the growth factor (Peebles (1980), 1993), normalized to the sample mean correlation of 0.48 at the sample median redshift of , for (solid line) and (dashed line). While the evolution of the correlation function on 50 Mpc scales is consistent with that expected in cosmologies with density parameter ranging from 0.1 to 1, the Sloan Digital Sky Survey should give better estimates for (see the typical error bar at the upper right of Figure 3) and will be able to constrain to 20%.
It is possible that structures of size Mpc may have arisen through the Zel’dovich “pancake” scenario (Zel’dovich (1970); Melott & Shandarin (1990); Peebles (1993)), and that this particular scale has deep significance because it is of order the horizon size at decoupling, and is the scale on which an “acoustic peak” is expected in the initial power spectrum of many cosmologies (Peebles (1993); Landy et al. (1996)). The lack of clustering on scales greater than 100 Mpc has implications on the peak and turn–over scale of the power spectrum (Quashnock & Vanden Berk (1996)).
Acknowledgements.
We acknowledge helpful discussions with Don Lamb, Paul Ricker, Bob Rosner, and Alex Szalay, and statistical comments by Carlo Graziani. Damian Bruni and Chris Mallouris have greatly assisted in compiling the new catalog. JMQ is supported by the Compton Fellowship – NASA grant GDP93-08. DEVB was supported in part by the Adler Fellowship at the University of Chicago, and by NASA Space Telescope grant GO-06007.01-94A.| QSO | ( Mpc) | ||||
|---|---|---|---|---|---|
| 0149+336 | 0.57 | 4 | 2.1583 | 0.1593 | 85.8 |
| 0237–233 | 0.30 | 4 | 1.6348 | 0.0775 | 54.4 |
| 0958+551 | 0.25 | 4 | 1.3207 | 0.1045 | 88.5 |
| 1037–270 | 0.90 | 5 | 2.0133 | 0.1703 | 98.5 |
| 1038–272 | 0.79 | 4 | 1.9283 | 0.1642 | 98.2 |
| 2126–158 | 0.47 | 5 | 2.7265 | 0.1814 | 75.6 |
| 2126–158∗∗Part of this group forms another group (also listed) with an additional absorber within the same QSO, but the extent of the two groups taken together exceeds 100 Mpc. is the number of expected absorbers in the interval . | 0.74 | 5 | 2.7804 | 0.2280 | 92.6 |
| 2359+068 | 0.51 | 6 | 2.8303 | 0.2125 | 84.8 |
| 2359+068∗∗Part of this group forms another group (also listed) with an additional absorber within the same QSO, but the extent of the two groups taken together exceeds 100 Mpc. is the number of expected absorbers in the interval . | 0.64 | 6 | 2.8730 | 0.2394 | 94.5 |
References
- Aldcroft, Bechtold, & Elvis (1994) Aldcroft, T. L., Bechtold, J., & Elvis, M. 1994, ApJS, 93, 1
- Aragón-Salamanca et al. (1994) Aragón-Salamanca, Ellis, R. S., Schwartzenberg, J.-M., & Bergeron, J. A. 1994, ApJ, 421, 27
- Boissé (1987) Boissé, P. 1987, in High Redshift and Primeval Galaxies, ed. J. Bergeron, D. Kunth, B. Rocca, & J. Tran Thanh Van (Paris: Editions Frontières)
- Broadhurst et al. (1990) Broadhurst, T. J., Ellis, R. S., Koo, D. C., & Szalay, A. S. 1990, Nature, 343, 726
- Chincarini, Giovanelli, & Haynes (1983) Chincarini, G. L., Giovanelli, R., & Haynes, M. P. 1983, A&A, 121, 5
- Crotts, Melott, & York (1985) Crotts, A. P. S., Melott, A. L., & York, D. G. 1985, Phys. Letters B, 155B, 251
- da Costa et al. (1994) da Costa, L. N., et al. 1994, ApJ, 424, L1
- Dinshaw & Impey (1996) Dinshaw, N., & Impey, C. D. 1996, ApJ, 458, 73
- Foltz et al. (1993) Foltz, C. B., Hewett, P. C., Chaffee, F. H., & Hogan, C. J. 1993, AJ, 105, 22
- Geller & Huchra (1989) Geller, M. J., & Huchra, J. P. 1989, Science, 246, 897
- Heisler, Hogan, & White (1989) Heisler, J., Hogan, C. J., & White, S. D. M. 1989, ApJ, 347, 52
- Jakobsen et al. (1986) Jakobsen, P., Perryman, M. A. C., Ulrich, M. H., Machetto, F., & Di Serego Alighieri, S. 1986, ApJ, 303, L27
- Kirshner et al. (1981) Kirshner, R. P., Oemler, A., Schecter, P. L., & Shectman, S. A. 1981, ApJ, 248, L57
- Kravtsov (1996) Kravtsov, A. V. 1996, MNRAS, submitted
- Landy et al. (1996) Landy, S. D., Schectman, S. A., Lin, H., Kirshner, R. P., Oemler, A. A., & Tucker, D. 1996, ApJ, 456, L1
- Lespine & Petitjean (1996) Lespine, Y., & Petitjean, P. 1996, A&A, in press
- Melott & Shandarin (1990) Melott, A. L., & Shandarin, S. F. 1990, Nature, 346, 633
- Peebles (1980) Peebles, P. J. E. 1980, The Large–Scale Structure of the Universe (Princeton: Princeton Univ. Press)
- Peebles (1993) Peebles, P. J. E. 1993, Principles of Physical Cosmology (Princeton: Princeton Univ. Press)
- Quashnock & Vanden Berk (1996) Quashnock, J. M., & Vanden Berk, D. E. 1996, ApJ, submitted
- Robertson (1987) Robertson, J. G. 1987, MNRAS, 227, 653
- Romani, Filippenko, & Steidel (1991) Romani, R. W., Filippenko, A. V., & Steidel, C. C. 1991, PASP, 103, 154
- Sargent, Boksenberg, & Steidel (1988) Sargent, W. L. W., Boksenberg, A., & Steidel, C. C. 1988, ApJS, 68, 539
- Sargent & Steidel (1987) Sargent, W. L. W., & Steidel, C. C. 1987, ApJ, 322, 142
- Shaver & Robertson (1983) Shaver, P.A., & Robertson, J. G. 1983, ApJ, 268, L57
- Steidel & Sargent (1992) Steidel, C. C., & Sargent, W. L. W. 1992, ApJS, 80, 1
- Tytler, Sandoval, & Fan (1993) Tytler, D., Sandoval, J., & Fan, X.-M. 1993, ApJ, 405, 57
- (28) Vanden Berk, D. E., et al. 1996a, ApJS, submitted
- (29) Vanden Berk, D. E., Quashnock, J. M., York, D. G., & Yanny, B. 1996b, ApJ, 469, 78
- York et al. (1991) York, D. G., Yanny, B., Crotts, A., Carilli, C., Garrison, E., & Matheson, L. 1991, MNRAS, 250, 24
- Zel’dovich (1970) Zel’dovich, Ya. B. 1970, A&A, 5, 84
Line–of–sight correlation function of C iv absorbers, , as a function of absorber comoving separation, , for the entire sample of absorbers, in a (top panel, 25 Mpc bins) and a (bottom panel, 60 Mpc bins) cosmology. The vertical error bars through the data points are errors in the estimator for , which differ from the region of scatter (dashed line) around the null hypothesis of no clustering ().
Line–of–sight correlation function of C iv absorbers, , as a function of absorber comoving separation, (), for low (, top panel), medium (, middle panel), and high (, bottom panel) redshift absorber sub–samples . The vertical error bars through the data points are errors in the estimator for .
Mean correlation function, , on scales of 50 Mpc and less, as a function of redshift , for the entire data set of C iv absorbers (solid symbols), and for strong Mg ii absorbers (Steidel & Sargent (1992), open symbol), with . Also shown is its expected dependence on redshift, normalized to the sample mean of 0.48 at the median sample redshift of , for (solid line) and (dashed line). The expected error bar from the Sloan Digital Sky Survey is shown in the upper right.