Selection effects on X-ray and strong-lensing clusters in
various
cosmologies
Galaxy clusters are hotter and more X-ray luminous than in quiescence while they undergo major mergers, which also transiently increase their strong-lensing efficiency. We use semi-analytic models for both effects to study how cluster dynamics in different dark-energy models affects the X-ray selected cluster population and its strong-lensing optical depth. We find that mergers increase the number of observable X-ray clusters by factors of a few and considerably broaden their redshift distribution. Strong-lensing optical depths are increased by a very similar amount. Quite independent of cosmology, X-ray bright clusters above a flux limit of produce of the strong-lensing optical depth, and only above a flux limit of if mergers are taken into account.
1 Introduction
Cluster selection by X-ray emission is generally believed to produce well-defined samples of massive clusters. This is certainly true for relaxed objects near virial equilibrium, but clusters undergo substantial evolution during the cosmic epoch which we can overlook. Numerical simulations demonstrate that temperatures and X-ray luminosities of the intracluster gas increase by factors of a few for periods which are comparable to the sound-crossing time while clusters undergo major mergers. This may lead to a substantial contamination of X-ray flux-selected cluster samples by less massive, but dynamically active clusters. This bias needs to be quantified before cosmological conclusions based on the cluster population can be considered reliable.
Massive and compact galaxy clusters are also efficient strong lenses. This gives rise to the expectation that strong lensing should be particularly frequent in X-ray selected cluster samples, and in fact many X-ray luminous clusters have been found to be strong gravitational lenses.
However, strong cluster lensing can also be transiently increased by factors (Torri et al., 2004) during major cluster mergers, on time-scales comparable to the dynamical cluster time-scale. This may lift relatively low-mass clusters above the criticality limit for strong lensing which would otherwise be undercritical. Based on a relatively small sample of numerically simulated galaxy clusters, Bartelmann & Steinmetz (1996) pointed out that X-ray selection is not guaranteed to select for the most efficient, strongly-lensing galaxy clusters. Early work on the interplay between strong lensing statistics and observational selection effects can also be found in Wu & Mao (1996) and Cooray (1999).
Both effects of major mergers, the enhancement of their X-ray visibility and their strong-lensing efficiency, potentially open a huge reservoir of clusters which would remain unobservable in quiescence. The amplitude of this effect must depend on the frequency of major mergers, and thus on the cosmological model and its parameters. Specifically, merger rates at fixed redshift depend on the amount of dark matter and dark energy and its cosmic evolution.
Here, we address the question how X-ray cluster selection may affect the strong-lensing efficiency of the selected clusters, and what fraction of the optical depth for strong lensing we can expect to be produced by galaxy clusters visible above a certain X-ray flux limit. In addition to the standard CDM cosmology, we analyse three cosmological models with dynamical dark energy which predict different merger histories. Two of them have a small, but finite dark-energy density in the early universe and are thus expected to host cluster populations which form earlier in time.
We combine two semi-analytic methods, one derived by Randall et al. (2002) describing the enhancement of X-ray temperatures and luminosities during mergers, and another developed by Fedeli et al. (2006) for calculating strong-lensing cluster cross sections. Cluster merger histories are modelled by merger trees planted in the extended Press-Schechter formalism.
We summarise the model for the enhanced X-ray temperature and luminosity in the next section and their translation into observable fluxes in Sect. 3. We describe the application of this model to simulated cluster populations in Sect. 4, present our results in Sect. 5 and conclude in Sect. 6.
2 Luminosity and temperature boost
When galaxy clusters undergo violent dynamical events, such as interactions with substantial substructures or mergers with galaxy groups and clusters of comparable mass, the intra-cluster medium (ICM) is compressed and heated by ram pressure and shock waves. This results in an overall enhancement of the mean gas temperature and the X-ray emissivity due to bremsstrahlung. The dynamics of gas and dark matter in clusters during major mergers is typically very complicated and usually studied based on numerical simulations (see e.g. Poole et al. 2006, 2007 for a recent review and applications).
It will be sufficient for our purposes to model the short-term increases in temperature and X-ray luminosity in a simplified manner which captures their important characteristics in a statistically correct way. Such a simplified model is given by Randall et al. (2002). There, the authors derive fitting formulae for the time-dependent increase in average temperature relative to its unperturbed value of the combined system of main cluster and merging body during its interaction.
They employ -body cluster simulations combined with adiabatic hydrodynamics developed and described in earlier work (Ricker & Sarazin, 2001; Ricker et al., 2000). Shocks in the ICM are extremely well resolved in these simulations, allowing temperature and luminosity increases to be studied in detail.
Randall et al. (2002) find that the total time interval during which the average temperature or bolometric luminosity of the ICM of the system are raised above fixed levels or is given by
| (1) |
where is the ratio between the quantity in question, or , and its unperturbed value or . The parameter is related to the maximum value of the boost, as will be explained below. The time interval is measured in units of the sound-crossing time of the main cluster body by . Assuming isothermal gas, the sound-crossing time is
| (2) |
where the virial radius of the dark matter halo of the main cluster, , is taken as a characteristic dimension, is the mean molecular weight of the ICM (assumed to be throughout this work) and is the proton mass.
The merger is characterised by the mass fraction of the secondary cluster,
| (3) |
which obviously reaches a maximum value of for equal-mass mergers. The fit parameters and are then expressed as power laws of ,
| (4) |
and
| (5) |
The amplitudes and exponents appearing in the last three equations were calibrated by Randall et al. (2002) against their simulations. They are summarised in Table 1 for the boosts in both the temperature and the bolometric -ray luminosity.
| quantity | A | B | C | D | E | F |
|---|---|---|---|---|---|---|
| temperature | ||||||
| luminosity |
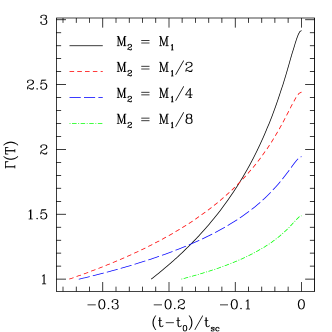
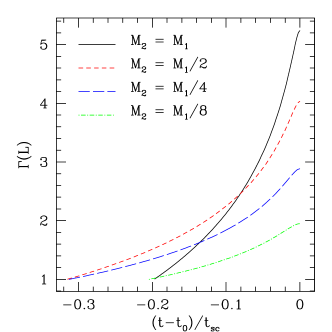
We plot the function for the temperature and the luminosity in Figure 1. It shows the temperature and bolometric luminosity of the merging system in units of the pre-merger values as a function of time in the interval between the beginning of the boost () to the moment of perfect overlap of the two clusters (and thus of the maximum boost, ). The mass of the main cluster is set to , and results are shown for four different values for the mass of the merging substructure.
As intuitively expected, these plots show that the maximum temperature and luminosity reached by the system is larger when the masses involved in the merger process are similar. In that case, duration of the boost is also minimal. Moreover, the curves illustrate that the relative increase in bolometric luminosity exceeds the one in average temperature, reflecting the higher sensitivity of bremsstrahlung emission to the density compared to the temperature.
Finally we emphasise that the fitting formulae for the average temperature and bolometric -ray luminosity enhancements given above are valid only for head-on mergers. Generalisations to non-zero impact parameters are given in Randall et al. (2002), but we assume head-on mergers throughout for simplicity. Note that, for a non-head on merger, the duration of the boosts in temperature and luminosity is larger, but their maximum values are smaller. These are two somewhat counter-acting effects, and we expect the total influence to be not significant for our pourposes.
3 Fluxes obtained from individual clusters
We shall refer mainly to one particular set of observed galaxy clusters when comparing to observations, i.e. the ROSAT-ESO Flux Limited X-ray cluster sample (Reflex, Collins et al. 2000; Schuecker et al. 2001; Böhringer et al. 2001), which was drawn from the ROSAT All-Sky Survey (RASS, Snowden & Schmitt 1990). In this section, we describe the construction of a synthetic cluster sample imitating the procedure used for the construction of the Reflex sample.
3.1 Ideal flux
We describe the merger history of individual clusters by means of merger trees constructed based on the extended Press-Schechter theory (Press & Schechter, 1974; Bond et al., 1991; Lacey & Cole, 1993; Somerville & Kolatt, 1999). Thus, the only information we have on each individual galaxy cluster is its mass and its redshift. We first related these properties to the idealised X-ray flux, that is the flux that would be measured in the absence of any instrumental issue. Next, we shall add background noise, convolution with the point-spread function (PSF), and the detector response.
We start from the virial relation between mass, redshift and temperature of the ICM,
| (7) |
where is the (reduced) Hubble parameter at the redshift of the cluster, and the normalisation constant is calibrated with the cluster simulations of Mathiesen & Evrard (2001).
Introducing the temperature-mass relation (7) into a merger tree, we assign temperatures to individual clusters. When a cluster is merging with a substructure according to its merger tree, we can either ignore the temperature and luminosity boost caused by the merger. In this case, only the increasing cluster mass will cause the temperature to rise. Or, we can boost the temperature according to the description outlined in the previous section, depending on the state of the merger process. In both cases, we obtain a unique temperature for each cluster at each redshift step in its merger tree.
We note here that no statistical fluctuations are taken into account in our assignment of X-ray temperatures and luminosities to clusters of a given mass. Thus, once the mass of the main cluster body and a merging subclump are fixed, the same merger phase will always lead to the same temperature increase. However, mergers do introduce statistical fluctuations into the temperature-luminosity relations of our simulated clusters. We shall return to this point further below.
We also clarify that we consider only binary mergers here. Whenever a cluster undergoes a multiple merger, we model only the one with the most massive substructure, neglecting the others in comparison. Since the simultaneous interaction of a galaxy cluster with more than one massive substructure is an extremely rare event, we believe that this approximation is sufficiently accurate for our pourposes.
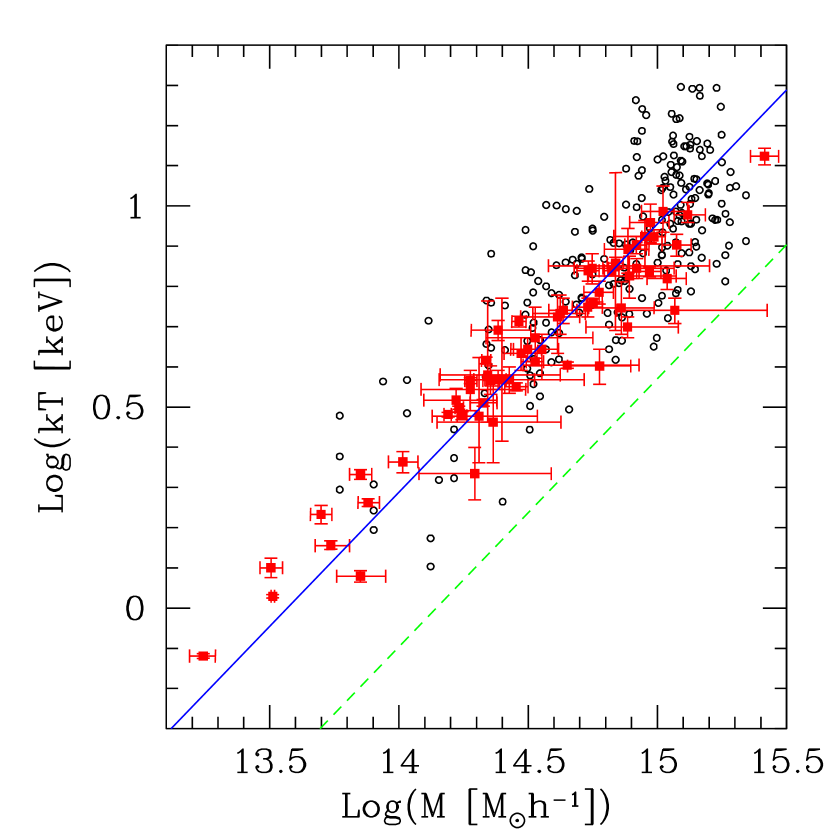
Figure 2 shows the relation between the mass and the temperature for low-redshift model clusters in our synthetic sample, after the temperature boost due to mergers has been applied. The normalization is obviously higher (a factor ) than that of the original relation Eq. (7) because cluster mergers always increase the cluster temperatures. However, the slope of the relation is well preserved, and the resulting sample fairly reproduces the observed HIFLUGCS cluster sample (Reiprich & Böhringer, 2002), which mostly contains low-redshift clusters. This supports the validity of our model.
Next, we need to derive the ideal flux from the mass, the redshift and the temperature. We do so using the publically available software package xspec (Arnaud, 1996), assuming that the ICM can be described by a Raymond-Smith (Raymond & Smith, 1977) plasma model. We set the metal abundance to (Fukazawa et al. 1998; Schindler 1999, see also Bartelmann & White 2003). We normalise the spectrum by means of the observationally calibrated relation
| (8) |
derived by Allen & Fabian (1998), where is the bolometric -ray luminosity (see also Mushotzky & Scharf (1997); Reichart et al. (1999); Hashimoto et al. (2002) for some discussion on the redshift evolution of this relation).
Several authors (Stanek et al., 2006; O’Hara et al., 2006; Pratt et al., 2006) have discussed that the observed scatter in the temperature-mass and luminosity-temperature relations might not be entirely caused by recent mergers, but rather be sensitive to the complete merger history of the cluster. However, we verified that the scatter in the natural logarithm of mass around the best fit mass-luminosity relation that we obtain for nearby clusters in our synthetic sample is and thus agrees well with the observed value for the HIFLUGCS data (Reiprich & Böhringer, 2002; Stanek et al., 2006). Hence, we conclude that our modeling of mergers introduces scatter into the luminosity-mass relation compatible with the observed scatter, and thus fairly captures the observed statistical fluctuations.
Finally, we take account of the interstellar absorption by neutral hydrogen in the Milky Way. We do so by combining our Raymond-Smith plasma model with the phabs multiplicative model component of the xspec software, adopting a constant hydrogen column density of cm-2, appropriate for relatively high galactic latitudes (Dickey & Lockman, 1990).
3.2 Instrumental effects
In constructing the Reflex cluster sample, Böhringer et al. (2001) used the count rate received for each individual cluster by the ROSAT PSPC detector in the energy channels covering the [0.5, 2.0] keV energy band. To compute synthetic count rates for each object in our simulated cluster population, we first need to introduce a model for the distribution of the ICM within the clusters. We adopt the isothermal -model (Cavaliere & Fusco-Femiano, 1976, 1978), assuming throughout, following Mohr & Evrard (1999).
The resulting gas-density profile is
| (9) |
Its core radius is related to the X-ray luminosity in the [0.5,2.4] keV energy band through
| (10) |
(Jones et al. 1998; see Vikhlinin et al. 1997 for a discussion on the redshift evolution of this relation).
Since the emissivity of thermal bremsstrahlung is proportional to the squared gas density, this density profile implies the surface brightness profile
| (11) |
normalised by
| (12) |
Here, is the total flux in the respective energy band (i.e. the integral of the surface brightness profile over the solid angle), and . Obviously, is the angular-diameter distance to redshift .
We next convolve this surface-brightness profile with the instrumental PSF. The shape of the ROSAT-PSPC PSF is summarised in Bartelmann & White (2003) based on Hasinger et al. (1995). Its shape depends slightly both on the energy channel considered and on the off-axis angle of the source. For simplicity, we shall assume on-axis sources and an energy channel at 1 keV, approximately at the centre of the energy bands considered in the present work.
Background count rates are provided in form of a map on the RASS web page111http://www.xray.mpe.mpg.de/cgi-bin/rosat/ rosat-survey. We use a constant median value of s-1 arcmin-2, but note that our results are quite independent of the background correction.
Finally, we obtain the count rate produced by the PSF-convolved, background-corrected surface-brightness profile. We integrate over the complete profile using the fakeit command of the xspec software, adopting the PSPC response matrix in the [0.5,2.0] keV energy band.

3.3 Nominal flux
The nominal flux for the Reflex cluster sample is defined as the flux produced in the [0.1,2.4] keV energy band by a Raymond-Smith model plasma set to redshift zero, with a temperature of 5 keV, metal abundance of , absorption as given by Dickey & Lockman (1990) and a spectrum normalised so as to reproduce the observed number counts in the energy channels corresponding to the [0.5,2.0] keV band (Collins et al., 2000; Böhringer et al., 2001).
To each cluster and at each redshift step of its merger tree, we assign a nominal flux exactly in the same way. The only difference between the definitions of our synthetic sample and of the Reflex sample is that we normalise the spectrum of the plasma model so as to reproduce the count rates computed at the end of Subsect. 3.2.
The Reflex cluster sample is flux-limited, in the sense that it contains only galaxy clusters with nominal flux erg s-1 cm-2. We here adopt the same nominal flux as a threshold for synthetic cluster samples. We shall use the nominal Reflex flux limit and four additional lower flux limits in order to create synthetic samples containing a larger number of objects.
The relation between this nominal flux and the ideal flux introduced in Sect. 3.1 (without hydrogen absorption) is shown in Fig. 3, where the mean difference between the two fluxes, normalised to the ideal flux, and its standard deviation are plotted as functions of the ideal flux itself.
According to the definition given at the beginning of this section, the ideal flux of a cluster is computed in the energy band [0.5,2.0] keV, while the nominal flux is the flux in the [0.1,2.4] keV band of a fiducial cluster with fixed physical properties (, keV, ) that produces the same count rates as the cluster at hand in the [0.5,2.0] keV band. Since the nominal flux is computed in a wider and softer band than the ideal flux, there is a bias because the nominal flux exceeds the ideal flux typically by . The scatter about the mean is relatively large for small fluxes, but drops to zero as the flux increases because then the effects of PSF convolution and background subtraction are smaller. We conclude from this plot that the ideal may be used instead of the nominal flux, thus saving the time for the computation of hydrogen absorption and instrumental effect, but only when the flux is sufficiently large ( erg s-1 cm-2) and accounting for the bias.
4 Application to the cluster population
4.1 Cosmological models
We base our analysis on the same cosmological models analysed in Fedeli & Bartelmann (2007). These are a standard CDM model, a universe with a constant equation-of-state parameter for the dark energy, and two early-dark energy models (Ferreira & Joyce, 1998; Doran et al., 2001a, b; Caldwell et al., 2003; Wetterich, 2004). In such models, the quintessence energy density tracks that of the dominant component of the cosmic fluid until it begins dominating in the late cosmic history. They are characterised by a small but non-negligible amount of dark energy at very early times, which may influence all kinds of high-redshift processes. Bartelmann et al. (2006) showed that early dark energy also affects the non-linear structure formation, giving rise to significant differences in the mass function and the merger rates of dark-matter halos compared to the concordance CDM model.
The matter power spectrum is scale-invariant () for the models with a constant , while the spectral indices are in the first and in the second early-dark energy model (hereafter called models EDE1 and EDE2 respectively). The other cosmological parameters for all models studied here are summarised in Tab. 2. They were set such as to match the power spectrum of the CMB temperature fluctuations (Spergel et al., 2003, 2006), constraints from the large-scale structure of the Universe (Tegmark et al., 2004), and observations of type-Ia supernovae (Riess et al., 2004). Note that this requires different normalisations for the dark-matter power spectrum in the different cosmological models, which also affect the differences in the mass-assembly histories. Fedeli & Bartelmann (2007) studied the total strong-lensing optical depth of the cluster population expected in these model cosmologies. Here, we extend this study by taking X-ray selection effects into account and exploring the effect of early dark energy on the number of clusters in flux-limited samples.
| EDE1 | EDE2 | CDM | ||
|---|---|---|---|---|
| 0.82 | 0.78 | 0.80 | 0.84 | |
| 0.67 | 0.62 | 0.65 | 0.65 | |
| 0.33 | 0.36 | 0.30 | 0.30 | |
| 0.67 | 0.64 | 0.70 | 0.70 |
4.2 Merger trees
As already stated, we use here the merger trees produced in Fedeli & Bartelmann (2007) for a set of dark matter haloes with masses uniformly distributed between and . In Fedeli & Bartelmann (2007), we computed for each cluster the lensing cross section for gravitational arcs with length-to-width ratio larger than , using the fast, semi-analytic method developed by Fedeli et al. 2006. The objects in the sample were evolved up to a source redshift randomly drawn from an observed distribution of faint blue background galaxies (Smail et al., 1995; Bartelmann & Schneider, 2001). Lensing efficiencies were calculated both ignoring and accounting for mergers with substructures which transiently enhance the cross sections.
We apply the same scheme here, calculating the nominal X-ray flux for each sample cluster at each redshift step. We do that both ignoring and accounting for the effect of mergers which transiently enhance the intrinsic luminosity and temperature (and thus also the nominal flux) of the clusters.
Finally, we can combine this information with the calculations of the lensing efficiencies, evaluating the effect of flux selection on the statistics of gravitational arcs in galaxy clusters.
4.3 Cluster number counts
It is interesting note in passing how the previous calculations predict the total number of clusters in a flux-limited sample to change as a function of the limiting flux in the different cosmological models, and what the quantitative effect of mergers is in this respect.
We emphasise here that our algorithm for producing synthetic cluster samples is not ideally adapted to cluster-abundance studies because our cluster sample includes only relatively high-mass haloes, and thus the low-mass end of the distribution is not well sampled. Moreover, we did not take into account the likely steepening of the temperature-luminosity relation for low-mass clusters or galaxy groups. While this has no effect on samples of X-ray luminous, hot or strongly lensing clusters, it is likely that the overall number of structures in the different flux-limited samples is overestimated. This is because we tend to assign to objects with very low mass a temperature higher than expected in presence of steepening.
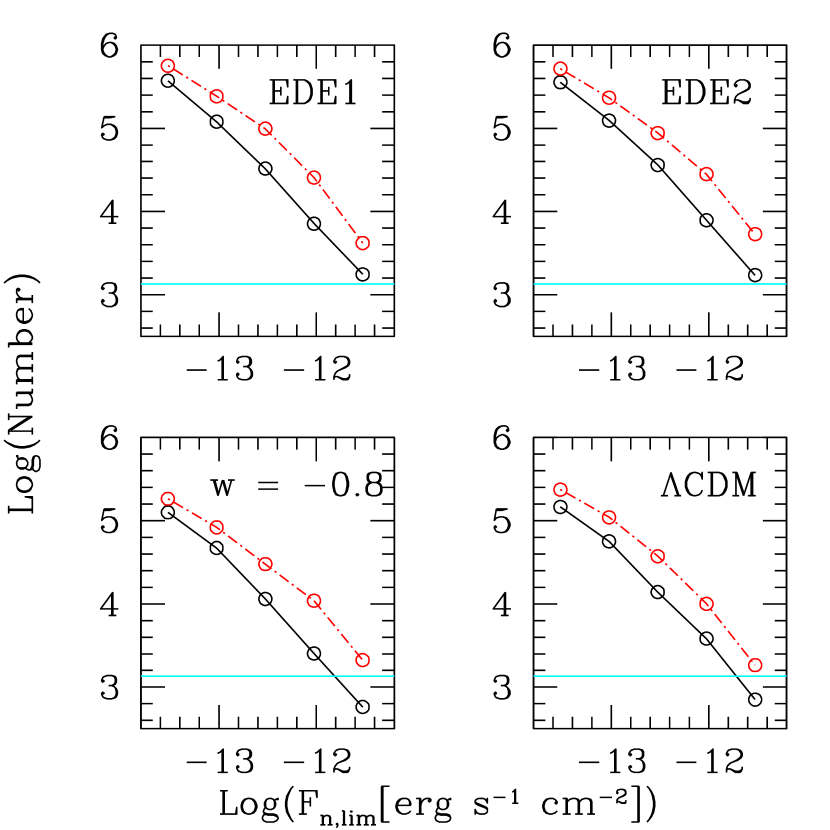
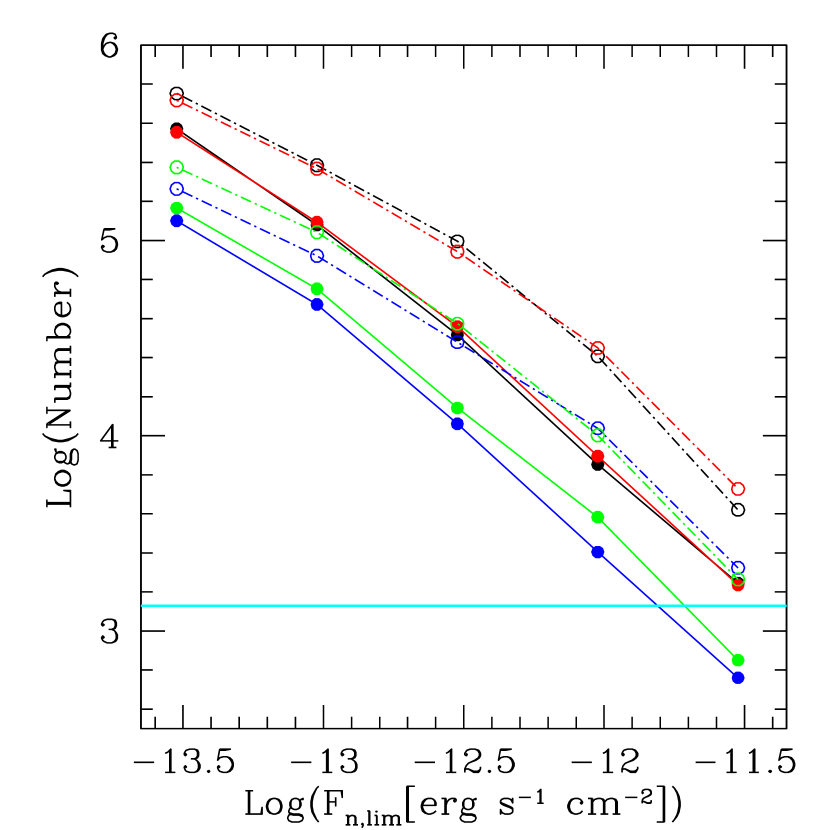
In Figs. 4 and 5, we show the total number of galaxy clusters predicted to be observed in the four cosmological models used here as a function of the limiting nominal flux. We plot results obtained by accounting for and ignoring the effects of cluster mergers, and indicate the total number of galaxy clusters observed in the Reflex cluster sample, extrapolated to the whole sky.
Several interesting pieces of information can be read off these figures. First of all, cluster mergers increase the total number of visible objects by factors between 2 and 3. This factor tends to decrease towards lower flux limits because of two effects. First, at low flux limits, the total number of clusters observable without mergers is larger, thus the fractional increase due to cluster interactions tends to be smaller. Second, at low flux limits, we include low-mass objects into the sample whose merger frequency is lower. We also see that, according to this analysis, only the models with constant equation-of-state parameter are in agreement with the Reflex observations, while early-dark energy models overpredict the cluster abundance by a factor of .
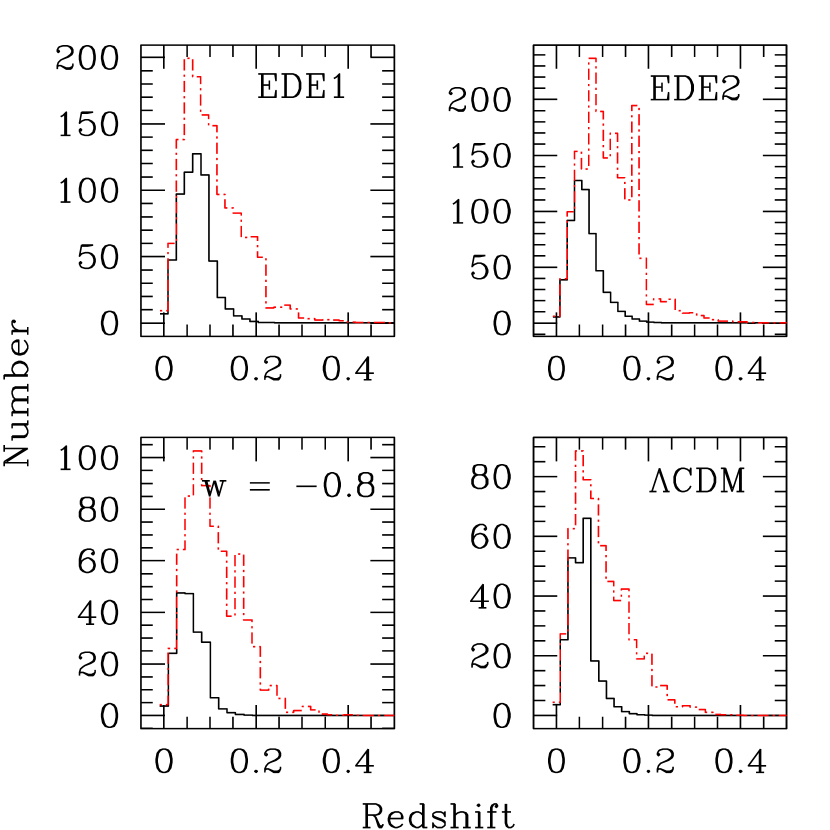
In Fig. 6, we fix the nominal flux limit to that of the Reflex sample, erg s-1 cm-2 and show a histogram of the redshift distribution of observed clusters. Again, we show results with and without the enhancements by cluster mergers. For all models, the number of clusters drops to zero above with mergers, and already above without mergers. The absence of substantial differences between different cosmologies is due to the fact that at low redshift the difference between the structure formation in presence or absence of early-dark energy tends to disappear (see also the discussion in Fedeli & Bartelmann 2007). It is interesting to note that the observational results from the Reflex sample (Collins et al., 2000) are qualitatively very well reproduced only accounting for cluster mergers. Ignoring the effect of interactions in our models leads to an underestimate of objects in the high-redshift tail.
In the context of Fig. 6, we also note that while the qualitative trend and the peak position of the observed Reflex distribution are reproduced, the normalisation is generally too high, for the reasons discussed.
5 Results
We finally return to the main purpose of this work, that is probe how cluster selection by their X-ray flux may influence the optical depth of the sample for the production of pronounced gravitational arcs when the effect of cluster mergers are taken into account. In other words, we analyse how the total number of arcs that we can expect to observe in an X-ray selected galaxy-cluster sample depends on the X-ray flux limit of the sample itself. While we have considered only arcs with in Fedeli & Bartelmann (2007), we extend the analysis here to arcs with (so-called giant arcs).
Figure 7 shows contour lines in the mass-redshift plane for the nominal X-ray flux of clusters from our synthetic sample, and for the cross section for arcs with length-to-width ratio larger than for the CDM cosmological model. Contours in the left and right panels were obtained ignoring mergers and taking them into account, respectively. We overplot the flux limit for the Reflex cluster sample. The edge in both the X-ray flux and lensing-efficiency contour lines going from the upper left to the lower right corner illustrates the lack of high-mass clusters at high redshift. These figures clearly show the effect of mergers on the lensing efficiency and the average X-ray flux from clusters. Including mergers, the contour lines are much more irregular and extend towards lower masses and higher redshifts, both for the nominal X-ray flux and for the cross section. The geometric suppression of the lensing efficiency at very low redshift is also evident since the black contours in the lower panels never reach , and turn further away from for lower cluster masses. The lensing efficiency expected to be observed in a CDM model in a Reflex-like cluster sample is thus contributed only by those clusters falling between the cyan curve and the lower contour lines in the lower panels.
We emphasise that Fig. 7 only shows the properties of individual objects in our synthetic sample. In order to find sample properties, this information must be convolved with the cluster mass function. This means that even the small wiggles appearing in the heavy contour in Fig. 7 when mergers are included will have a substantial effect on lensing statistics and number counts. We prefer not to weight with the mass function in Fig. 7 to illustrate exclusively the effect of the flux cut. To have an idea of the consequence that small shifts in the plane can have on the quantitative results, the number of structures in the narrow mass interval doubles when computed for compared to .
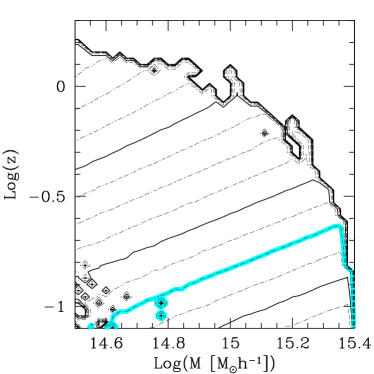
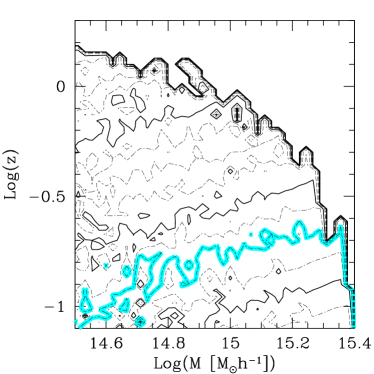
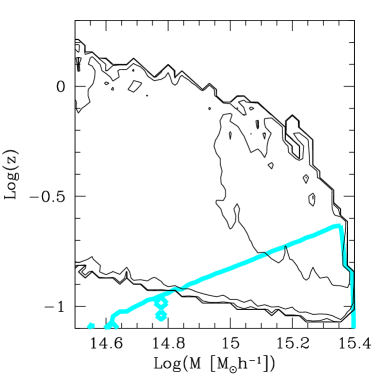
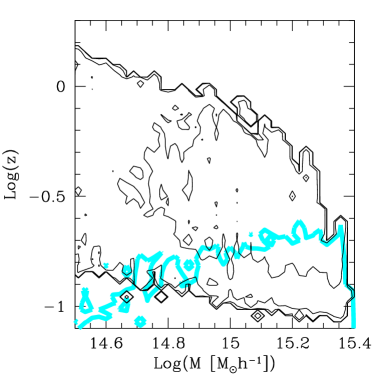
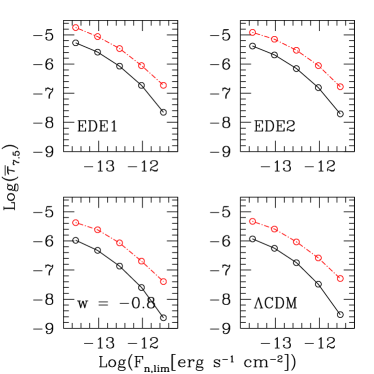
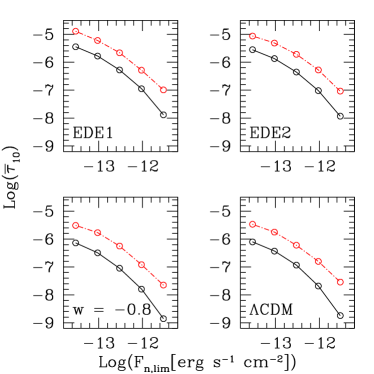
Figure 8 shows the average optical depth for gravitational arcs with length to width ratio and predicted to be observed in a flux-limited X-ray cluster sample as a function of the limiting flux. Results obtained both ignoring and taking account of cluster mergers are shown. As noted in Fedeli & Bartelmann (2007) before, mergers increase the optical depth by a factor between 2 and 3. The present figure shows that this remains true for all flux limits considered here even when X-ray selection effects are taken into account. Moreover, we note that the slope of the relation tends to increase (decrease in absolute value) towards low limiting fluxes. This is due to the fact that the lensing efficiency drops above , and approaches zero towards sufficiently high redshifts. Thus, if the flux limit is low enough, the sample contains all the arcs that are produced and that would be observed without selection effects.
Increasing the length-to-width threshold from to changes the absolute value of the average optical depth, but not its qualitative behaviour as a function of the limiting flux.
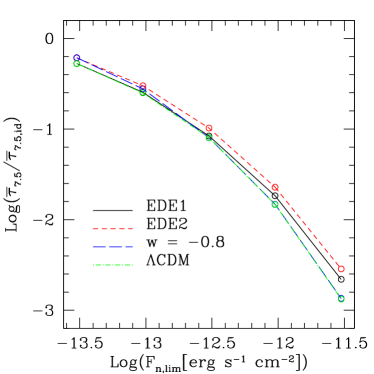
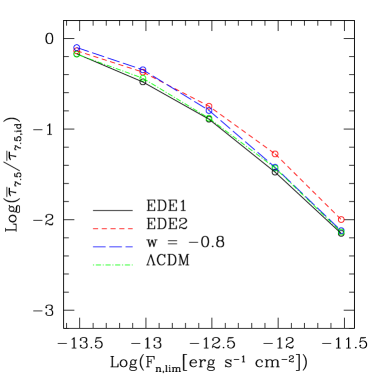
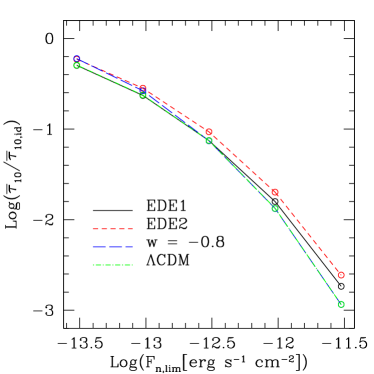
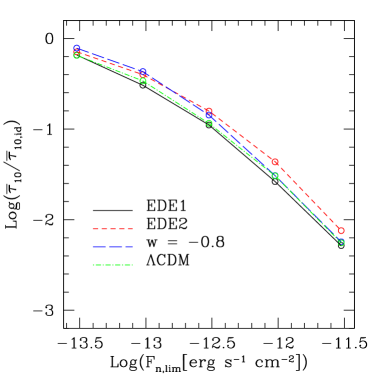
A central result of our study is the ratio between the optical depth for large gravitational arcs in an X-ray selected, flux-limited cluster sample compared to the total, idealised optical depth. Since the average optical depth is related to the number of arcs by a constant factor (determined by the total number density of background sources), this corresponds to the ratio between the number of arcs expected to be seen in a flux-limited sample of X-ray clusters, and the total number of arcs that would be observable in absence of any X-ray selection effect. This ratio is shown in the right and left panels of Fig. 9, accounting for and ignoring the transient merger boosts in temperature, X-ray flux and lensing cross section, respectively.
We note that, when we include mergers, the fraction of the average optical depth in an X-ray selected cluster sample increases with increasing limiting flux. We attribute this to the facts that (i) cluster mergers tend to enhance the lensing efficiency, which affects both the X-ray selected and the total average optical depth, and (ii) cluster mergers also enhance the clusters’ temperature and the X-ray flux, which only affect the X-ray selected optical depth. We also note that there is a slight tendency for models with lower power-spectrum normalisation to have a larger fractional importance for the observed average optical depth. For instance, the ratio between the optical depth of X-ray selected clusters to the total optical depth is systematically slightly larger for the model EDE2 () than for the model EDE1 (). However, this effect is very small.
6 Summary and conclusions
We have studied here the influence of selection effects on the total observed number of gravitational arcs in X-ray selected galaxy-cluster samples, taking cluster mergers into account.
To perform our study, we considered the assembly history of a synthetic sample of galaxy clusters. We linked the virial mass of the dark-matter cluster halo to the temperature of the ICM using the virial relation (7). We then used the analytic fitting formulae provided by Randall et al. (2002) for the boost in temperature caused by merger processes between clusters and substructures during the formation. Afterwards, we used the publicly available software package xspec (Arnaud, 1996) to convert the (boosted and unboosted) temperature of the ICM into the ideal flux (in front of the instrument) produced by each individual object accounting for redshift, metal emission lines and interstellar absorption. Then, using the response matrix of the PSPC detector on-board the Rosat satellite, we transformed the ideal flux in a photon count rate, also including observational effects such as realistic background count rates and PSF convolution. We finally turned the count rates for each object into a nominal flux, as defined in the construction of the ROSAT-ESO Flux Limited X-ray cluster sample Reflex.
We repeated this procedure to the four different cosmological models previously used in Fedeli & Bartelmann (2007) for studying the lensing properties: A CDM model, a dark-energy universe with constant equation-of-state parameter for the dark-energy component, and two early-dark energy models, whose relevance in terms of linear and nonlinear structure formation has recently been pointed out.
As an intermediate, qualitative result, we analysed the total number of clusters expected to be visible in X-ray selected cluster samples as a function of the nominal flux limit. We obtain a significant difference between cosmologies with early-dark energy and the model with constant equation-of-state parameter, and also a significant difference due to the introduction of the effect of cluster mergers. In particular, we find that the qualitative redshift distribution of clusters observed in the Reflex sample can only be reproduced accounting for merger boosts in temperature and luminosity. Moreover, early dark-energy models seem to overpredict the total number of observed objects, although our results are not precise at the low-mass end of the distribution, which is irrelevant for strong lensing. Thus, our absolute numbers are likely to be an overestimate. This may hint at a potentially very interesting test for early-dark energy in particular, and for the dynamics of quintessence models in general, and certainly warrants further investigation in the future.
Finally, our main results are determined by the combination of the nominal X-ray flux selection with the observed strong-lensing statistics. We find that cluster mergers enhance the average observed optical depth by factors between 2 and 3 for all limiting fluxes considered here. We also confirm the result Fedeli & Bartelmann (2007) obtained ignoring any X-ray selection effects, that the different structure-formation history in early-dark energy models causes the lensing efficiency to increase by a factor of compared to models with constant equation-of-state parameter for the dark energy. This remains true for all limiting fluxes, and we see that, for instance, the same lensing efficiency reached in a CDM model with the help of cluster mergers is reached ignoring mergers in models with early-dark energy, because of the higher cluster density at moderate and high redshifts. Moreover, the slope of the relation tends to flatten towards lower limiting fluxes, indicating that we are approaching the total average optical depth.
In an earlier study, Meneghetti et al. (2005) addressed the difference between the total strong-lensing optical depths of cluster populations in cosmological models with different types of dark energy, finding that dynamical dark energy tends to increase the optical depth for giant arcs compared to the standard CDM. While this seems to be a generic prediction for dark-energy models, they used numerical simulations ignoring X-ray selection effects, while we semi-analytically model the cluster population, its lensing properties and selection issues. We extend our method to models with an early dark-energy contribution.
We also find that the ratio of the flux-limited to the total average optical depth is larger when we consider the effect of cluster mergers than when we ignore it. This is due to the fact that the increment in the lensing efficiency affects both the flux limited and the ideal optical depth, while the boost in temperature and luminosity affects only the former.
We carried out these calculations for gravitational arcs with length-to-width ratios and . We find an (expected) difference in the absolute value of the average optical depth, while the trend with the limiting X-ray flux is qualitatively unchanged.
Predicting the number of long and thin gravitational arcs to be observed in X-ray selected cluster samples and in different cosmological models will be very useful in the near future. Forthcoming strong lensing surveys (Cabanac et al., 2007) and the development of automatic detection algorithms for strong lensing features (Lenzen et al., 2004; Horesh et al., 2005; Seidel & Bartelmann, 2006) will allow to place further constraints on the dynamics of structure formation in a universe dominated by dark energy.
Acknowledgements
We are indebted to E. Puchwein, E. Rasia and A. Morandi for clarifying many aspects of the xspec software package. Part of the work has been performed under the Project HPC-EUROPA (RII3-CT-2003-506079), with the support of the European Community - Research Infrastructure Action under the FP6 “Structuring the European Research Area” Programme. This work was supported by the Collaborative Research Centre SFB 439 of the Deutsche Forschungsgemeinschaft and by the German Academic Exchange Service (DAAD) under the Vigoni programme. We are grateful to M. Meneghetti and L. Moscardini for their support and collaboration as well as for interesting and fruitful discussions. We also thank the anonymous referee for useful remarks that helped improving the presentation of this work.
References
- Allen & Fabian (1998) Allen, S. W. & Fabian, A. C. 1998, MNRAS, 297, L57
- Arnaud (1996) Arnaud, K. A. 1996, ADASS, 101, 17
- Bartelmann et al. (2006) Bartelmann, M., Doran, M., & Wetterich, C. 2006, A&A, 454, 27B
- Bartelmann & Schneider (2001) Bartelmann, M. & Schneider, P. 2001, Physics Reports, 340, 291
- Bartelmann & Steinmetz (1996) Bartelmann, M. & Steinmetz, M. 1996, MNRAS, 283, 431
- Bartelmann & White (2003) Bartelmann, M. & White, S. 2003, A&A, 407, 845
- Böhringer et al. (2001) Böhringer, H., Schuecker, P., Guzzo, L., & Collins, C. A. e. a. 2001, A&A, 369, 826B
- Bond et al. (1991) Bond, J., Cole, S., Efstathiou, G., & Kaiser, N. 1991, ApJ, 379, 440
- Cabanac et al. (2007) Cabanac, R. A., Alard, C., Dantel-Fort, M., et al. 2007, A&A, 461, 813
- Caldwell et al. (2003) Caldwell, R., Doran, M., Müller, C., Schäfer, G., & Wetterich, C. 2003, ApJL, 591, L75
- Cavaliere & Fusco-Femiano (1976) Cavaliere, A. & Fusco-Femiano, R. 1976, A&A, 49, 137
- Cavaliere & Fusco-Femiano (1978) Cavaliere, A. & Fusco-Femiano, R. 1978, A&A, 70, 677
- Collins et al. (2000) Collins, C. A., Guzzo, L., Böhringer, H., et al. 2000, MNRAS, 319, 939
- Cooray (1999) Cooray, A. R. 1999, A&A, 341, 653
- Dickey & Lockman (1990) Dickey, J. M. & Lockman, F. J. 1990, ARA&A, 28, 215
- Doran et al. (2001a) Doran, M., Lilley, M., Schwindt, J., & Wetterich, C. 2001a, ApJ, 559, 501
- Doran et al. (2001b) Doran, M., Schwindt, J., & Wetterich, C. 2001b, Phys. Rev. D, 64, 123520
- Fedeli & Bartelmann (2007) Fedeli, C. & Bartelmann, M. 2007, A&A, 461, 49
- Fedeli et al. (2006) Fedeli, C., Meneghetti, M., Bartelmann, M., Dolag, K., & Moscardini, L. 2006, A&A, 447, 419
- Ferreira & Joyce (1998) Ferreira, P. & Joyce, M. 1998, PRD, 58, 023503
- Fukazawa et al. (1998) Fukazawa, Y., Makishima, K., Tamura, T., et al. 1998, PASJ, 50, 187
- Hashimoto et al. (2002) Hashimoto, Y., Hasinger, G., Arnaud, M., Rosati, P., & Miyaji, T. 2002, A&A, 381, 841
- Hasinger et al. (1995) Hasinger, G., Boese, G., & Predehl, P. e. a. 1995, MPE/OGIP Calibration Memo CAL/ROS/93-015
- Horesh et al. (2005) Horesh, A., Ofek, E., Maoz, D., et al. 2005, ApJ, 633, 768
- Jones et al. (1998) Jones, L. R., Ebeling, H., Scharf, C., et al. 1998, ApJ, 495, 100
- Lacey & Cole (1993) Lacey, C. & Cole, S. 1993, MNRAS, 262, 627
- Lenzen et al. (2004) Lenzen, F., Schindler, S., & Scherzer, O. 2004, A&A, 416, 391
- Mathiesen & Evrard (2001) Mathiesen, B. F. & Evrard, A. E. 2001, ApJ, 546, 100
- Meneghetti et al. (2005) Meneghetti, M., Bartelmann, M., Dolag, K., et al. 2005, A&A, 442, 413
- Mohr & Evrard (1999) Mohr, J. J. Mathiesen, B. & Evrard, A. E. 1999, ApJ, 517, 627
- Mushotzky & Scharf (1997) Mushotzky, R. F. & Scharf, C. A. 1997, ApJ, 482, L13
- O’Hara et al. (2006) O’Hara, T. B., Mohr, J. J., Bialek, J. J., & Evrard, A. E. 2006, ApJ, 639, 64
- Poole et al. (2007) Poole, G. B., Babul, A., McCarthy, I. G., et al. 2007, ArXiv astro-ph/0701586
- Poole et al. (2006) Poole, G. B., Fardal, M. A., Babul, A., et al. 2006, MNRAS, 373, 881
- Pratt et al. (2006) Pratt, G. W., Arnaud, M., & Pointecouteau, E. 2006, A&A, 446, 429
- Press & Schechter (1974) Press, W. & Schechter, P. 1974, ApJ, 187, 425
- Randall et al. (2002) Randall, S. W., Sarazin, C. L., & Ricker, P. M. 2002, ApJ, 577, 579
- Raymond & Smith (1977) Raymond, J. C. & Smith, B. W. 1977, ApJS, 35, 419
- Reichart et al. (1999) Reichart, D. E., Castander, F. J., & Nichol, R. C. 1999, ApJ, 516, 1
- Reiprich & Böhringer (2002) Reiprich, T. & Böhringer, H. 2002, ApJ, 567, 716
- Ricker et al. (2000) Ricker, P. M., Dodelson, S., & Lamb, D. Q. 2000, ApJ, 536, 122
- Ricker & Sarazin (2001) Ricker, P. M. & Sarazin, C. L. 2001, ApJ, 561, 621
- Riess et al. (2004) Riess, A., Strolger, L.-G., Tonry, J., Casertano, S., et al. 2004, ApJ, 607, 665
- Schindler (1999) Schindler, S. 1999, A&A, 349, 435
- Schuecker et al. (2001) Schuecker, P., Böhringer, H., Guzzo, L., & Collins, C. A. e. a. 2001, A&A, 368, 86S
- Seidel & Bartelmann (2006) Seidel, G. & Bartelmann, M. 2006, ArXiv astro-ph/0607547
- Smail et al. (1995) Smail, I., Hogg, D. W., Yan, L., & Cohen, J. G. 1995, ApJ, 449, L105
- Snowden & Schmitt (1990) Snowden, S. L. & Schmitt, J. H. M. M. 1990, Ap&SS, 171, 207
- Somerville & Kolatt (1999) Somerville, R. S. & Kolatt, T. S. 1999, MNRAS, 305, 1
- Spergel et al. (2003) Spergel, D., Verde, L., Peiris, H., Komatsu, E., et al. 2003, ApJS, 148, 175
- Spergel et al. (2006) Spergel, D. N., Bean, R., Dore’, O., et al. 2006, ArXiv astro-ph/0603449
- Stanek et al. (2006) Stanek, R., Evrard, A. E., Böhringer, H., Schuecker, P., & Nord, B. 2006, ApJ, 648, 956
- Tegmark et al. (2004) Tegmark, M., Strauss, M., Blanton, M., Abazajian, S., et al. 2004, PRD, 69, 103501
- Torri et al. (2004) Torri, E., Meneghetti, M., Bartelmann, M., et al. 2004, MNRAS, 349, 476
- Vikhlinin et al. (1997) Vikhlinin, A., VanSpeybroeck, L., Markevitch, M., Forman, W. R., & Grego, L. 1997, ApJ, 578, L107
- Wetterich (2004) Wetterich, C. 2004, Physics Letters B, 594, 17
- Wu & Mao (1996) Wu, X.-P. & Mao, S. 1996, ApJ, 463, 404