The heating mechanism for the warm/cool dust in powerful, radio-loud AGN
Abstract
The uncertainty surrounding the nature of the heating mechanism for the dust that emits at mid- to far-IR (MFIR) wavelengths in active galaxies limits our understanding of the links between active galactic nuclei (AGN) and galaxy evolution, as well as our ability to interpret the prodigious infrared and sub-mm emission of some of the most distant galaxies in the Universe. Here we report deep Spitzer observations of a complete sample of powerful, intermediate redshift () radio galaxies and quasars. We show that AGN power, as traced by [OIII]5007 emission, is strongly correlated with both the mid-IR (24) and the far-IR (70) luminosities, however, with increased scatter in the 70 correlation. A major cause of this increased scatter is a group of objects that falls above the main correlation and displays evidence for prodigious recent star formation activity at optical wavelengths, along with relatively cool MFIR colours. These results provide evidence that illumination by the AGN is the primary heating mechanism for the dust emitting at both 24 and 70, with starbursts dominating the heating of the cool dust in only 20 – 30% of objects. This implies that powerful AGN are not always accompanied by the type of luminous starbursts that are characteristic of the peak of activity in major gas-rich mergers.
1 Introduction
In hierarchical galaxy evolution scenarios it is predicted that the gas flows associated with the galaxy mergers that build massive galaxies will trigger both starbursts and AGN activity (Kauffmann & Haenelt, 2000; di Matteo et al., 2005). As the mergers proceed, the outflows driven by the AGN eventually become powerful enough to limit both the star formation in the host galaxies and any further growth of the super-massive black holes (di Matteo et al., 2005). In this context, there is clearly an interest in studying the co-evolution of AGN and their host galaxies. However, from an observational perspective, separating those features of galaxies that are associated with AGN, from those that are associated with star formation activity, has often proved problematic. For example, deep surveys at sub-mm wavelengths have been successful at detecting the redshifted far-IR emission from cool dust components in high redshift galaxies that show evidence for AGN activity at X-ray (Alexander et al., 2005), optical (Priddey et al., 2003) and radio (Archibald et al., 2003; Willott et al., 2002) wavelengths, but the interpretation of these results in terms of star formation activity remains controversial because of uncertainties surrounding the heating mechanism for the cool dust (e.g. Willott et al. 2002).
Although it is generally accepted that the warm dust emitting the mid-IR (3 – 30m) continuum is situated relatively close to the AGN and heated by direct AGN illumination (Pier & Krolik, 1992; van Bemmel & Dullemond, 2003; Rowan-Robinson, 1995), the heating mechanism for the cooler, far-IR (30 – 150m) emitting dust is less certain because the distribution of the cool dust is unknown. There is plenty of observational evidence that starbursts can produce prodigious far-IR and sub-mm radiation. However, it is also possible to model the far-IR spectral energy distributions (SEDs) solely in terms of AGN heating, provided that sufficient AGN energy is allowed to escape to relatively large radii in order to heat a significant mass of dust to the requisite cool temperatures (Nenkova et al., 2002; van Bemmel & Dullemond, 2003).
A promising alternative to SED modelling is to use a statistical approach: correlating the MFIR continuum properties with information about the level of both AGN and starburst activity derived from observations at other wavelengths. However, this approach has been hampered in the past by the low sensitivity of the available far- IR satellites, and the well-known biases that can occur in luminosity-luminosity plots of incomplete flux-limited samples. For example, the Infrared Astronomical Satellite (IRAS) detected fewer than 30% of powerful 3C radio galaxies at MFIR wavelengths (Impey & Gregorini, 1993; Heckman et al., 1994), and the detection rate did not improve substantially in observations made by the Infrared Space Observatory (ISO). Therefore, while some previous studies hinted at correlations between AGN and MFIR activity (Impey & Gregorini, 1993; Heckman et al., 1994; Hes et al., 1995; Haas et al., 2003), none were definitive because of the incompleteness of the detections at far-IR wavelengths. Moreover, based on IRAS results, it was noted that some of the radio-loud AGN with the most luminous far-IR emission are associated with prodigious recent star formation activity detected at optical wavelengths, thus supporting the alternative starburst heating mechanism (Hes et al., 1995; Tadhunter et al., 2002; Wills et al., 2002, 2004).
The launch of the Spitzer Space Telescope (Werner et al., 2004), with its orders of magnitude improved sensitivity at MFIR wavelengths compared with previous satellites, has substantially enhanced our ability to make statistical studies of complete samples of distant AGN. In this paper we report results from a deep survey with the Spitzer MIPS instrument (Rieke et al., 2004) of a complete sample of intermediate redshift radio galaxies. These results have a direct bearing on our understanding of the dominant heating mechanism(s) for the warm/cool dust in AGN.
2 Sample Selection and Observations
Our sample comprises all radio galaxies and steep-spectrum radio quasars with intermediate redshifts () from the sample of southern 2Jy radio sources ( Jy) described in Tadhunter et al. (1993), with the addition of PKS0345+07 which has since proved to fulfill the same selection criteria (di Serego-Alighieri et al., 2004). This 2Jy sample (47 objects in total) is unique in the sense that deep optical spectra exist for all the sample objects which can be used to derive accurate emission line luminosities (Tadhunter et al., 1993, 1998), and search for signs of optical starburst activity (Tadhunter et al., 2002; Wills et al., 2004).
For the majority of objects in the sample (42) we made deep Spitzer observations with the MIPS instrument at 24 and 70m as part of a programme dedicated to understanding the dust heating mechanism, with typical exposure times of 92 – 180s at 24m and 231 – 545s at 70m (depending on the brighteness). For 4 further objects we used MIPS observations already present in the Spitzer archive, and for the remaining object — PKS1549-79 — we used 25 and 60m flux measurements obtained by IRAS. The Spitzer data were reduced using the MOPEX software package, with additional median filtering performed using contributed software. Flux measurements were made using the aperture photometry option in the Starlink Gaia package, with typical aperture sizes of 12 – 30 arcseconds and 25 – 50 arcseconds at 24m and 70m respectively. In all cases appropriate corrections for aperture losses were made using empirically-determined curves of growth determined from measurements of the brighter sources in our sample. Our Spitzer observations detect 100% of the sample at 24m and 89% of the sample at 70m. Typical flux uncertainties range from 30% in the case of the faintest sources in our sample, to 10 – 20% for the brightest. A more detailed presentation of the data and results will be made in a forthcoming paper (Dicken et al., in preparation).
The continuum fluxes were converted to luminosities using km s-1 Mpc-1, and , along with spectral indices derived from the measured F(70)/F(24) flux ratios.
3 Results
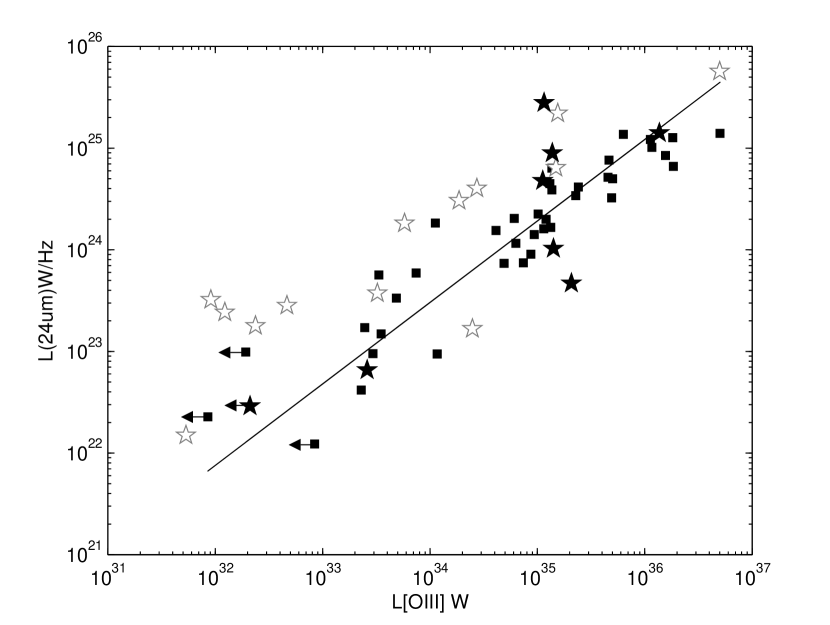
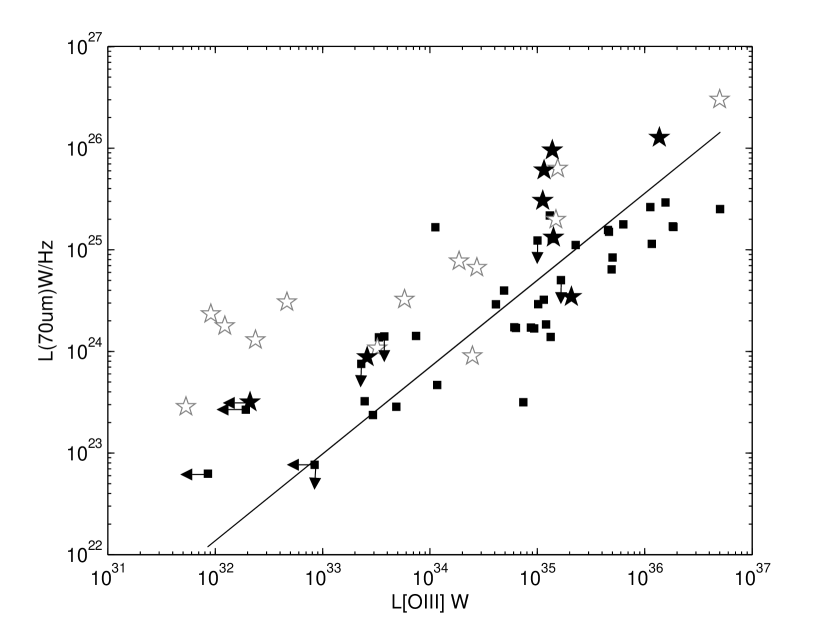
Previous studies have correlated the MFIR properties with the radio luminosities, which are related to the mechanical powers of the relativistic jet components (e.g. Hes et al. 1995; Shi et al. 2005). In contrast, we prefer to investigate correlations with the [OIII]5007 emission line luminosities (), which provide a more direct indication of the intrinsic radiative powers of the illuminating AGN (Rawlings & Saunders, 1991; Tadhunter et al., 1998; Simpson, 1998). The main results are shown in Figures 1 and 2, which demonstrate that strong correlations exist between and both the mid-IR (24m) and far-IR (70m) monochromatic luminosities over four orders of magnitude in optical emission line luminosity. Restricting our analysis to redshifts , in order to avoid most of the low luminosity objects in our sample with upper limits on their [OIII] luminosities, a Spearman rank correlation analysis shows that both correlations are highly significant (see Table 1). By fitting straight lines to the correlations in log-log space we find that their power-law slopes are consistent within the uncertainties: and for the full sample (); and and if we exclude the objects with evidence for optical starburst activity (; see below). The uncertainties in the slopes for the correlations have been estimated using a bootstrap re-sampling technique111We used 500 cycles in the bootstrap. In the case of the 70m correlation we handled the four objects with 70m upper limits as follows: for each cycle we generated a 70m luminosity for each of the upper limits by multiplying the measured 24m luminosity by a value for the 70m/24m ratio drawn at random from the distribution of such ratios measured for the sample as a whole. One object in the sample used for the correlation analysis has only an upper limit on its [OIII] luminosity. For this object we used the upper limit, rather than a measured luminosity, in the correlation analysis.
Despite the similarities between the two correlations shown in Figures 1 and 2, the 70m correlation shows a larger scatter (see the final column in Table 1). Part of the reason for this larger scatter becomes clear when the evidence for optical starburst activity is considered. Careful spectral synthesis modelling of high quality optical spectra for the 2Jy sample, taking full account of AGN-related continuum components (see Tadhunter et al. 2002, 2005 for details), has allowed us to identify the objects that show strong evidence for recent starburst activity in their early-type host galaxies (highlighted in Figures 1 and 2 as filled stars). It is clear that these objects — comprising 20% of the full sample — tend to fall above the main correlation in the vs. plot, but lie closer to the main correlation in the vs. plot; the optical starburst objects have their 70m luminosities enhanced by up to an order of magnitude with respect to those without clear signs of star formation activity. We can quantify this difference in terms of the vertical displacements of the points relative to the regression line in Figure 2. Using a Kolmogorov-Smirnoff two sample test to compare the distributions of vertical displacements, we find that we can reject the null hypothesis that the starburst and non-starburst sub-samples are drawn from the same parent distribution at the P=0.005 level of significance (, , one-tailed test). This result is further reinforced if we consider the supplementary sample of all the radio-loud AGN from outside our sample known to show signs of optical star formation activity (open stars in Figures 1 and 2). Note that the presence of significant starburst heating in a subset of our sample is consistent with recent results obtained for radio-quiet quasars based on mid-IR detection of PAH features (Schweizer et al., 2006) and radio continuum data (Barthel, 2006).
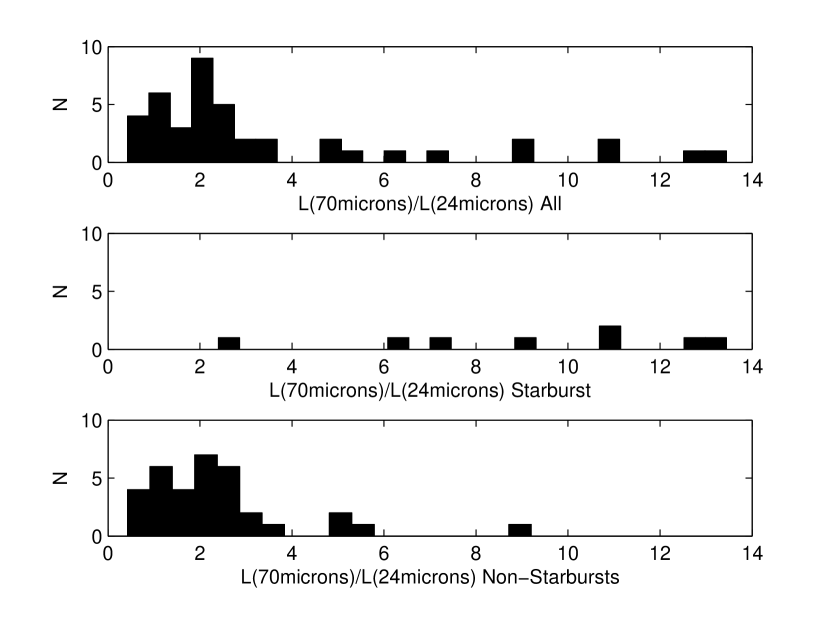
As an alternative to optical continuum properties, the MFIR colors may also be used to investigate whether star formation — in this case heavily obscured star formation — is important in the target galaxies. Figure 3 shows the distribution of F(70)/F(24) colors for the full 2Jy sample, as well as the starburst and non-starburst sub-samples. It is striking that many of the objects with optical star formation activity have relatively “cool” colors () consistent with those of starburst galaxies in general. On the other hand, most of the objects without clearly identified optical star formation activity have warmer colors (); using a two sample Kolmogorov-Smirnoff test we find that this difference is significant at the P=0.005 level (, , one-tailed test). This reinforces the view that the reason for the large scatter in the 70m correlation is a group of objects that have enhanced 70m luminosities due to a contribution from starburst heating.
4 Discussion and conclusions
Given the similarities between Figures 1 and 2, as well as the measured slopes of the correlations, it is likely that the dominant heating mechanism for the dust emitting at both 24m and 70m is AGN illumination, with starburst heating contributing significantly at 70m only in the minority of objects with independent evidence for recent star formation activity. However, there is also evidence for a loose correlation between starburst and AGN activity, in the sense that the most luminous starbursts ( W Hz-1) are only found in the objects with the most powerful AGN activity ( W).
It also is notable that slopes determined for the main correlations shown in Figures 1 and 2 are in good agreement with the predictions of simple AGN illumination models involving photoionization of optically thick clouds (: Tadhunter et al. 1998), provided that the relative covering factors of narrow emission line region (), the mid-IR emitting dust structure (), and the far-IR emitting dust structure () do not change substantially with luminosity. In this context it is interesting to consider whether AGN illumination is energetically feasible. We find that, in order to explain the normalisations of the main correlations apparent in Figures 1 and 2, we require and 222For the purposes of this calculation we make the following assumptions: case B recombination for an electron temperature of K; and a mean ionizing photon energy of eV (see Robinson et al. 1987); and a ratio of ionizing luminosity to bolometric luminosity of (see Elvis et al. 2004). The mid-IR and far-IR luminosities have been integrated over the wavelength ranges 3 – 30m and 30 – 100m respectively assuming a spectral index of (), estimated from the mean F(70)/F(24) flux ratio for the sample as a whole. Note that no assumptions have been made about the detailed radial distribition of dust. We simply assume that the dust is distributed in such way that it produces the observed MFIR SEDs by AGN illumination.. This implies that the MFIR emitting dust structures cover a substantially larger fraction of the sky than the narrow emission line region (NLR). Given that the covering factor of the NLR is typically a few percent, the dust structures are likely to cover 20 – 70% of the sky as seen by the AGN. This is entirely feasible if the dust is associated with the central obscuring tori required by the unified schemes for powerful radio sources (Barthel, 1989), or with the kpc-scale dust lanes visible in high resolution images of some radio galaxies (de Koff et al., 2000).
On the basis of our results it is clear that powerful, radio-loud AGN are not always accompanied by major contemporaneous starburst episodes: considering both the MFIR colours and the optical continuum spectra we estimate that the proportion of radio galaxies in our sample with significant recent starburst activity (optically obscured or otherwise) falls in the range 20 – 30%. We hypothesise that the presence of a major starburst component, as revealed by enhanced 70m emission, is related to the mode of triggering of the AGN and radio jets. For example, it is plausible that the radio galaxies with starburst components are triggered relatively close to the peak of starburst activity in major, gas-rich galaxy mergers, whereas those lacking significant starbursts are triggered later in the merger sequence (e.g. Tadhunter et al. 2005), by relatively minor accretion events, or by cooling flows (Bremer et al., 1997). This would be consistent with the observed morphological and kinematical diversity of the population of powerful radio galaxies (Heckman et al. 1986; Tadhunter, Fosbury & Quinn 1989; Baum, Heckman & van Breugel 1992). It will be possible to test these ideas in future by using deep optical imaging observations to relate the interaction status and environments of the host galaxies to the MFIR properties revealed by Spitzer.
References
- Alexander et al. (2005) Alexander, D.M., Smail, I., Bauer, F.E., Chapman, S.C., Blain, A.W., Brandt, W.N., 2005, Nat, 434, 738
- Archibald et al. (2003) Archibald, E.N., Dunlop, J.S., Hughes, D.H., Rawlings, S., Eales, S.A., Ivison, R.J., 2001, MNRAS, 323, 417
- Barthel (1989) Barthel, P.D., 1989, ApJ, 336, 606
- Barthel (2006) Barthel, P.D., 2006, A&A, 458, 107
- Bremer et al. (1997) Bremer, M., Fabian, A.C., Crawford, C.S., 1997, MNRAS, 284, 213
- Baum et al. (1992) Baum, S.A., Heckman, T.M., van Breugel, W., 1992, ApJ, 389, 208
- de Koff et al. (2000) de Koff, S., Best, P.. Baum, S.A., Sparks, W., Rottgering, H., Miley, G., Golombek, G., Macchetto, F., Martel, 2000, ApJS, 129, 33
- di Matteo et al. (2005) di Matteo, T., Springel, V., Hernquist, L., 2005, Nat, 433, 604
- di Serego-Alighieri et al. (2004) di Serego-Alighieri, S., Danziger, I.J., Morganti, R., Tadhunter, C.N., 1994, MNRAS, 269, 998
- Elvis et al. (1994) Elvis, M., Wilkes, B.J., McDowell, J.C., Green, R.F., Bechtold, J., Willner, S.P., Oey, M.S., Polomski, E., Cutri, R., 1994, ApJS, 95,1
- Haas et al. (2003) Haas, M., et al., 2003, A&A, 402, 87
- Heckman et al. (1994) Heckman, T.M., O’Dea, C.P., Baum, S.A., Laurikainen, E., 1994, ApJ, 428, 65
- Heckman et al. (1986) Heckman, T.M., Smith, E.P., Baum, S.A., van Breugel, W.J.M., Miley, G.K., Illingworth, G.D., Bothun, G.D., Balick, B., 1986, ApJ, 311, 526
- Hes et al. (1995) Hes, R., Barthel, P.D., Hoekstra, H., 1995, A&A, 303, 8
- Impey & Gregorini (1993) Impey, C., Gregorini, C., 1993, AJ, 105, 853
- Kauffmann & Haenelt (2000) Kauffmann, G., Haenelt, H., 2000, MNRAS, 311, 576
- Nenkova et al. (2002) Nenkova, M., Ivezic, Z., Elitzur, M., 2002, ApJ, 570, L9
- Pier & Krolik (1992) Pier, E., Krolik, J.H., 1992, ApJ, 401, 99
- Priddey et al. (2003) Priddey, R.S., Isaak, K.G., McMahon, R.G., Omont, A., 2003, MNRAS, 339, 118
- Rawlings & Saunders (1991) Rawlings, S., Saunders, R., 1991, Nat, 349, 138
- Rieke et al. (2004) Rieke, G.H., et al., 2004, ApJS, 154, 25
- Robinson et al. (1987) Robinson, A., Binette, L., Fosbury, R.A.E., Tadhunter, C.N., 1987, MNRAS, 227, 97
- Rowan-Robinson (1995) Rowan-Robinson, M., 1995, MNRAS, 272, 737
- Schweizer et al. (2006) Schweizer, M., et al., 2006, ApJ, 649, 79
- Shi et al. (2005) Shi, Y., Rieke, G.H., Hines, D.C., Neugebauer, G., Blaylock, M., Rigby, J., Egami, E., Gordon, K.D., Alonso-Herrero, A., 2005, ApJ, 629, 88
- Simpson (1998) Simpson, C., 1998, MNRAS, 297, L39
- Tadhunter et al. (1989) Tadhunter, C.N., Fosbury, R.A.E., Quinn, P.J., 1989, MNRAS, 240, 225
- Tadhunter et al. (1993) Tadhunter, C.N., Morganti, R., di Serego Alighieri, S., Fosbury, R.A.E., Danziger, I.J., 1993, MNRAS, 263
- Tadhunter et al. (1998) Tadhunter, C.N., Morganti, R., Robinson, A., Dickson, R., Villar-Martin, M., Fosbury, R.A.E., 1998, MNRAS, 298, 1035
- Tadhunter et al. (2002) Tadhunter, C., Dickson, R., Morganti, R., Robinson, T.G., Wills, K., Villar- Martin, M., Hughes, M., 2002, MNRAS, 330, 977
- Tadhunter et al. (2005) Tadhunter, C., Robinson, T.G., Gonzalez Delgado, R.M., Wills, K., Morganti, R., 2005, MNRAS, 356, 480
- van Bemmel & Dullemond (2003) van Bemmel, I.M., Dullemond. C.P., 2003, A&A, 404, 1
- Werner et al. (2004) Werner, M.W., et al., 2004, ApJS, 154, 1
- Willott et al. (2002) Willott, C.J., Rawlings, S., Archibald, E.N., Dunlop, J.S., 2002 MNRAS, 331, 435
- Wills et al. (2002) Wills, K.A., Tadhunter, C.N., Robinson, T.G., Morganti, R., 2002, MNRAS, 333, 211
- Wills et al. (2004) Wills, K.A., Morganti, R., Tadhunter, C.N., Robinson, T.G., Villar-Martin, M., 2004, MNRAS, 347, 771
| Correlation | N | P | Scatter (dex) | |
|---|---|---|---|---|
| Including starburst objects: | ||||
| P24 vs. L[OIII] | 39 | 0.83 | 0.0005 | 0.40 |
| P70 vs. L[OIII] | 39 | 0.67 | 0.0005 | 0.57 |
| Without starburst objects: | ||||
| P24 vs. L[OIII] | 32 | 0.85 | 0.0005 | 0.34 |
| P70 vs. L[OIII] | 32 | 0.77 | 0.0005 | 0.51 |