On the Nature of Velocity Fields in High Galaxies
Abstract
We analyze the gas kinematics of damped Ly systems (DLAs) hosting high gamma-ray bursts (GRBs) and those toward quasars (QSO-DLAs) focusing on three statistics: (1) , the velocity interval encompassing 90 of the total optical depth, (2,3) and , the rest equivalent widths of the Si II 1526 and C IV 1548 transitions. The distributions of the GRB-DLAs and QSO-DLAs are similar, each has median and a significant tail to several hundred km s-1. This suggests comparable galaxy masses for the parent populations of GRB-DLAs and QSO-DLAs and we infer the average dark matter halo mass of GRB galaxies is . The unique configuration of GRB-DLA sightlines and the presence (and absence) of fine-structure absorption together give special insight into the nature of high , protogalactic velocity fields. The data support a scenario where the statistic reflects dynamics in the interstellar medium (ISM) and traces motions outside the ISM (e.g. halo gas, galactic-scale winds). The statistic and gas metallicity [M/H] are tightly correlated, especially for the QSO-DLAs: [M/H] = with and . We argue that the statistic primarily tracks dynamical motions in the halos of high galaxies and interpret this correlation as a mass-metallicity relation with very similar slope to the trend observed in local, low-metallicity galaxies. Finally, the GRB-DLAs exhibit systematically larger values (Å) than the QSO-DLAs (Å) which may suggest galactic-scale outflows contribute to the largest observed velocity fields.
Subject headings:
quasars : absorption lines1. Introduction
Absorption-line spectra of quasars have revealed thousands of high redshift galaxies to date (e.g. Wolfe et al., 1986; Steidel & Sargent, 1992; Prochaska, Herbert-Fort & Wolfe, 2005; Prochter, Prochaska & Burles, 2006). At , these galaxies are termed the damped Ly systems (DLAs), absorbers with H I column density . Although a direct association between star forming galaxies and DLAs is difficult to establish because the background quasar blinds our view (Møller et al., 2002), the large values of DLAs indicate large dark matter overdensities (i.e. a virialized system). Furthermore, all of the DLAs show substantial enrichment from heavy metals (Pettini et al., 1994; Prochaska et al., 2003) and roughly half show indications of ongoing star formation through the presence of C II∗ absorption (Wolfe, Prochaska & Gawiser, 2003). Finally, stars form from neutral gas and the DLAs dominate the atomic hydrogen reservoir at all redshifts (Wolfe et al., 1995; Prochaska, Herbert-Fort & Wolfe, 2005; Rao, Turnshek & Nestor, 2006).
High resolution spectroscopy of DLAs yield precise measurements of the column densities of resonance-line transitions in the ISM of high galaxies (Wolfe, Gawiser & Prochaska, 2005). Aside from gas-phase abundances, however, it is difficult to derive physical quantities from these observations (e.g. temperature, density). The only other physical characteristic easily studied is the gas kinematics. High-resolution spectra resolve the line profiles of these transitions into ‘clouds’ which trace the velocity fields in young, high galaxies (Prochaska & Wolfe, 1997, 1998). Although it is difficult to reveal the nature of these velocity fields (e.g. rotation, outflows, turbulence) with individual 1-dimensional sightlines, the distributions of kinematic characteristics provide powerful tests for scenarios of galaxy formation (e.g. Jedamzik & Prochaska, 1998; Haehnelt, Steinmetz & Rauch, 1998).
Prochaska & Wolfe (1997) performed a survey of the kinematic characteristics of neutral gas in DLAs and compared their observations against a variety of simple scenarios. These included rotating disks, clouds with random (virialized) motions, and galactic infall. Observed asymmetries in the observed line-profiles favor rotational dynamics, yet the observed distribution of velocity widths () has a median too large to be accommodated within standard cold dark matter cosmology. As such, Prochaska & Wolfe (1997) presented these observations as a direct challenge to the basic picture of galaxy formation in a hierarchical universe (e.g. Kauffmann, 1996; Mo, Mao & White, 1998). In response, theorists introduced additional velocity fields to explain the observations (Haehnelt, Steinmetz & Rauch, 1998; McDonald & Miralda-Escudé, 1999; Nulsen, Barcons & Fabian, 1998; Maller et al., 2001). Of particular interest was a model of merging protogalactic clumps where the observed kinematics include contributions from rotation, infall, and random motions (Haehnelt, Steinmetz & Rauch, 1998). While the initial work established this model as a potential solution, recent evaluations using modern numerical simulations and more accurate treatments of radiative transfer have not confirmed its viability (Prochaska & Wolfe, 2001; Razoumov et al., 2006). The research on kinematic characteristics in DLAs toward quasars (hereafter QSO-DLAs), therefore, tests theories of galaxy formation and gas dynamics in the early universe.
Motivated by these results, we have investigated the dynamics of gas probed by the sightlines to the afterglows of gamma-ray bursts (GRBs). Similar to quasars, the afterglows of GRBs provide bright, albeit transient point-source beacons to the outer universe. With follow-up spectroscopy, one can acquire data at comparable signal-to-noise (S/N) and spectral resolution as quasars (Vreeswijk et al., 2004; Fiore et al., 2005; Chen et al., 2005; Prochaska et al., 2007). In turn, one can study the velocity fields of the gas close to the observed beacon. The sightline presumably intersects gas in the star forming region encompassing the GRB, the neutral ISM surrounding it, and gas external to the neutral ISM.
In this paper, we examine the kinematics of a modest sample of damped Ly systems associated with the ISM surrounding gamma-ray bursts (GRB-DLAs). A principal goal is to characterize the velocity fields of gas observed along these unique sightlines. The data trace velocity fields generated by galactic rotation, gravitational accretion, and any galactic or stellar feedback processes. We will find that these observations reveal new insight for interpretations of the kinematics of gas observed in quasar absorption line studies. Furthermore, we will present a comparison of the GRB-DLA results with those from QSO-DLAs. Comparisons between GRB-DLAs and QSO-DLAs assess the relative galaxy masses and the nature of velocity fields in young, star-forming galaxies.
This paper is organized as follows. Section 2 presents the observational samples and describes the experiment. In 3, we define statistics for assessing the gas kinematics. 4 presents the principal results of our analysis and we discuss and interpret these results in 5.
2. Observational Data
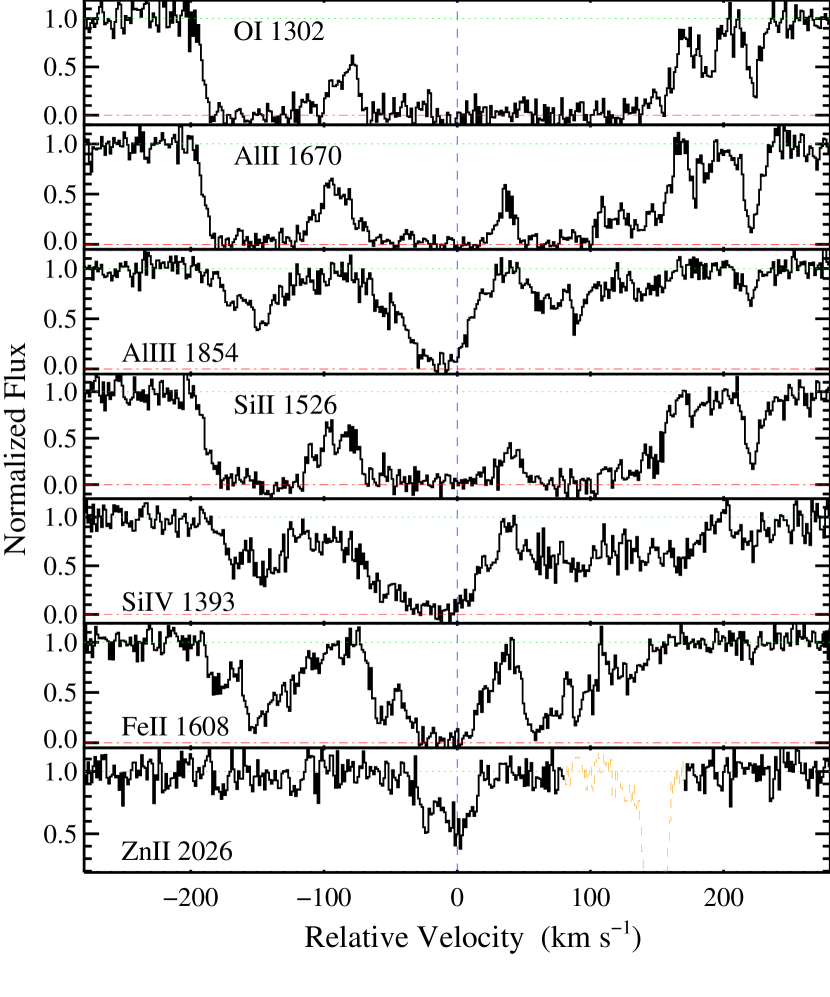
We have defined a sample of GRB-DLAs for kinematic analysis based on two primary criteria: (i) the presence of a damped Ly system () or a low-ion column density that requires exceed assuming solar metallicity; (ii) spectra with sufficient signal-to-noise and resolution to study the gas kinematics. The latter criterion is not especially strict because we will examine the gas kinematics from equivalent width measurements which do not require high spectral resolution. The sample is also limited to GRB-DLAs where we could access the data or where precise equivalent width measurements are reported in the literature. Figure 1 shows an example set of line-profiles for the GRB-DLA associated with GRB 050820 (Prochaska et al., 2007). These data were acquired with the HIRES spectrometer on the Keck telescope and have high spectral resolution . The weaker transitions such as Zn II 2026 indicate that the majority (90%) of the gas is localized to one or two ‘clouds’ within a velocity interval of . In contrast, the stronger transitions are typically saturated and show absorption spanning nearly 400 km s-1. In the following section, we introduce two kinematic statistics to characterize these properties. Table 2 lists the GRB-DLA comprising our sample, describes the spectral observations, and lists the values and metallicities as described in Prochaska, Chen & Bloom (2007).
| GRB | RA | DEC | log | f | [M/H] | Instrument | Ref | |||
|---|---|---|---|---|---|---|---|---|---|---|
| GRB990123 | 15:25:30.34 | +44:45:59.1 | 1.600 | 12 | Keck/LRIS | 1,000 | 1 | |||
| GRB000926 | 17:04:09.00 | +51:47:10.0 | 2.038 | 2 | 0.29 | Keck/ESI | 5,000 | 2 | ||
| GRB010222 | 14:52:12.55 | +43:01:06.2 | 1.477 | 12 | Keck/ESI | 5,000 | 3 | |||
| GRB011211 | 11:15:17.98 | -21:56:56.2 | 2.142 | 11 | VLT/FORS2 | 1,000 | 1,4 | |||
| GRB020813 | 19:46:41.87 | -19:36:04.8 | 1.255 | 12 | Keck/LRIS | 1,000 | 5 | |||
| GRB030226 | 11:33:04.93 | +25:53:55.3 | 1.987 | 11 | Keck/ESI | 5,000 | 6 | |||
| GRB030323 | 11:06:09.40 | -21:46:13.2 | 3.372 | 12 | VLT/FORS2 | 1,000 | 7 | |||
| GRB050401 | 16:31:28.82 | +02:11:14.8 | 2.899 | 12 | VLT/FORS2 | 1,000 | 8 | |||
| GRB050505 | 09:27:03.20 | +30:16:21.5 | 4.275 | 11 | Keck/LRIS | 1,000 | 9 | |||
| GRB050730 | 14:08:17.14 | -03:46:17.8 | 3.969 | 4 | 0.14 | Magellan/MIKE | 30,000 | 10 | ||
| GRB050820 | 22:29:38.11 | +19:33:37.1 | 2.615 | 4 | 0.11 | Keck/HIRES | 30,000 | 11 | ||
| GRB050904 | 00:54:50.79 | +14:05:09.4 | 6.296 | 11 | Subaru/FOCAS | 1,000 | 12 | |||
| GRB050922C | 19:55:54.48 | -08:45:27.5 | 2.199 | 4 | 0.14 | VLT/UVES | 30,000 | 13 | ||
| GRB051111 | 00:08:17.14 | -00:46:17.8 | 1.549 | 12 | Keck/HIRES | 30,000 | 14,11 | |||
| GRB060206 | 13:31:43.42 | +35:03:03.6 | 4.048 | 4 | 0.18 | WHT/ISIS | 4,000 | 15 | ||
| GRB060418 | 15:45:42.40 | -03:38:22.80 | 1.490 | 2 | 1.00 | Magellan/MIKE | 30,000 | 11 |
References. — 1: Savaglio, Fall & Fiore (2003); 2: Castro et al. (2003); 3: Mirabal et al. (2002); 4: Vreeswijk et al. (2006); 5: Barth et al. (2003); 6: Shin et al. (2006); 7: Vreeswijk et al. (2004); 8: Watson et al. (2006); 9: Berger et al. (2006); 10: Chen et al. (2005); 11: Prochaska et al. (2007); 12: Kawai et al. (2006); 13: Piranomonte et al. (2007); 14: Prochaska, Chen & Bloom (2006); 15: Fynbo et al. (2006)
Our analysis will frequently draw comparisons between GRB-DLA measurements and QSO-DLA values. For the latter, we will consider two samples of QSO-DLAs, one a subset of the other. The complete sample is drawn from echelle and echellette observations of quasars acquired with the HIRES (Vogt et al., 1994) and ESI (Sheinis et al., 2000) spectrometers at the Keck Observatory and the UVES (Dekker et al., 2000) spectrometer at the VLT Observatory. The data are summarized in these papers: Herbert-Fort et al. (2006); Ledoux et al. (2006); Dessauges-Zavadsky et al. (2006); Prochaska et al. (2007). We will restrict the samples to and DLAs which are greater than from their background quasar. The full dataset is a heterogeneous sample of QSO-DLAs including systems selected on the basis of strong metal-lines (Herbert-Fort et al., 2006) or targeted for H2 absorption (Ledoux, Petitjean & Srianand, 2003). As such, Prochaska et al. (2007) have noted that the H I distribution of this full sample does not follow the statistical distribution111The QSO-DLAs observed at high spectral resolution have systematically fewer systems with , presumably because the observers wished to avoid including absorbers right at the threshold. derived from a random survey of background quasars (e.g. Prochaska, Herbert-Fort & Wolfe, 2005). Therefore, we define a pseudo-statistical sample of QSO-DLAs by restricting the list to the QSO-DLAs compiled by Prochaska et al. (2003). Although the DLA in this subset also do not follow the distribution of a random sample, they were selected only on the basis of a large H I column density, i.e. independent of any kinematic characteristic or chemical abundance.
We have analyzed the kinematic properties from our own HIRES and ESI observations and supplemented these measurements with the results presented in Ledoux et al. (2006) from UVES data acquired with the VLT. For equivalent width measurements, however, we have derived values only from our HIRES and ESI observations (Prochaska et al., 2007; Herbert-Fort et al., 2006). These values have typical statistical uncertainties of less than 0.02Å.
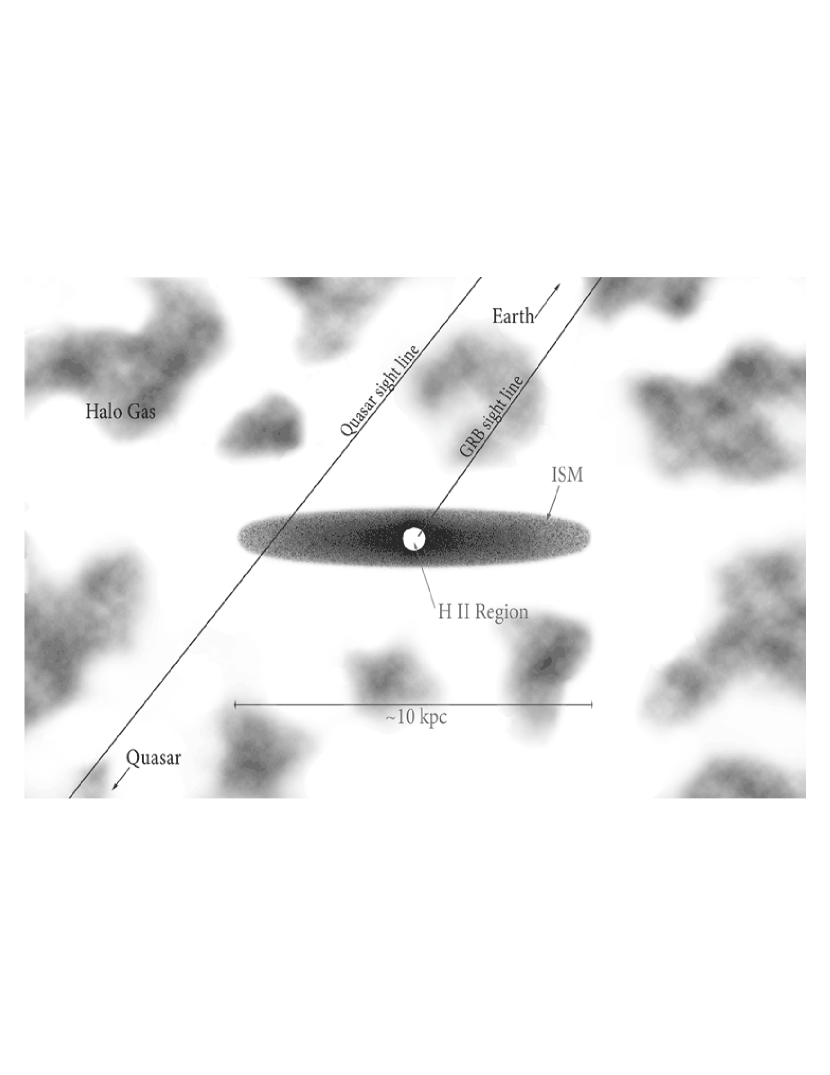
In a previous paper (Prochaska, Chen & Bloom, 2007), we discussed why the parent populations of galaxies hosting QSO-DLAs and GRB-DLAs may be different (e.g. gas cross-section selected versus current SFR selected) and how the sightline configurations are fundamentally distinct. The GRB-DLAs do exhibit larger , metallicity, /Fe, and depletion levels than QSO-DLAs (Prochaska, Chen & Bloom, 2007), but we argued that the differences do not require distinct parent populations of galaxies. Instead, the observations imply sightlines with smaller average impact parameter through high galaxies. This conclusion is expected for a sample selected by gas cross-section (QSO-DLA) versus ones restricted to originate in star-forming regions (GRB-DLA). The cartoon in Figure 2 illustrates these ideas. While QSO-DLAs preferentially penetrate the outer regions of the ISM, the GRB-DLA sightlines originate within their host galaxies, presumably within an H II region generated by its progenitor and other O and B stars. This has two key implications for the gas kinematics: (i) the GRB-DLA observations will probe only a fraction of the velocity field along the full sightline; (ii) each GRB-DLA sightline is biased to intersect its own star forming region. We expect these regions to have very small cross-section to QSO-DLA sightlines (Zwaan & Prochaska, 2006) and to be rarely probed by such samples. In this respect, GRB-DLAs may open a new window into the velocity fields of high galaxies (c.f. Pettini et al., 2001).
3. Kinematic Diagnostics
With high resolution observations, one resolves the absorption-line profiles of unsaturated transitions into individual components, frequently termed ‘clouds’. The clouds in QSO-DLAs have typical Doppler widths of (e.g. Dessauges-Zavadsky et al., 2006). The dispersion results from macroscopic motions (e.g. turbulence) not thermal broadening; the latter imply temperatures that would collisionally ionize the gas. The GRB-DLAs show clouds with similar characteristics that comprise the observed line-profiles (Figure 1; Fiore et al., 2005; Chen et al., 2005; Prochaska et al., 2007).
One can characterize the velocity field along the sightline by tracing the motions of these clouds. Presently, we do not have measurements of the systemic redshifts for our sample of GRB host galaxies (e.g. via nebular lines). Therefore, we will primarily discuss relative velocities. Standard practice is to define a velocity width as the interval which encompasses 90 of the total optical depth of the gas. This definition was introduced in part to limit a single, weak cloud or statistical fluctuations from dominating the statistic (Prochaska & Wolfe, 1997). Following the approach for QSO-DLAs (Prochaska & Wolfe, 1997, 1998, 2001; Ledoux et al., 2006), we measure the statistic from a single, unsaturated low-ion transition222Note that is insensitive to the specific transition analyzed provided the line is unsaturated and is associated with a low-ion (Prochaska & Wolfe, 1997). which, ideally, has relatively high S/N. For the QSO-DLA we demand S/N but have relaxed this requirement for the GRB-DLA because of the generally poorer data quality. To resolve the optical-depth profile, however, it is necessary to restrict the sample to echelle or echellette observations. As an example of the procedure, consider the line-profiles in Figure 1 where we measure using the Zn II transition. Table 2 summarizes the measurements for the full GRB-DLA sample.
| GRB | W1526 | ||||
|---|---|---|---|---|---|
| (Å) | (km s-1) | (Å) | (Å) | ||
| GRB000926 | 2026.136 | 280 | |||
| GRB010222 | 2056.254 | 100 | |||
| GRB011211 | |||||
| GRB020813 | 2260.780 | 210 | |||
| GRB030226 | 2374.461 | 340a | |||
| GRB030323 | |||||
| GRB050401 | |||||
| GRB050505 | |||||
| GRB050730 | 1741.553 | 25 | |||
| GRB050820 | 2026.136 | 55 | |||
| GRB050922C | 1608.451 | 89 | |||
| GRB051111 | 2249.877 | 31 | |||
| GRB060418 | 2576.877 | 57 |
Note. — All EW values reported are rest-frame equivalent widths.
We also introduce a complimentary diagnostic of gas kinematics: the rest equivalent width . This quantity has kinematic significance for optically thick (i.e. saturated) transitions. In these cases, the equivalent width is most sensitive to the differential motions of individual clouds as opposed to their column densities. In contrast to , the value represents the velocity field of greater than of the gas and can be dominated by clouds with relatively low column density (e.g. Bouché et al., 2007). We emphasize that the value should only be sensitive to the metallicity and/or value of the sightline at very low values, i.e. when the transition is not saturated. Below, we demonstrate that and are correlated but with large scatter.
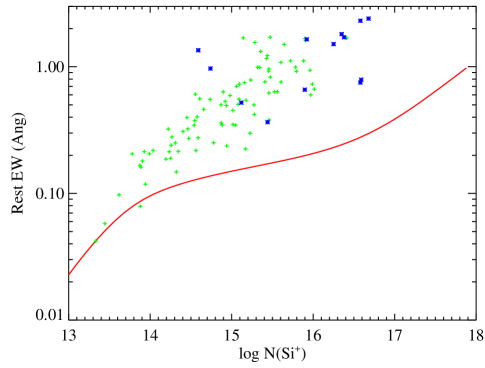
We have measured rest equivalent widths from the Si II transition () for low-ion gas and the C IV 1548 transition for high-ion gas. The Si II transition saturates at which is 10 lower than the Si+ column density for any GRB-DLA sightline and lower than nearly every QSO-DLA. Therefore, this measure should be relatively insensitive to the gas metallicity or value. This point is emphasized in Figure 3 where we show the curve-of-growth for the Si II 1526 transition and the observed total Si+ column density and equivalent widths for the QSO-DLAs and GRB-DLAs. It is evident that the equivalent width has significant contributions from multiple, lower column density clouds. Because C IV is a doublet, the C IV 1548 transition will blend with C IV 1550 when Å. In these few cases, we adopt a lower limit for . The and values of the GRB-DLA are summarized in Table 2. We also list the metallicity [M/H] measurement (or lower limit) for each GRB-DLA (see Prochaska, Chen & Bloom, 2007, for details).
4. RESULTS
In this section, we present the observational results. The next section will discuss the implications.
4.1. and Distributions
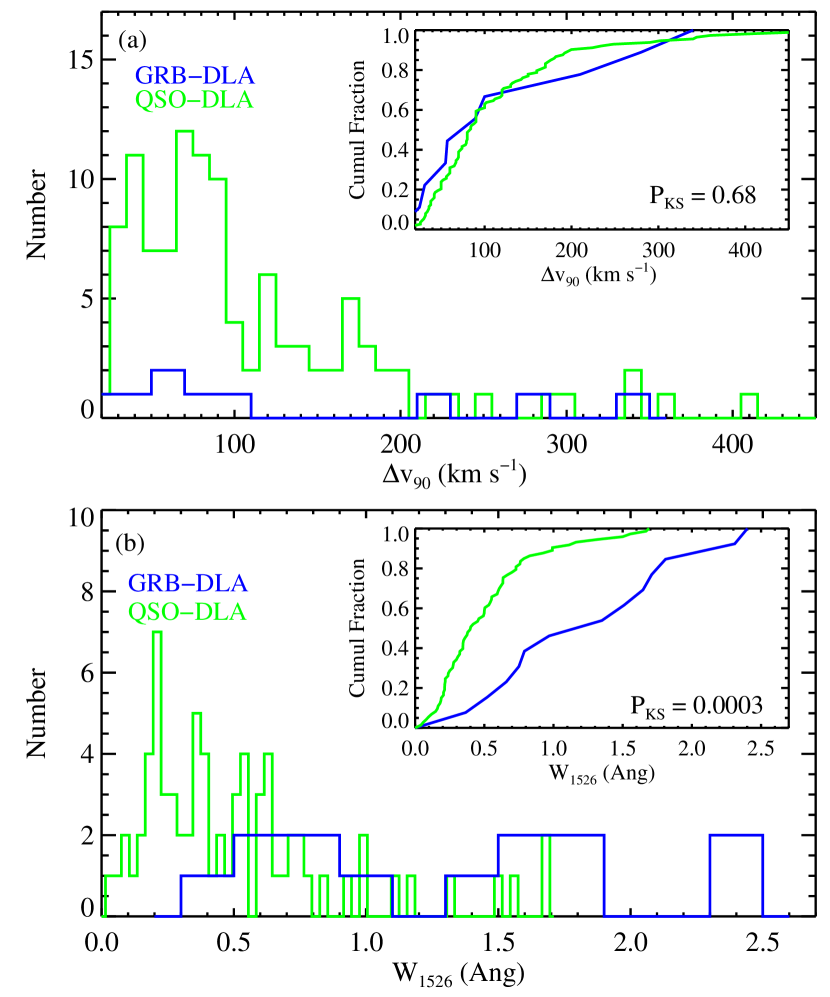
Figure 4a presents the velocity width () distributions for the GRB-DLAs and for the statistical subset of QSO-DLAs. The two distributions are similar; the majority of galaxies have and each sample shows a significant tail out to several hundred km s-1. A two-sided Kolmogorov-Smirnov test rules out the null hypothesis that the two distributions are drawn from the same parent population at only 32% c.l. In the current GRB-DLA sample, there is a higher fraction of systems with than the QSO-DLA distribution. The difference is not statistically significant at present, but future observations may reveal a systematic difference in this respect.
Because the GRB are embedded within the interstellar medium (Figure 2), the velocity widths are likely an underestimate of the value that one would derive by extending the sightline through the other side of the galaxy. If the kinematics are dominated by random motions or rotational dynamics, then the median increase in should be less than a factor of two. To be conservative, we have recomputed the K-S statistic after doubling each value of the GRB-DLAs. We find results that are still consistent with the null hypothesis, . In this regard, the sample of GRB-DLA sightlines have velocity fields typical of those observed for QSO-DLAs. Under the assumption that is dominated by the gravitational potential (e.g. Haehnelt, Steinmetz & Rauch, 1998), these results suggest that the parent populations of GRB-DLA and QSO-DLA have similar dynamical masses.
From even the first afterglow spectrum (Metzger et al., 1997), it was evident that the gas surrounding GRB exhibit large equivalent widths from low-ion transitions like Si II and Mg II (Savaglio, Fall & Fiore, 2003). As noted in 3, these large equivalent widths do not require large or metallicity; the values are often dominated by the velocity fields of low column density clouds which do not contribute to the statistic. Figure 4b presents a histogram of values for the GRB-DLA compared against the values of the statistical QSO-DLA subset. The mean and median of the GRB-DLA distributions are significantly larger than the QSO-DLAs and a K-S test rules out the null hypothesis at c.l. Whereas the values are in rather good agreement between the two samples, the values of the GRB-DLAs are systematically larger. This is an unexpected and puzzling result which requires unique velocity fields from low column density gas along GRB sightlines.
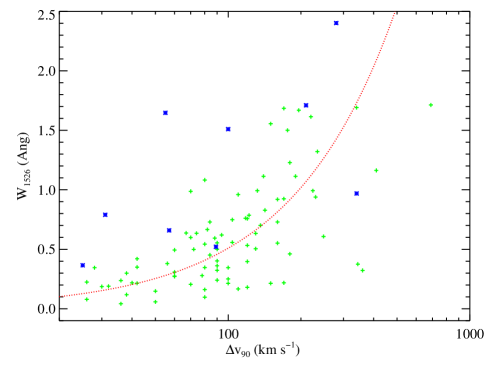
We will argue below that the statistic in GRB-DLAs is dominated by the ISM of the GRB host galaxy. It is our expectation that this also holds true for QSO-DLAs. We will also argue that the values result from motions independent of the neutral ISM. If other environments contribute to , then one predicts to be only loosely correlated with . Figure 5, which plots , pairs for the GRB-DLAs and QSO-DLAs, indicates that this is the case. The dashed line traces the predicted value for a fully saturated (i.e. boxcar) line-profile that has velocity width . Although the QSO-DLAs roughly follow this line, the GRB-DLAs tend to lie significantly above it. Regarding the QSO-DLAs, we interpret the results in Figure 5 as evidence that many sightlines penetrate gas with velocity fields that are distinct from the majority of gas. Furthermore, this fraction appears to increase with . In the GRB-DLAs, nearly every sightline shows a substantial contribution to from gas that does not dominate the total optical depth. In 5, we will discuss the origin and nature of these velocity fields in greater detail.
4.2. Kinematic Correlations with Other Properties of the ISM
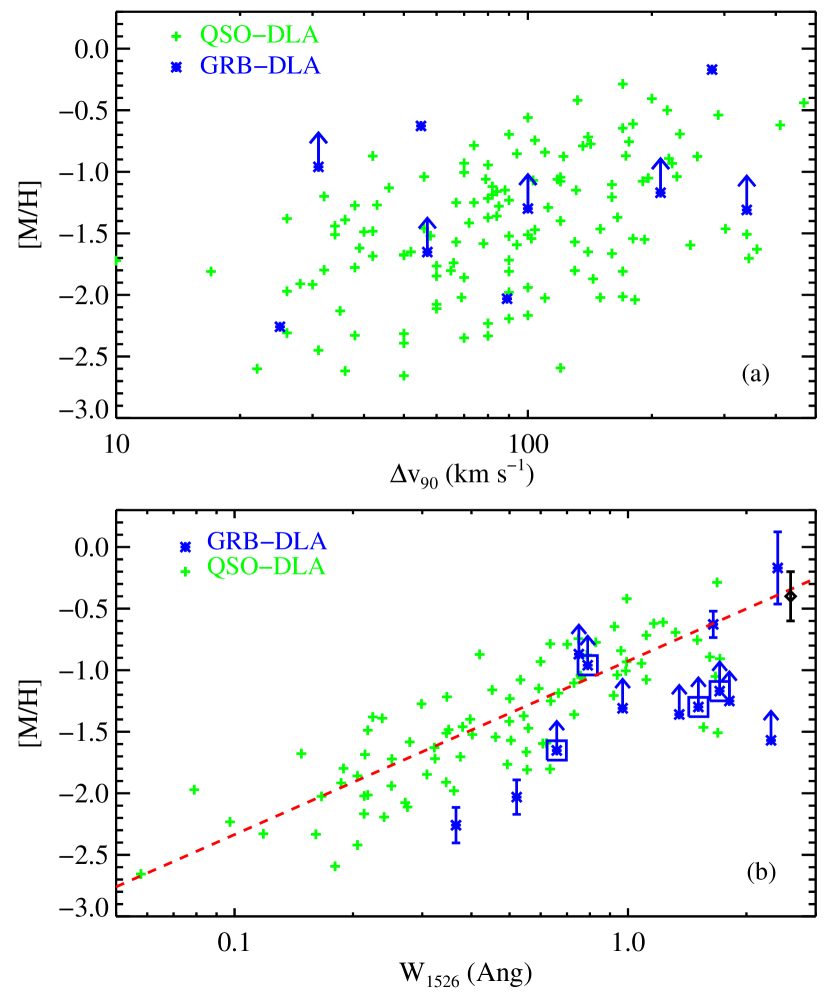
We have considered the trends between kinematic characteristics and other physical properties of the ISM. We first examined whether the GRB-DLAs follow the observed trends for QSO-DLAs between gas kinematics and metallicity (Wolfe & Prochaska, 1998; Ledoux et al., 2006; Murphy et al., 2007). Figure 6a presents [M/H] values against the statistic for the GRB-DLAs and the full QSO-DLA sample. Note that the GRB-DLA data points with lower limits to [M/H] have and an assumed H I column density . Therefore, these [M/H] values (reported as lower limits because their metal-line profiles are saturated) should be considered cautiously. The QSO-DLAs shown in Figure 6a exhibit the correlation reported by previous authors (Wolfe & Prochaska, 1998; Ledoux et al., 2006). It is not a tight trend, however, and we suspect several physical factors (e.g. a mass/metallicity relation; variations with sightline impact-parameter and galaxy inclination) contribute to produce the observed distribution. Similar to the distribution (Figure 6a), we find that the GRB-DLAs track the locus defined by the QSO-DLAs. Adopting the upper limits to [M/H] as values, we report a Pearson correlation coefficient of 0.4. We conclude that there is only tentative evidence for a correlation between and [M/H] for the GRB-DLA.
In Figure 6b, we present the , [M/H] pairs for the two populations. The QSO-DLA data exhibit a remarkably tight correlation. These are are well described by a power-law,
| (1) |
with best-fit parameters, and . For this fit, we have assumed equal weights for all of the data points and we have restricted the sample to Å to ignore the ‘outliers’ at large value. If we include all of the data points (with equal weighting), we derive and . Although the data scatter about this power-law, the trend is considerably tighter than the correlation between and [M/H]. In fact, it is the tightest correlation known between metallicity and any other property of the QSO-DLAs (see also Murphy et al., 2007). The small scatter is especially impressive given that dex is expected from observational uncertainty in the [M/H] measurements ( error). It is a rather surprising trend because the kinematics of the gas that determines [M/H] are better described by the statistic yet Figure 6a shows this correlation has much greater scatter. Put another way, the line-profiles with Å are highly saturated and should not be expected to reflect the gas metallicity (Figure 3).
This is not to imply that the values are strictly independent of [M/H]. For example, an optical depth profile characterized by shallow, decreasing wings extending to large velocity (e.g. a Lorentzian profile) would yield larger for larger . On the other hand, a velocity field with a sharp cutoff (e.g. a Gaussian random field) would be insensitive to [M/H]. Furthermore, the peak optical depth value is a function of both [M/H] and , and the QSO-DLA data presented in Figure 6b span a factor of dex in value. Therefore, the results on the QSO-DLAs in Figure 6b indicate an underlying physical mechanism which causally connects [M/H] and . The GRB-DLAs also show a trend between and [M/H], although its characterization is complicated by the many lower limits to [M/H]. A qualitative assessment of the current results suggests either an offset between the trends for the two populations and/or a steeper power-law for the GRB-DLAs. We will return to these issues in 5.3.
Irrespective of the physical origin of the correlation, the results presented in Figure 6b indicate one may use as a proxy for metallicity, especially if applied to a sample of data points instead of individual systems. We find that a sample of at least 10 QSO-DLA systems gives an average logarithmic metallicity derived from the observed values and Equation 1 that lies within 20 of the actual value for 95 of random trials. Emboldened by this result, we apply equation 1 to the GRB-DLAs but offsetting [M/H] by to allow for an offset between the GRB-DLA and QSO-DLA trends. We derive an average logarithmic metallicity for the GRB of .
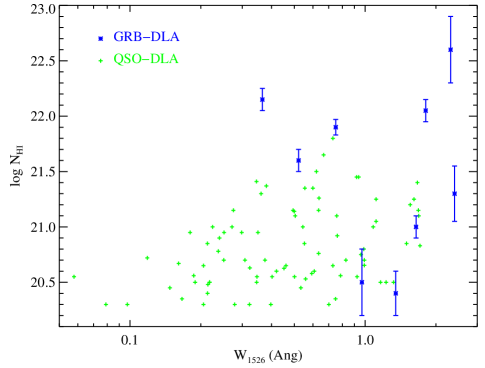
We have also examined trends between and the H I column density (for vs. , see Wolfe & Prochaska, 1998; Wolfe, Gawiser & Prochaska, 2005). Figure 7 presents the , pairs for the QSO-DLAs and GRB-DLAs. The two quantities are correlated in that the median value increases with . Furthermore, there are no sightlines with low and large value. For sightlines with Å, however, we observe a wide range of values for any given value. The large observed scatter contrasts with the [M/H], trends in Figure 6b, even though is the product of [M/H] and . We conclude that only [M/H] is physically tied to the gas kinematics expressed by the statistic.
4.3. High-ion gas:
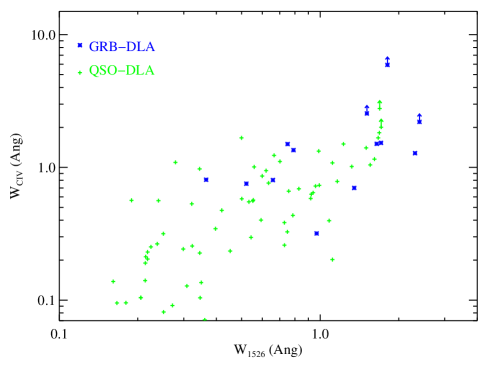
It is difficult to measure the 90 velocity interval for C IV in GRB-DLAs because the C IV doublet is often saturated. Therefore, we have examined the rest equivalent width of the C IV 1548 transition, . These are plotted against in Figure 8. Even though unsaturated low-ion profiles do not closely track the C IV line-profiles in QSO-DLAs (i.e. component by component; Wolfe & Prochaska, 2000), there is a strong correlation between their low and high-ion kinematics. Wolfe & Prochaska (2000) have interpreted this global correlation as an indication that the gas traces the same gravitational potential (see also Maller et al., 2003).
The GRB-DLAs also exhibit a significant correlation between and . But, one also finds that the values of the GRB-DLA are systematically larger than those for the QSO-DLAs. Similarly, correlates with the ISM metallicity for both samples. The correlation between and in the GRB-DLAs suggests that their velocity fields are at least coupled. This assertion is further supported by the coincidence of C IV and Si II absorption at some velocities (Prochaska et al., 2007). Therefore, investigations on the velocity field of one ion may give insight to the other.
5. DISCUSSION
5.1. Summary of Results
The results presented in the previous section can be summarized as follows:
-
1.
The distributions of values (the velocity interval encompassing 90 of the gas) from QSO-DLAs and GRB-DLAs are very similar. Both samples exhibit median with a significant tail to several hundred km s-1 (Figure 4a).
-
2.
In contrast to the statistic, the GRB-DLA exhibit systematically larger measurements than the QSO-DLAs (Figure 4b).
-
3.
Both the GRB-DLAs and QSO-DLAs show a correlation between and metallicity [M/H] but with large scatter (Figure 6a).
-
4.
There is a remarkably tight correlation between and metallicity [M/H] for the QSO-DLA sample. The correlation is well described by a power-law, [M/H] = with and . There is also a correlation observed between metallicity and for the GRB-DLAs. This trend may be offset and/or steeper than the QSO-DLA distribution (Figure 6b).
-
5.
The high-ion and low-ion kinematics traced by and are correlated (Figure 8).
We will now explore the origin and nature of the velocity fields in QSO-DLAs and GRB-DLAs and the implications for the galaxies which produce them.
5.2. The Nature of Galactic Velocity Fields at High
In a star-forming galaxy, there are four principal areas that have unique velocity field characteristics and can contribute to the and statistics: (i) the neutral ISM, whose motions are dominated by galactic rotation and mild turbulent velocities; (ii) H II regions, with velocity fields driven by stellar processes (e.g. winds, supernovae); (iii) halo gas clouds, whose kinematics include contributions from gravitational accretion and virialized motions; and (iv) galactic-scale outflows driven by supernovae activity in the ISM (e.g. Mac Low & Ferrara, 1999) and/or heating by galaxy-galaxy mergers (e.g. Cox et al., 2006). In the following, we will examine our observational results within the framework of a model where the statistic is dominated by gas in the ambient, neutral ISM while halo dynamics determine the the and measurements. In addition, we will propose that the and statistics occasionally trace velocity fields representative of galactic-scale outflows.
This two component scenario (ISM+halo gas) is neither an original nor provocative interpretation of absorption-line systems arising in galaxies (e.g. Mo & Miralda-Escude, 1996; Kauffmann, 1996; Haehnelt, Steinmetz & Rauch, 1998; McDonald & Miralda-Escudé, 1999; Maller et al., 2001, 2003). Indeed, this is also the favored model for gas in the Milky Way (e.g. Spitzer, 1990; Savage, Sembach & Lu, 1997) and Magellanic Clouds (e.g. Lehner & Howk, 2007). And, the model has been invoked for a wide range of quasar absorption-line observations including the impact parameter distribution of Mg II systems from their host galaxies (Bergeron & Boisse, 1991; Lanzetta & Bowen, 1990, 1992; Steidel, 1993) and C IV absorption by galaxies (Chen, Lanzetta & Webb, 2001; Wolfe & Prochaska, 2000; Maller et al., 2003). We will demonstrate that our observations support this model and we will derive new insights into the gas dynamics of high galaxies.
Within this disk/halo scenario, the statistic traces the kinematics of the ambient ISM, i.e., the optical depth of the gas external to the neutral ISM contributes less than 10 of the total. In the context of QSO-DLAs, this is reasonable because (i) the large values that define a DLA may require the sightlines intersect the ambient ISM; and (ii) one expects halo gas to be predominantly ionized (e.g. Mo & Miralda-Escude, 1996) whereas the majority of gas in QSO-DLA is neutral (Vladilo et al., 2001; Prochaska et al., 2002). We will now demonstrate that observations of the GRB-DLAs directly connect the neutral ISM with the statistic.
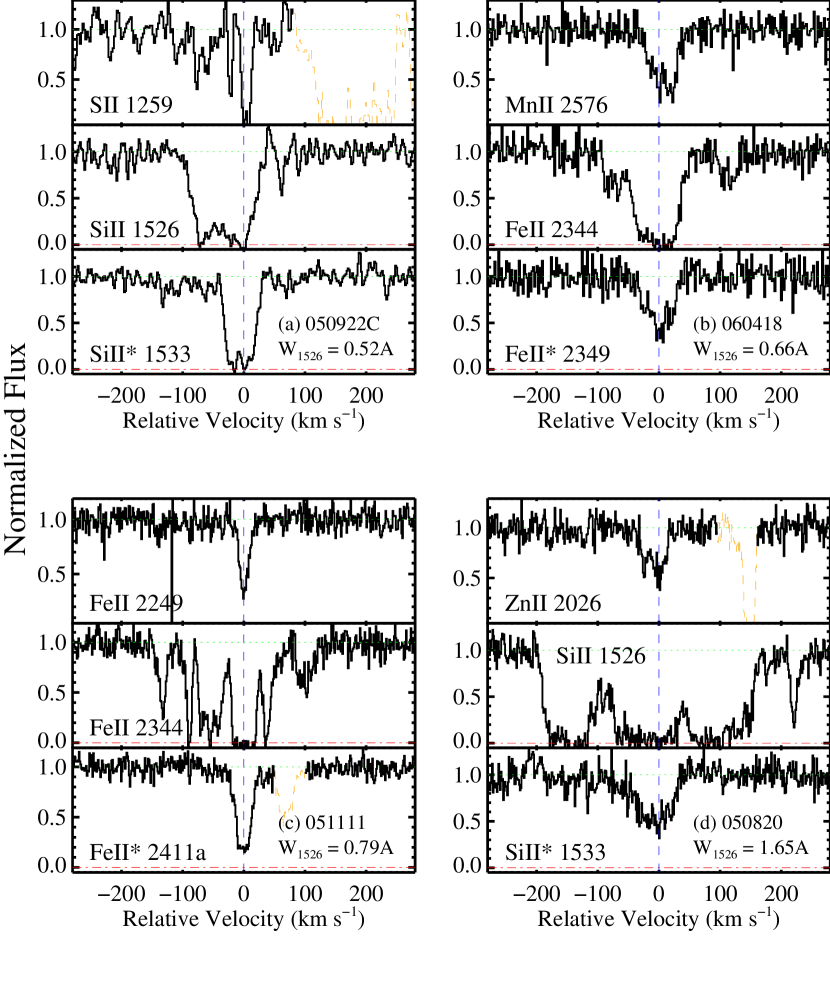
Figure 9 plots pairs of strong resonance-line transitions (one weak, one strong) against a fine-structure transition for four GRB-DLAs observed at high spectral resolution. In all four cases, the fine-structure absorption lines trace only the gas which dominates the total optical depth, i.e. the gas revealed by the weak transitions. Prochaska, Chen & Bloom (2006) showed that fine-structure absorption in the GRB-DLAs is due to UV pumping by radiation from the GRB event and its afterglow. For the GRB-DLAs shown here, the presence of fine-structure absorption dictates that this gas is located within kpc of the burst. Furthermore, the GRB-DLAs also show Mg I absorption coincident with the fine-structure lines (Prochaska et al., 2007). This requires the gas to lie at pc to avoid being photoionized by the GRB afterglow (Prochaska, Chen & Bloom, 2006, 2007). The overall implication is that gas comprising 90 of the total optical depth lies between pc and kpc from the GRB, i.e. within the nearby ISM333The absence of H2 absorption in this gas (Tumlinson et al., 2007) also indicates we are probing the ambient ISM and not the local star forming region (i.e. molecular cloud).. In summation, the GRB-DLA observations give empirical confirmation that the values reflect the kinematics of the neutral ISM.
Having established a direct association between the values and the ISM, it is reasonable to assume that these values trace the rotational dynamics and turbulent fields within high galaxies. This is especially the case for systems with ; larger values may be better interpreted as sightlines through multiple galaxies or even supernovae winds (Nulsen, Barcons & Fabian, 1998). Because the turbulent velocities in neutral gas are generally small (), sightlines with should be dominated by differential rotational along the sightline or peculiar motions of multiple massive clumps (Haehnelt, Steinmetz & Rauch, 1998; Maller et al., 2001). It is natural, therefore, to compare the distributions of GRB-DLAs and QSO-DLAs in terms of dynamical masses. Before drawing such conclusions using the distributions, however, one must examine the effects of differences in sightline configuration (Figure 2).
The GRB-DLA sightlines are restricted to travel through approximately half of the galaxy and are expected to have smaller impact parameter than the average QSO-DLA sightline. The latter point is supported by the higher H I column densities, metallicities, and depletion levels observed for GRB-DLA sightlines (Prochaska, Chen & Bloom, 2007). These two effects will compete against each other if differential rotation explains the statistic. On the one hand, a reduced sightline leads to an underestimate of because one does not probe all of the gas along the sightline. This effect should be small, however, because even a full sightline will only probe approximately one quadrant of a rotating disk (Prochaska & Wolfe, 1997). The correction would be larger for a random velocity field, but still less than a factor of two. It is only if the velocity fields are dominated by a symmetric infall/outflow that the effect would be large. Such velocity fields, however, are unlikely to describe the neutral ISM of high galaxies. The other geometric effect – smaller average impact parameter – will imply larger values (e.g. Prochaska & Wolfe, 1997). This effect is likely to dominate and, if anything, we expect the GRB-DLAs would be biased to higher values than the QSO-DLAs for sightlines penetrating the same parent population of galaxies.
We conclude, therefore, that the observed distributions indicate the galaxies hosting QSO-DLAs and GRB-DLAs have similar mass distributions. There is at least circumstantial evidence in support of this conclusion. In particular, the median luminosity of GRB-DLAs host galaxies is low, approximately at (Le Floc’h et al., 2003). Although very few QSO-DLA have been successfully imaged at (Møller et al., 2002), theoretical expectation is that the majority will also be sub-luminous (Haehnelt, Steinmetz & Rauch, 2000; Maller et al., 2000; Nagamine et al., 2005) and the average luminosity at is (Chen & Lanzetta, 2003). Similarly, neither sample has shown evidence for a large fraction of bright galaxies (Le Floc’h et al., 2003; Colbert & Malkan, 2002). Altogether, we conclude that the host galaxies of GRB-DLAs and QSO-DLAs have comparable masses. Adopting recent results on the latter population, we infer dark matter halo masses of for the GRB-DLA (Bouché et al., 2005; Cooke et al., 2006; Nagamine et al., 2005).
The assertion that GRB-DLA and QSO-DLA host galaxies have similar mass is immediately challenged by our observation that GRB-DLA show systematically larger values (Figure 4b). To address this issue, we must identify the origin of the velocity fields contributing to . There are two factors which contribute to the statistic: the number of clouds intersected by the sightline and the relative velocities of these clouds. The total velocity field is a convolution of the relative velocity field within each environment giving rise to Si+ and the relative velocities between the environments. We emphasize that even highly ionized gas can have trace quantities of Si+ that would be revealed by the strong Si II transition (e.g. Prochaska, 1999).
Returning to Figure 9, we can address the contribution of various velocity fields to . At small values (a,b), the neutral ISM clearly dominates. In contrast, the two GRB-DLAs with large (c,d) show multiple clouds with relatively low column density and no associated fine-structure absorption. The absence of fine-structure absorption places these clouds at kpc from the GRB afterglow (Prochaska, Chen & Bloom, 2006; Chen et al., 2007). Note that this is true even though the column densities of these components are small compared to the total because the resonance and fine-strucure transitions have similar oscillator strengths. Therefore, this gas cannot be associated with star-formation processes local to the GRB (e.g. stellar winds, supernovae). The gas is either within the ISM but at much larger distance than the gas that dominates the total optical depth, or it lies outside the ISM altogether (i.e. halo gas or the ISM of a companion galaxy). We prefer to associate the gas with the galactic halo because: (i) the velocities are large (up to hundreds km s-1) compared to random and dynamical motions for the neutral ISM of galaxies; (ii) if the statistic tracked dynamics in the ISM then a very large metallicity gradient may be required for the statistic to be insensitive to these motions; (iii) there is high-ion absorption (e.g. Si IV, C IV; Figure 1) coincident with many of the low column density Si+ components; and (iv) the ionic ratios of some components indicate they are highly ionized (Dessauges-Zavadsky et al., 2006). An example of the last point is revealed in Figure 1 by the cloud at . This cloud has even though O is at least 1 dex more abundant than Si in every astrophysical environment known. The only viable explanation for observing is that the gas is highly ionized.
Granted that gas beyond the ISM dominates the statistic, the next issue is to examine the nature of its velocity field. This may include virialized motions, gravitational accretion (Mo & Miralda-Escude, 1996; McDonald & Miralda-Escudé, 1999), and outflows from galactic feedback (Dong, Lin & Murray, 2003; Cox et al., 2006). The latter two processes imply organized flows that would be revealed by the observations if we knew the systemic velocity of the galaxy. For the GRB-DLAs, we can measure the systemic redshift from nebular emission lines (e.g. Thoene et al., 2006) but the absorption-line data also yield a direct measurement: the line centroid of the fine-structure transitions. Because this gas occurs within kpc for the GRB-DLA, it establishes the velocity of the neutral ISM. Examining the line-profiles of Figure 9 (c,d) in this light, we note that the Si+ gas shows both positive and negative absorption in the case of GRB-DLA 050820 but predominantly negative velocities for GRB-DLA 051111. Therefore, one example exhibits motions reflective of a random (i.e. virialized) velocity field and the other inspires an outflow interpretation (see also Thoene et al., 2006). It is too early to draw generic conclusions about the velocity fields of GRB-DLAs, but future observations akin to Figure 9 will offer an unprecedented view into the nature of gas kinematics at high .
Let us now address the offset in the distributions between the GRB-DLAs and QSO-DLAs (Figure 4b). Could the offset be explained by differences in sightline configurations? As with the values, there are competing effects. The bias to smaller impact parameter will only be important if the Si+ velocity fields have significant variations on kpc scales. This could occur if the majority of gas is located near star-forming regions, i.e. the origin of the GRB sightline. If the Si+ gas is distributed throughout the halo (i.e. tens of kpc), then an impact parameter bias should be unimportant. Meanwhile, if the velocity field has significant contribution from infall or outflow then restricting the GRB-DLA sightlines to originate from within the ISM leads to a systematic underestimate. Therefore, sightline geometry will bias the statistic to larger values for the GRB-DLA only if the velocity field has significant variations on kpc scales and is asymmetric. Numerical simulations do indicate gas being accreted tends to fall in along radial orbits (A. Dekel, priv. comm.). This may imply larger values for sightlines originating at the center of the galaxy (GRB-DLAs) as opposed to large impact parameter (QSO-DLAs). While differences in sightline configurations may contribute to the differences in between QSO-DLAs and GRB-DLAs, we contend that the observed differences in the distributions for GRB-DLAs and QSO-DLAs reflect actual differences in the gas kinematics of their host galaxies.
A possible explanation for larger values in GRB-DLA is that their host galaxies are significantly more massive. There are two arguments against this assertion. First, the distributions of the QSO-DLAs and GRB-DLAs are similar (Figure 4a). While the statistic may be a better tracer of the gravitational potential (see below), the statistic should also distinguish between large differences in dark matter halo masses. Second, direct imaging of GRB host galaxies reveal they have low luminosity (Le Floc’h et al., 2003; Fruchter et al., 2006) and, presumably, low mass. We consider it unlikely that the QSO-DLA have substantially lower luminosity (and mass) than that observed for the GRB-DLAs.
The most likely interpretation for the higher values in GRB-DLAs is that the kinematics of gas contributing to the statistic has significant contribution from galactic-scale outflows. We are guided to this conclusion in part because the GRB phenomenon is directly linked to active star formation, i.e., GRB host galaxies have systematically higher current star formation rates than QSO-DLA galaxies. One observes that GRB host galaxies have star formation rates which are large for their luminosity (Christensen, Hjorth & Gorosabel, 2004). This characteristic is described as a high specific SFR and it separates GRB host galaxies from the general population of high galaxies. Therefore, a scenario where processes related to star formation stir the velocity fields traced by Si+ gas may naturally account for the systematic offset in between QSO-DLAs and GRB-DLAs. These processes may include galactic outflows inspired by major mergers (Cox et al., 2006) or galactic fountains driven by supernovae feedback (Mac Low & Ferrara, 1999; Dong, Lin & Murray, 2003). The latter effect may be challenged, however, by the short lifetime expected for GRB progenitors. In this respect, the velocity fields of GRB-DLAs may more resemble the outflows of the Lyman break galaxies (e.g. Pettini et al., 2002). We eagerly await new observations like those presented in Figure 9 to further test these scenarios.
5.3. Interpreting the Kinematic-Metallicity Correlations in DLAs
In Section 4.2 (Figure 6), we presented the observed correlations between the kinematic statistics (, ) and the ISM metallicity [M/H]. The -[M/H] correlation has been previously identified for QSO-DLA samples (Wolfe & Prochaska, 1998; Ledoux et al., 2006). Although its scatter is substantial, the statistical significance is high and Ledoux et al. (2006) report a best-fit power-law of the form [M/H]. These authors have interpreted the result in terms of a mass-metallicity relation, i.e. the statistic traces the gravitational potential of the DLA galaxy. Our results on the GRB-DLA lend further support to this interpretation. In particular, we have shown that the statistic is dominated by material near the GRB, i.e. the neutral ISM. Although ISM velocity fields are stirred by supernovae, they are generally dominated by gravitational motions (e.g. rotation, turbulence, accretion).
A key aspect of the -[M/H] trend is its large scatter which cannot be attributed to observational uncertainty. We interpret the scatter as a natural consequence of the QAL experiment. If the velocity field is dominated by rotation, then a large scatter results simply from a range of impact parameters and disk inclinations (e.g. Prochaska & Wolfe, 1997). In this case, only the upper bound of the ,[M/H] locus would describe the average rotation speed of galaxies at a given metallicity. Similarly, if the velocity field results from turbulence or accretion, then will be sensitive to the number of clouds intersected by the sightline. In this scenario, however, one would require large variations in the number of ‘clouds’ intersected by sightlines, which is not entirely supported by the observations (e.g. Prochaska & Wolfe, 1997).
In contrast to the -[M/H] trend, the ,[M/H] pairs for the QSO-DLAs follow an extremely tight correlation (Figure 6b). In fact, most of the scatter may be attributed to observational uncertainty. In several respects, this is a stunning result. The [M/H] values represent the average metallicity along the entire sightline, which is dominated, of course, by the gas corresponding to the majority of the total optical depth, i.e., the gas which defines the statistic. In contrast, gas which has negligible contribution to the measured metallicity can dominate the statistic (Figure 9). Furthermore, we have shown (for the GRB-DLAs) that [M/H] is set by gas local to the ISM of the galaxy whereas the statistic has significant contribution from gas external to the ISM. Indeed, quasar absorption lines are frequently associated with halo gas surrounding a galaxy (e.g. Bergeron & Boisse, 1991; Steidel, 1993; Chen, Lanzetta & Webb, 2001; Charlton & Churchill, 1998). Therefore, in the DLAs we reach a rather surprising conclusion that the local ISM properties (metallicity) are tightly correlated with the large-scale velocity field.
Let us now comment on the origin of the -[M/H] trend. The first point to stress is that we derive a similar power-law as observed for the ,[M/H] pairs in QSO-DLAs (see also Murphy et al., 2007). We conclude that the kinematic-metallicity trends have the same physical origin. One may gain insight by comparing our trend with the velocity-metallicity correlations observed for other galactic populations. Dekel & Woo (2003) have found the velocity dispersion in dwarf and low-luminosity low surface-brightness galaxies at correlates with the stellar mass : . Furthermore, their compilation shows a tight correlation between metallicity and stellar mass, implying a metallicity-velocity correlation: . The correspondence between the kinematic-metallicity trend of local low-mass galaxies with that of the QSO-DLAs is remarkable. Although one refers to this trend locally as a mass-metallicity relation, it is important to stress that simple scaling laws do not predict the observed trend. Dekel & Woo (2003) have shown that in a closed-box model the metallicity is independent of stellar mass; indeed, this follows observations for massive, high surface brightness galaxies (e.g. Tremonti et al., 2004). Therefore, Dekel & Woo (2003) argued that the mass-metallicity trend observed for lower mass galaxies requires supernovae feedback (but see also Lee et al., 2006; Tassis, Kravtsov & Gnedin, 2006). In this respect, therefore, one may speculate whether the velocity fields observed in the QSO-DLAs represent gravitational dynamics or feedback processes. Let us now consider arguments for and against each interpretation.
There are several arguments supporting the interpretation of Figure 6 in terms of a mass-metallicity correlation, i.e. that the velocity fields trace the gravitational potential. First, the observed slopes of the and -[M/H] trends follow the same trends as local dwarf and low-luminosity low-surface brightness galaxies (Dekel & Woo, 2003) whose velocity dispersions presumably reflect their gravitational potentials. Second, the large scatter in the -[M/H] trend can be explained by variations in impact parameter and inclination through the DLA galaxies. Third, a tight trend is reasonable for ,[M/H] pairs if the statistic is dominated by halo dynamics. For virialized motions characterized by a velocity dispersion , and the scatter in this quantity will be small for a given velocity dispersion if the number of clouds penetrated by the sightline . The latter point is supported by the observations (e.g. Figure 1). Fourth, the Si II 1526 profiles of at least some GRB-DLAs show both negative and positive velocities relative to the systemic (Figure 9). This is expected for gas that traces a virialized (random) velocity field (see also Robertson & Chen, in prep.). Finally, Möller, Fynbo & Fall (2004) have noted that the only DLAs that have been successfully imaged at also have high metallicity, suggesting stellar mass may correlate with enrichment.
There are two counterarguments to interpreting the and statistics as tracers of the gravitational potential of individual dark matter halos. First, it is may be unrealistic to explain velocity widths that exceed several hundred km s-1 in terms of a single galactic potential. At very large or values, therefore, we expect that additional velocity fields contribute. These could include galactic-scale outflows but also the peculiar motions of multiple galaxies along the sightline (e.g. Maller et al., 2001). Second, Bouché et al. (2007) have reported an anti-correlation between Mg II equivalent width444In absorbers where one observes both the Si II 1526 transition and the Mg II doublet, one finds the line profiles track each other very closely. As such, their equivalent widths are highly correlated and roughly scale as the inverse of their wavelengths: (in detail we find ). and the cluster-length of these absorbers (a subset include DLAs Prochter et al., 2006) with large, red galaxies (LRGs). These authors have interpreted this result in terms of a wind scenario: systems exhibiting larger equivalent widths occur in less massive, star-bursting galaxies. We note, however, several caveats to their interpretation: (i) the Mg II absorbers have and may have very different characteristics (star-formation rates, metallicity, gas content) than the QSO-DLAs that are plotted in Figure 6; (ii) Zibetti et al. (2007) find the integrated light of galaxies corresponding to Mg II absorbers is brighter for larger equivalent width systems suggesting larger masses.
Now consider the evidence in favor of interpreting the statistic (and perhaps ) as galactic-scale outflows. First, as noted above, the trend of decreasing correlation-length with increasing equivalent width offers at least qualitative evidence for a wind scenario (Bouché et al., 2007). Second, the kinematics of some strong Mg II absorbers are consistent with that expected for symmetric outflows (Bond et al., 2001). Third, if star formation drives galactic-scale outflows, then one may expect a correlation between metallicity and . It may be difficult to precisely derive the observed trend ([M/H] ) from first principles, but we cannot rule out such a scenario. Third, we find the Lyman break galaxy MS 1512-cB58 (Pettini et al., 2002) lies directly on the -[M/H] trend of the QSO-DLAs (black diamond in Figure 6b). Given that the LBG gas kinematics are dominated by outflows (Pettini et al., 2002), the correspondence between the LBG data and the QSO-DLA trend is at least suggestive that outflows may play a role in shaping the observed correlation. The comparison with the QSO-DLAs may not be appropriate, however, because the LBG sightline is restricted to originate at the central, star-forming region of the galaxy. This implies a special impact parameter and one that presumably probes only half of the total velocity field. In these respects, a comparison with the GRB-DLAs is more appropriate and the correspondence with the QSO-DLA trend may be simple coincidence.
There are several arguments against interpreting the measurements as galactic-scale outflows. First, the similarity in the and -[M/H] trends would require one to interpret both statistics in terms of outflows (or invoke coincidence). In turn, one would have to argue that these winds have gas with large neutral fractions (Prochaska et al., 2002) and significant cross-section to gas with (e.g. Schaye, 2001). Second, we believe a galactic-scale outflow scenario would be severely challenged to reproduce the tight correlation observed for and metallicity. Assuming outflows are generally collimated, the statistic should exhibit a wide range of values for a given wind speed as a function of the sightline configuration (i.e. impact parameter and inclination). Furthermore, the value is given by the internal dynamics of the wind (i.e. its turbulence) because it is a relative measure independent of the systemic velocity. It is not obvious that this quantity could be tightly correlated with metallicity. Third, there are at least some GRB-DLAs where the velocity field is not strictly consistent with outflows (Figure 9). Fourth, mass-metallicity relations have been identified for numerous galaxy populations at a range of redshifts (Dekel & Woo, 2003; Tremonti et al., 2004; Kobulnicky & Kewley, 2004; Savaglio et al., 2005; Erb et al., 2006). It would be very remarkable for the QSO-DLAs to exhibit a tight velocity-metallicity trend that was unrelated to a mass-metallicity correlation. Fifth, we question a scenario which requires galactic-scale outflows in all galaxies tuned to give both low and large values with such small scatter. Sixth, comparisons of Mg II absorption line profiles with H II emission-line kinematics are inconsistent with a wind scenario and support dynamical motions (Steidel et al., 2002). Finally, while observers are quick to invoke outflows to explain extreme velocity fields, we question whether outflows can reasonably explain widths approaching and in excess of 1000 km s-1.
On balance, we currently favor the interpretation of the velocity fields in QSO-DLAs as being dominated by gravitational motions, at least for Å and . At large and large , it is reasonable to expect that additional velocity fields contribute. Indeed, an inspection of Figure 6b reveals that the QSO-DLA galaxies with largest departure from the [M/H]- relation occur at large values. These few QSO-DLAs have especially large for their observed metallicity and/or low metallicity for the observed value. We suspect that the former inference is the correct interpretation and that these systems have contributions to the statistic beyond the halo gas dynamics. These QSO-DLAs are the most viable candidates for sightlines penetrating galactic-scale outflows. This interpretation could also explain the frequency of GRB-DLAs that lie off the QSO-DLA trend. As noted in the previous section, GRB-DLAs have especially large specific star formation rates. Therefore, GRB may flag galaxies at a time when they are most likely to drive galactic-scale outflows. Given the identification of GRB with massive, short-lived stars, there may not be sufficient time to drive these winds with supernovae feedback. Instead, one may need to consider merger-driven, galactic outflows.
References
- Barth et al. (2003) Barth, A. J. et al. 2003, ApJ (Letters), 584, L47.
- Berger et al. (2006) Berger, E. et al. 2006, ApJ, 642, 979.
- Bergeron & Boisse (1991) Bergeron, J. and Boisse, P. 1991, Advances in Space Research, 11, 241.
- Bond et al. (2001) Bond, N. A. et al. 2001, ApJ, 562, 641.
- Bouché et al. (2005) Bouché, N. et al. 2005, ApJ, 628, 89.
- Bouché et al. (2007) Bouché, N. et al. 2007, New Astronomy Review, 51, 131.
- Castro et al. (2003) Castro, S. et al. 2003, ApJ, 586, 128.
- Cen & Ostriker (2000) Cen, R. and Ostriker, J. P. 2000, ApJ, 538, 83.
- Charlton & Churchill (1998) Charlton, J. C. and Churchill, C. W. 1998, ApJ, 499, 181.
- Chen & Lanzetta (2003) Chen, H.-W. and Lanzetta, K. M. 2003, ApJ, 597, 706.
- Chen, Lanzetta & Webb (2001) Chen, H.-W., Lanzetta, K. M., and Webb, J. K. 2001, ApJ, 556, 158.
- Chen et al. (2007) Chen, H.-W. et al. 2007, ArXiv Astrophysics e-prints.
- Chen et al. (2005) Chen, H.-W. et al. 2005, ApJ, 634, L25.
- Christensen, Hjorth & Gorosabel (2004) Christensen, L., Hjorth, J., and Gorosabel, J. 2004, A&A, 425, 913.
- Colbert & Malkan (2002) Colbert, J. W. and Malkan, M. A. 2002, ApJ, 566, 51.
- Cooke et al. (2006) Cooke, J. et al. 2006, ApJ, 636, L9.
- Cox et al. (2006) Cox, T. J. et al. 2006, MNRAS, 373, 1013.
- Dekel & Woo (2003) Dekel, A. and Woo, J. 2003, MNRAS, 344, 1131.
- Dekker et al. (2000) Dekker, H. et al. 2000, in Proc. SPIE Vol. 4008, p. 534-545, Optical and IR Telescope Instrumentation and Detectors, Masanori Iye; Alan F. Moorwood; Eds., ed. M. Iye and A. F. Moorwood, 534.
- Dessauges-Zavadsky et al. (2006) Dessauges-Zavadsky, M. et al. 2006, A&A, 445, 93.
- Dong, Lin & Murray (2003) Dong, S., Lin, D. N. C., and Murray, S. D. 2003, ApJ, 596, 930.
- Erb et al. (2006) Erb, D. K. et al. 2006, ApJ, 644, 813.
- Fiore et al. (2005) Fiore, F. et al. 2005, ApJ, 624, 853.
- Fruchter et al. (2006) Fruchter, A. S. et al. 2006, Nature, 441, 463.
- Fynbo et al. (2006) Fynbo, J. P. U. et al. 2006, A&A, 451, L47.
- Haehnelt, Steinmetz & Rauch (1998) Haehnelt, M. G., Steinmetz, M., and Rauch, M. 1998, ApJ, 495, 647.
- Haehnelt, Steinmetz & Rauch (2000) Haehnelt, M. G., Steinmetz, M., and Rauch, M. 2000, ApJ, 534, 594.
- Herbert-Fort et al. (2006) Herbert-Fort, S. et al. 2006, PASP, 118, 1077.
- Jedamzik & Prochaska (1998) Jedamzik, K. and Prochaska, J. X. 1998, MNRAS, 296, 430.
- Kauffmann (1996) Kauffmann, G. 1996, MNRAS, 281, 475.
- Kawai et al. (2006) Kawai, N. et al. 2006, Nature, 440, 184.
- Kobulnicky & Kewley (2004) Kobulnicky, H. A. and Kewley, L. J. 2004, ApJ, 617, 240.
- Lanzetta & Bowen (1990) Lanzetta, K. M. and Bowen, D. 1990, ApJ, 357, 321.
- Lanzetta & Bowen (1992) Lanzetta, K. M. and Bowen, D. V. 1992, ApJ, 391, 48.
- Le Floc’h et al. (2003) Le Floc’h, E. et al. 2003, A&A, 400, 499.
- Ledoux et al. (2006) Ledoux, C. et al. 2006, A&A, 457, 71.
- Ledoux, Petitjean & Srianand (2003) Ledoux, C., Petitjean, P., and Srianand, R. 2003, MNRAS, 346, 209.
- Lee et al. (2006) Lee, H. et al. 2006, ApJ, 647, 970.
- Lehner & Howk (2007) Lehner, N. and Howk, J. C. 2007, ArXiv Astrophysics e-prints.
- Mac Low & Ferrara (1999) Mac Low, M.-M. and Ferrara, A. 1999, ApJ, 513, 142.
- Maller et al. (2000) Maller, A. et al. 2000, in ASP Conf. Ser. 200: Clustering at High Redshift, ed. A. Mazure, O. Le Fèvre, and V. Le Brun, 430.
- Maller et al. (2001) Maller, A. H. et al. 2001, MNRAS, 326, 1475.
- Maller et al. (2003) Maller, A. H. et al. 2003, MNRAS, 343, 268.
- McDonald & Miralda-Escudé (1999) McDonald, P. and Miralda-Escudé, J. 1999, ApJ, 519, 486.
- Metzger et al. (1997) Metzger, M. R. et al. 1997, Nature, 387, 879.
- Mirabal et al. (2002) Mirabal, N. et al. 2002, ApJ, 578, 818.
- Mo, Mao & White (1998) Mo, H. J., Mao, S., and White, S. D. M. 1998, MNRAS, 295, 319.
- Mo & Miralda-Escude (1996) Mo, H. J. and Miralda-Escude, J. 1996, ApJ, 469, 589.
- Möller, Fynbo & Fall (2004) Möller, P., Fynbo, J. P. U., and Fall, S. M. 2004, A&A, 422, L33.
- Møller et al. (2002) Møller, P. et al. 2002, ApJ, 574, 51.
- Murphy et al. (2007) Murphy, M. T. et al. 2007, ArXiv Astrophysics e-prints.
- Nagamine et al. (2005) Nagamine, K. et al. 2005, ArXiv Astrophysics e-prints.
- Nulsen, Barcons & Fabian (1998) Nulsen, P. E. J., Barcons, X., and Fabian, A. C. 1998, MNRAS, 301, 168.
- Pettini et al. (2002) Pettini, M. et al. 2002, ApJ, 569, 742.
- Pettini et al. (2001) Pettini, M. et al. 2001, ApJ, 554, 981.
- Pettini et al. (1994) Pettini, M. et al. 1994, ApJ, 426, 79.
- Piranomonte et al. (2007) Piranomonte, S. et al. 2007, A&A.
- Prochaska (1999) Prochaska, J. X. 1999, ApJ, 511, L71.
- Prochaska, Chen & Bloom (2006) Prochaska, J. X., Chen, H.-W., and Bloom, J. S. 2006, ApJ, 648, 95.
- Prochaska et al. (2007) Prochaska, J. X. et al. 2007a, ApJS, 168, 231.
- Prochaska, Chen & Bloom (2007) Prochaska, J. X., Chen, H.-W. Dessauges-Zavadsky, M., and Bloom, J. S. 2007, ApJ. submitted.
- Prochaska et al. (2003) Prochaska, J. X. et al. 2003, ApJ, 595, L9.
- Prochaska et al. (2002) Prochaska, J. X. et al. 2002, PASP, 114, 933.
- Prochaska, Herbert-Fort & Wolfe (2005) Prochaska, J. X., Herbert-Fort, S., and Wolfe, A. M. 2005, ApJ, 635, 123.
- Prochaska & Wolfe (1997) Prochaska, J. X. and Wolfe, A. M. 1997, ApJ, 487, 73.
- Prochaska & Wolfe (1998) Prochaska, J. X. and Wolfe, A. M. 1998, ApJ, 507, 113.
- Prochaska & Wolfe (2001) Prochaska, J. X. and Wolfe, A. M. 2001, ApJ, 560, L33.
- Prochaska et al. (2007) Prochaska, J. X. et al. 2007b, ArXiv Astrophysics e-prints.
- Prochter et al. (2006) Prochter, G. et al. 2006, In prep.
- Prochter, Prochaska & Burles (2006) Prochter, G. E., Prochaska, J. X., and Burles, S. M. 2006, ApJ, 639, 766.
- Rao, Turnshek & Nestor (2006) Rao, S. M., Turnshek, D. A., and Nestor, D. B. 2006, ApJ, 636, 610.
- Razoumov et al. (2006) Razoumov, A. O. et al. 2006, ApJ, 645, 55.
- Savage, Sembach & Lu (1997) Savage, B. D., Sembach, K. R., and Lu, L. 1997, AJ, 113, 2158.
- Savaglio, Fall & Fiore (2003) Savaglio, S., Fall, S. M., and Fiore, F. 2003, ApJ, 585, 638.
- Savaglio et al. (2005) Savaglio, S. et al. 2005, ApJ, 635, 260.
- Schaye (2001) Schaye, J. 2001, ApJ, 559, L1.
- Sheinis et al. (2000) Sheinis, A. I. et al. 2000, in Proc. SPIE Vol. 4008, p. 522-533, Optical and IR Telescope Instrumentation and Detectors, Masanori Iye; Alan F. Moorwood; Eds., 522.
- Shin et al. (2006) Shin, M.-S. et al. 2006, ArXiv Astrophysics e-prints.
- Spitzer (1990) Spitzer, L. J. 1990, ARA&A, 28, 71.
- Steidel (1993) Steidel, C. C. 1993, in ASSL Vol. 188: The Environment and Evolution of Galaxies, ed. J. M. Shull and H. A. Thronson, 263.
- Steidel et al. (2002) Steidel, C. C. et al. 2002, ApJ, 570, 526.
- Steidel & Sargent (1992) Steidel, C. C. and Sargent, W. L. W. 1992, ApJS, 80, 1.
- Tassis, Kravtsov & Gnedin (2006) Tassis, K., Kravtsov, A. V., and Gnedin, N. Y. 2006, ArXiv Astrophysics e-prints.
- Thoene et al. (2006) Thoene, C. C. et al. 2006, ArXiv Astrophysics e-prints.
- Tremonti et al. (2004) Tremonti, C. A. et al. 2004, ApJ, 613, 898.
- Tumlinson et al. (2007) Tumlinson, J. et al. 2007, In prep.
- Vladilo et al. (2001) Vladilo, G. et al. 2001, ApJ, 557, 1007.
- Vogt et al. (1994) Vogt, S. S. et al. 1994, in Proc. SPIE Instrumentation in Astronomy VIII, David L. Crawford; Eric R. Craine; Eds., Volume 2198, p. 362, 362.
- Vreeswijk et al. (2004) Vreeswijk, P. M. et al. 2004, A&A, 419, 927.
- Vreeswijk et al. (2006) Vreeswijk, P. M. et al. 2006, A&A, 447, 145.
- Watson et al. (2006) Watson, D. et al. 2006, ApJ, 652, 1011.
- Wolfe, Gawiser & Prochaska (2005) Wolfe, A. M., Gawiser, E., and Prochaska, J. X. 2005, ARA&A, 43, 861.
- Wolfe et al. (1995) Wolfe, A. M. et al. 1995, ApJ, 454, 698.
- Wolfe & Prochaska (1998) Wolfe, A. M. and Prochaska, J. X. 1998, ApJ, 494, L15+.
- Wolfe & Prochaska (2000) Wolfe, A. M. and Prochaska, J. X. 2000a, ApJ, 545, 591.
- Wolfe & Prochaska (2000) Wolfe, A. M. and Prochaska, J. X. 2000b, ApJ, 545, 603.
- Wolfe, Prochaska & Gawiser (2003) Wolfe, A. M., Prochaska, J. X., and Gawiser, E. 2003, ApJ, 593, 215.
- Wolfe et al. (1986) Wolfe, A. M. et al. 1986, ApJS, 61, 249.
- Zibetti et al. (2007) Zibetti, S. et al. 2007, ApJ, 658, 161.
- Zwaan & Prochaska (2006) Zwaan, M. A. and Prochaska, J. X. 2006, ApJ, 643, 675.