Are Swift gamma–ray bursts consistent with the Ghirlanda relation?
A few tight correlations linking several properties of gamma–ray bursts (GRBs), namely the spectral peak energy, the total radiated energy, and the afterglow break time, have been discovered with pre-Swift GRBs. They were used to constrain the cosmological parameters, together with type-Ia supernovae. However, the tightness of these correlations is a challenge to GRB models. We explore the effect of adding Swift bursts to the Ghirlanda and Liang-Zhang relations. Although they are both still valid, they become somewhat weakened mostly due to the presence of significant outliers, which otherwise are apparently normal GRBs so difficult to distinguish. The increased dispersion of the relations makes them less reliable for purposes of precision cosmology.
Key Words.:
Gamma rays: bursts – Radiation mechanisms: non-thermal – X-rays: general1 Introduction
Gamma–ray bursts (GRBs) release a huge amount of energy in a short amount of time, making them the brightest sources in the gamma–ray sky. Following these explosions, a residual emission, the afterglow, is observed at X–ray and, often, at UV-optical-IR wavelengths (see van Paradijs et al. 2000 and Zhang & Mészáros 2004 for reviews). Given the involved energies, GRBs represent the brightest objects in the Universe and can therefore be detectable up to very high redshifts. In contrast to type-Ia supernovae, which are good cosmological rulers up to redshift (e.g. Perlmutter et al. 1999; Riess et al. 2004), it has been speculated that GRBs are promising standard candles for a high redshift universe, and attempts to use GRB properties to indicate distances have been pursued in the past.
Based on samples of varying size, the isotropic-equivalent burst luminosities were found to be correlated with the temporal variability (smooth bursts are intrinsically less luminous; Fenimore & Ramirez-Ruiz 2000; Reichart et al. 2001; Guidorzi et al. 2005) and anti-correlated with the spectral time lags (the times elapsing between the light curve at higher and lower energies; Norris et al. 2000). There were also encouraging results when considering spectral properties. Amati et al. (2002) found a correlation between the rest-frame peak energy and the isotropic-equivalent energy released during the prompt phase . This correlation, initially based on 10 GRBs with known redshift, was later updated and confirmed using a sample of 41 GRBs (Amati 2006, 2007; see however Band & Preece 2005; Nakar & Piran 2005). The Amati relation has been used for a number of statistical studies to derive the redshift of GRBs with known peak energy and fluence (e.g. Atteia 2003; Liang et al. 2004). However, the relatively large scatter results in poorly constrained redshifts (especially for high values). This indicates that the Amati relation is not tight enough for cosmological studies (e.g. Li 2006). To date, there are two known outliers of the Amati relation, namely GRB 980425 and GRB 031203. These bursts are peculiar in several respects, since they are very close (), underluminous with respect to most other events, and they have peculiar afterglows (e.g. Woosely & Bloom 2006). Driven by the observation that XRF060218 showed a strong spectral evolution during its prompt emission phase (Campana et al. 2006), and that the mean peak energy is consistent with the Amati relation (Amati et al. 2007), Ghisellini et al. (2006) speculate that these two outliers may also be consistent with the Amati relation, if a strong spectral evolution took place.
A significant step forward was performed by Ghirlanda et al. (2004a). Since GRBs are believed to originate inside jets (with half-opening angle ), they considered the collimation-corrected energy instead of the isotropic-equivalent value. Remarkably, based on a set of 15 GRBs (now expanded to 18; Nava et al. 2006), is much more tightly correlated with than is (see also Friedman & Bloom 2005). With such tightness, Ghirlanda et al. (2004b) combined 15 GRBs with data from type-Ia supernovae and were able to constrain the cosmological parameters (see also Xu et al. 2005 and Schaefer 2007 and references therein). To infer the jet collimation degree, is computed from the time at which the afterglow light curve steepens (Rhoads et al. 1999; Sari et al. 1999; Chevalier & Li 2000). There are two possible cases, depending on the density profile of the medium surrounding the GRB source, which is usually assumed either homogeneous (interstellar medium, ISM) or wind-shaped (, wind). In particular, we have (Sari et al. 1999; Chevalier & Li 2000)
| (1) |
where is the break time in days, the radiation efficiency, , is the ambient particle density in cm-3, and is the wind constant.
The Ghirlanda relation is tight in both cases, with a logarithmic dispersion of 0.10 dex (0.08 dex) in the ISM (wind) case; in comparison, the Amati relation has a dispersion of 0.4 dex. It is not straightforward to compare GRB 980425 and GRB 031203 with the Ghirlanda relations, since their collimation degree is unknown, but it looks likely that these events are outliers for them as well. We also note that the Ghirlanda relation is intimately connected with the jet break interpretation. The standard jet break theory predicts a variation in the decay index of and a decay index after the break . These predictions are loosely satisfied by the pre-Swift sample. By taking the full analysis of Zeh, Klose & Kann (2006), we find that only 3 GRBs of the 13 pre-Swift bursts available (5 GRBs do not have enough data) have a at level. Allowing a level we have 9 GRBs consistent with this constraint, leaving out 4 GRBs that do not satisfy these relations. In addition, 2 bursts definitely have () a decay which is shallower than 2. Several different explanations can address this issue as the uncertainty of sideways expansion physics (e.g. Panaitescu et al. 2005), different electron energy distributions ( value) for different GRBs, change in the microphysical parameters (), new energy injections, changing external medium, etc.
The need to estimate the jet angle through Eq. (1) somehow makes the Ghirlanda relations model-dependent. Recently, a lot of discussion has arisen concerning the interpretation of breaks in the afterglow light curves of GRBs discovered by Swift (e.g. Panaitescu et al. 2006; Sato et al. 2007; Willingale et al. 2007; Zhang 2006). For example, Panaitescu et al. (2006) present six optical/X-ray afterglows whose light curves clearly show a chromatic behavior, which cannot be due to a geometric effect. Liang & Zhang (2005) have previously pointed out that a purely phenomenological correlation (i.e. without any assumption on the nature of the breaks) exists between , , and , in the form . It should be noted that Liang & Zhang (2006) argue that the breaks in optical and X–ray bands may have different physical origins. They explicitly took from optical light curves (actually, this was also the case for most of the Ghirlanda sample). Nava et al. (2006) point out that the Ghirlanda and Liang-Zhang relations are mutually consistent, provided that (as their data support).
During the past two years, the GRB field has been revolutionized by Swift. More than 200 long-duration GRBs have been discovered and a secure redshift has been obtained for more than 50 (up to February 2006). Swift GRBs with known redshift are at a higher mean redshift than before (Jakobsson et al. 2006). GRBs at larger redshift might have different characteristics maybe related to metallicity’s impact on these correlations. Obviously it is very relevant to see how these new GRBs behave with respect to the Ghirlanda and Liang-Zhang relations. To this aim, three parameters are needed for each event, namely the redshift, the spectral peak energy, and the afterglow break time. The burst alert telescope (BAT) onboard Swift, which detects the bursts, covers a limited spectral energy range (15–350 keV), so that can only be determined in very few cases. However, some GRBs discovered by Swift can also be observed by other instruments, in particular by the Wind-Konus experiment, which has a useful energy range of 18–1160/21–1360 keV, or by HETE-2, Suzaku, and RHESSI. In this paper, we present a systematic search for all Swift bursts, which have the measurement of the three parameters needed for comparing them with the Ghirlanda and Liang-Zhang relations.
When this paper was submitted, we became aware of a similar paper (Ghirlanda et al. 2007). We have not carried out a detailed comparison between the two works but highlight a few differences in the following sections.
| GRB | Pred. | Pred. | ||||||||
| (keV) | (d) | (erg) | (deg) | (deg) | (erg) | (erg) | (d) | (d) | ||
| (1) | (2) | (3) | (4) | (5) | (6) | (7) | (8) | (9) | (10) | (11) |
| 050525A | 0.606 | 12710 | 0.30.1 | 52.530.03 | 4.00.7 | 3.71.0 | 49.910.15 | 49.860.16 | 0.5 | 0.5 |
| 050820A | 2.612 | 1325270 | 158 | 53.920.09 | 8.52.0 | 3.71.1 | 51.960.17 | 51.230.16 | 4.2 | 4.5 |
| 050922C | 2.198 | 415111 | 0.110.03 | 52.790.17 | 2.00.3 | 2.10.6 | 49.550.23 | 49.620.27 | 5.4 | 5.7 |
| 051109A | 2.346 | 539381 | 0.600.10 | 52.700.22 | 3.70.4 | 3.40.6 | 50.020.26 | 49.940.32 | 11 | 12 |
| 060124 | 2.297 | 636162 | 1.130.09 | 53.620.06 | 3.60.5 | 2.30.6 | 50.930.09 | 50.540.15 | 1.8 | 2.0 |
| 060206 | 4.045 | 38198 | 0.60.2 | 52.760.08 | 3.10.6 | 2.90.8 | 49.930.17 | 49.880.19 | 7.6 | 8.0 |
| 060526 | 3.21 | 10521 | 2.770.30 | 52.410.05 | 5.50.4 | 3.90.5 | 50.230.08 | 50.070.11 | 0.3 | 0.3 |
| 060614 | 0.125 | 5545 | 1.390.04 | 51.400.22 | 11.10.9 | 11.51.8 | 49.670.25 | 49.700.31 | 0.3 | 0.3 |
| 050318 | 1.44 | 11525 | 0.26 | 52.410.03 | 3.3 (0.7) | 3.5 (0.6) | 49.63 (0.22) | 49.68 (0.20) | 0.8 | 0.9 |
| 050401 | 2.90 | 50153 | 13 | 53.610.08 | 8.5 (2.0) | 4.1 (1.2) | 51.66 (0.16) | 51.03 (0.15) | 1.4 | 1.5 |
| 050416A | 0.653 | 25.14.2 | 4.7 | 51.080.07 | 16.7 (3.8) | 17.0 (5.0) | 49.70 (0.15) | 49.72 (0.15) | 0.6 | 0.6 |
| 050603 | 2.821 | 1333107 | 2.5 | 53.850.03 | 4.3 (1.0) | 2.4 (0.7) | 51.30 (0.22) | 50.79 (0.20) | 5.3 | 5.7 |
| 060418 | 1.489 | 572114 | 5 | 52.950.05 | 8.5 (2.0) | 5.3 (1.6) | 51.00 (0.23) | 50.59 (0.20) | 5.3 | 5.6 |
| 060927 | 5.6 | 473116 | 0.16 | 52.920.09 | 1.6 (0.4) | 1.8 (0.5) | 49.54 (0.25) | 49.61 (0.23) | 10 | 11 |
| 061007 | 1.261 | 90243 | 1.74 | 54.000.04 | 5.3 (1.2) | 2.6 (0.8) | 51.47 (0.15) | 50.90 (0.14) | 1.0 | 1.1 |
| 061121 | 1.314 | 1288153 | 3.5 | 53.360.04 | 6.8 (1.6) | 3.9 (1.1) | 51.21 (0.23) | 50.73 (0.20) | 1.8 | 1.9 |
(1) – GRB name. (2) – redshift. (3) – Rest-frame spectrum peak energy. (4) – Observed break time in the optical band and in the observer frame. (5) – Isotropic-equivalent bolometric energy. (6),(7) – Jet opening angle computed for homogeneous and wind environments. (8),(9) – Beaming-corrected energy for the homogeneous and wind cases. (10),(11) – Predicted break time assuming the Ghirlanda relation as computed by Nava et al. (2006) after correcting for a small typo in the published relation (Nava, private communication).
GRB060614 is not used in the analysis described in the text, but it is reported here for completeness.
2 Sample selection
We collected all long-duration GRBs detected by Swift that have a secure (spectroscopic) redshift and a published peak energy . We found 19 events satisfying this criterium. We thus inspected their afterglow light curve looking for breaks. Due to the unclear multi-wavelength behavior of these breaks, we did not look at X–ray or radio data. This is mainly dictated by the fact that, when the Ghirlanda relation (and similar works) was found, no simultaneous optical and X–ray light curve existed. This choice (sticking to optical light curves) also guarantees an unbiased extension of the Ghirlanda relation. In any case, when describing the GRBs below, we outline when differences from the standard jet model are occurring. We end up with eight GRBs that have a reliable measurement of (GRB 060614 is not used however). For eight more, we can only provide a lower limit to this parameter. For the other three there is not published information (yet) to constrain it. To compute the beaming-corrected energy, we first need the isotropic-equivalent value. Recently, Amati (2006, 2007) listed the values of and for 18 Swift bursts, and we adopted his values whenever available. In other cases, we resorted to values published in the GCNs111See http://gcn.gsfc.nasa.gov . (see below), computing a bolometric correction when necessary. Following Ghirlanda et al. (2004), for all bursts we assumed an external density cm-3 and a wind parameter (for both quantities we also introduced an error of ). When dealing with lower limits in the break times, we conservatively assumed a error on that limit. In addition, we consider the errors in logarithmic space by taking the left/right error closer to the best fit line (this has been done also for GRBs in the Nava’s sample). Below we summarize their properties and all the values are reported in Table 1.
GRB 050318 was observed by Swift and the BAT was able to determine the peak energy (Perri et al. 2005). From the UVOT data, one can determine a lower limit on the time of a possible break in the optical light curve of 0.26 d (Still et al. 2005). In the X–ray, a break around 0.2 d is also seen (Perri et al. 2005).
GRB 050401 was observed both by Swift-BAT and Wind-Konus. We take for the average of the two values presented by Golenetskii et al. (2005a). In the optical, the well-monitored light curve (Rykoff et al. 2005; Watson et al. 2006) showed a slow, uninterrupted decay up to 13 d after the burst. In the X–ray band, the afterglow was observed up to 11.6 d after the trigger (De Pasquale et al. 2005), revealing a break at d (a value inconsistent with the Ghirlanda relation; De Pasquale et al. 2005). Ghirlanda et al. (2007) indicate a possible break in the optical light curve at d. We note that a simple power-law fit is able to reproduce all the observed optical data ( with 28 degrees of freedom, with a null hypothesis probability of ). We also tried to fit the same data with a smoothly-joined power-law without finding any statistical evidence of a break.
XRF 050416A has a well-defined X–ray light curve (Mangano et al. 2007a), showing the common steep-flat-steep behavior (Nousek et al. 2006; O’Brien et al. 2006). No additional breaks are visible between 0.017 and d after the GRB (Sakamoto et al. 2006; Mangano et al. 2007a). Thanks to its softness it was possible to compute the peak energy with BAT (Sakamoto et al. 2006). In the optical there are also no signs of a break in the light curve up to at least d (see the -band light curve presented by Holland et al. 2007; see also Soderberg et al. 2007). Ghirlanda et al. (2007) fitted the optical light curve, including a XRF 060218-like light curve (Campana et al. 2006). In their fit they find a break at d. We note that the SN presence is suggested by Soderberg et al. (2006) and they do not require the presence of a break in the light curve in their fit with the SN modeled with a SN1998bw template.
GRB 050525A was a bright burst observed by Swift and Wind-Konus (Blustin et al. 2005; Golenetskii et al. 2005b). It has already been included in the sample of Nava et al. (2006). Several groups (Blustin et al. 2005; Mirabal et al. 2005; Della Valle et al. 2006a) report a break in the optical about 0.3 d after the GRB. We adopt here d, which is the average of the values found by these authors (see also Nava et al. 2006). In the X–ray band, a break was also detected, at about the same time as the optical one, suggesting a jet origin for this afterglow (Blustin et al. 2005). Sato et al. (2007), however, question this interpretation, since the post-break decay indices were different in the optical and X–ray bands, contrary to model expectations, and the decay index after the break is too shallow in the X–ray and optical bands.
The X–ray light curve of the GRB 050603 afterglow was a simple power law between 0.4 and 7 d after the GRB (Grupe et al. 2006). The peak energy was estimated through Wind-Konus observations (Golenetskii et al. 2005c). UVOT observed the optical afterglow as well, showing no breaks within the interval 0.4–2.5 d (Grupe et al. 2006). A slope was found by UVOT, consistent with the XRT one. Given the relatively steep value, it is unclear whether a break should have appeared before or after the Swift observations. The Ghirlanda relation would predict a jet break time around 4–7 d, so we consider d.
GRB 050820A was a bright burst with large and (Wind-Konus, Cenko et al. 2006). The X–ray light curve of GRB 050820A shows the usual triple power-law behavior. A lower limit to any further break in the X–rays can be set to d. The optical light curve tracks the X–ray one, but thanks to late-time HST images a break is detected at very late times, and its timing is difficult to constrain. Using the data from Cenko et al. (2006) and allowing for a late-time temporal slope in the range , one gets d. This is consistent with the value d found by Cenko et al. (2006) which imposed .
The X–ray and optical light curves of GRB 050922C have been presented by Panaitescu et al. (2006). Both the X–ray and optical light curves show a break, but at different times. A multi-band fit of the UVOT optical data provides a break time at hr (Li et al. 2005; see also Andreev et al. 2005). The currently published data show no further breaks up to d. The peak energy was estimated by HETE-2 observations (Crew et al. 2005), even if Wind-Konus has failed to reveal an exponential cut-off (Golenetskii et al. 2005d).
GRB 051109A was discovered by Swift and also observed by Wind-Konus (Golenetskii et al. 2005e). The sparse optical data constrain the break time to be d (Pavlenko et al. 2005). More recently Yost et al. (2007), suggested the presence of a break occurring at d in the optical light curve. This break however does not coincide with an X–ray break and is interpreted as a cooling break.
GRB 060124 is an astonishing burst. Swift was triggered by the precursor, allowing to study in detail the prompt phase with CCD X–ray spectroscopy for the first time (Romano et al. 2006). In the X–ray band, a break in the light curve occurs at d. At variance with many other Swift GRBs, a break in the optical light curve was observed nearly simultaneously with the X–ray break at d (D. A. Kann, priv. comm.; see also Curran et al. 2007). The spectral peak energy was computed by simultaneously fitting Wind-Konus and BAT data (Romano et al. 2006); note that the value reported by HETE-2 (Lamb et al. 2006) is slightly higher, but still consistent with the adopted value. Also in this case, the X–ray decay index after the break is too shallow for a jet break.
The late optical and X–ray light curves of GRB 060206 have been published by Monfardini et al. (2006) and Stanek et al. (2006). In both bands the light curve is complex, but a clear break in the optical curve can be detected at d. The light curve then goes on uninterrupted until at least 2.3 d (Stanek et al. 2006; Monfardini et al. 2006). We take the and from the value measured by Swift-BAT (Palmer et al. 2006).
The X–ray light curve of GRB 060418 shows several bright flares. On the other hand, the optical/NIR light curve is smooth (Molinari et al. 2007), with no breaks between s and d. The and values have been taken from the Konus data (Golenetskii et al. 2006a).
GRB 060526 was discovered by Swift, showing two strong flares just after the main event. A simultaneous break in the optical and X-ray light curves is observed at d (Dai et al. 2007). The bolometric source flux and the peak energy were taken by Schaefer (2007).
GRB 060614 was a remarkable low-redshift burst that did not show supernova signatures down to very deep limits (Della Valle et al. 2006b; Fynbo et al. 2006a; Gal-Yam et al. 2006). The early-time light curve was complex, but, remarkably, VLT and Swift-XRT data show an achromatic break at d (Mangano et al. 2007b). The peak energy of this event is constrained by the Wind-Konus data (Golenetskii et al. 2006b), which present a time-resolved analysis. Amati et al. (2007) have estimated the average to lie in the range 10–100 keV range. Since the BAT spectrum shows no deviation from a power-law (Gehrels et al. 2006) in the range 15–150 keV, we further assumed keV. We took the value of from Amati et al. (2007). Given the lack of a bright supernova, however, there is an ongoing debate about whether this GRB is related to a massive progenitor or to a merging of two compact objects (Gehrels et al. 2006; Zhang et al. 2006). Since the Amati and Ghirlanda relations hold for long GRBs, we do not consider this burst in the following.
GRB 060927 was a high-redshift burst at (Fynbo et al. 2006b). The Swift observations allow to be constrained inside the BAT range. We computed the rest-frame 1–10000 keV fluence by employing the spectral parameters provided by Stamatikos et al. (2006) and found erg. The optical data only imply a limit d (e.g. Antoniuk et al. 2006). The X–ray light curve shows a break at d (Troja et al. 2006).
The X–ray and optical light curves of GRB 061007 consist of a single power law starting soon after the burst. Current limits show and 1.7 d after the GRB in the X–ray and optical bands, respectively (Mundell et al. 2007; Schady et al. 2007). Schady et al. (2007) suggest that a break might have occurred before the start of the XRT and UVOT observations (72 s after the burst). However, ROTSE observations starting 26 s after the burst trigger imply a rising flux between the two measurements, making this hypothesis unlikely. Thus we chose d. We took and from Golenetskii et al. (2006c), whose results are consistent with the RHESSI values (Wigger et al. 2006). We note that Suzaku-WAM found a larger (Yamaoka et al. 2006).
GRB 061121 showed a break at X–ray wavelengths at 3 ks after the GRB (Page et al. 2006). In the optical band, there is a possible rebrightening at ks, and the decay is then regular up to d (Halpern & Armstrong 2006; Efimov et al. 2006). Determining the location of a break is complicated by the presence of a bright host galaxy (Malesani et al. 2006; Cobb 2006). We took the average of the values as found by Wind-Konus (Golenetskii et al. 2006d) and RHESSI (Bellm et al. 2006).
There are three more GRBs with measured and , namely GRB 060115, GRB 060218, and GRB 060707. For these bursts, it is however impossible to measure a break time, due to the small amount of available data or to the presence of SN 2006aj in the case of GRB 060218 (e.g. Campana et al. 2006; Pian et al. 2006). We encourage observers with available data to provide a measurement for the break time of these bursts.
The values that we adopted for the optical break times are strictly compliant to the selection made by Ghirlanda et al. (2004a). The assumed error budget is conservative. By taking the limits from the Swift X–ray light curves (which often extend much further in time), we would find even tighter limits, as recently shown by Sato et al. (2007) for a subsample of our GRBs.
3 Analysis and results
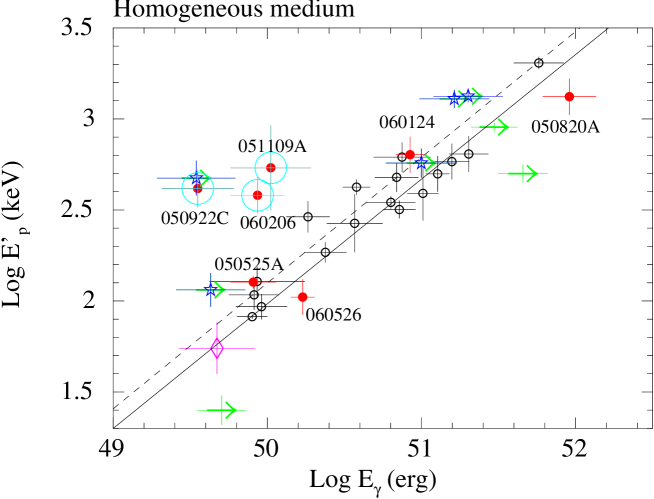
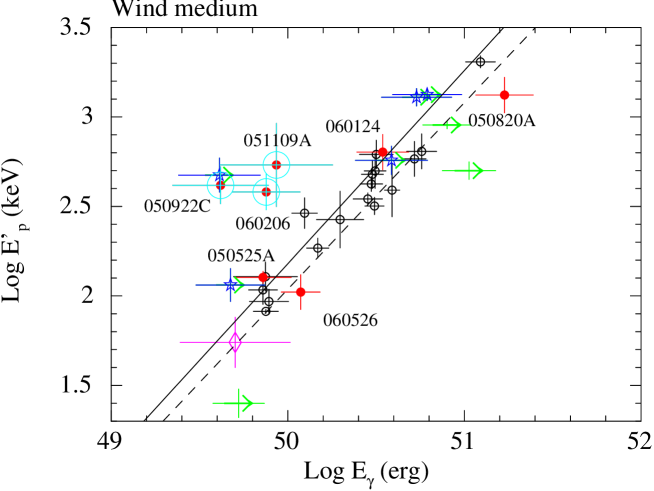
We added the new Swift bursts to the sample of 18 events presented by Nava et al. (2006). We note that GRB 050525A is common to both samples. There are eight Swift bursts with a measurement of , and (GRB 060614 is not used however), plus eight events with a lower limit on . In Fig. 1 and 2 we show the Swift bursts in the vs. plane.
We repeated the analysis carried out by Nava et al. (2006) on their sample using the routine fitexy of Press et al. (2003) and fit the Ghirlanda relation to their data for both the ISM and wind cases. We obtained consistent results (see Table 2), adopting the value of cm-3 for the circumburst density and % for the gamma–ray efficiency for all events.
Before starting the statistical analysis, we observed that five bursts with lower limits on the break time lie at the left of the best-fit Ghirlanda relation (GRB 050318, GRB 050603, GRB 060418, GRB 060927 and GRB 061121, see Figs. 1 and 2). Since they have only lower limits on the corrected energy and are consistent with the relation, they are not considered in the fit.
We were left with 27 GRBs. As can be seen in Figs. 1 and 2, there are significant outliers to the relation. Adopting the routine fitexy, we derived a reduced (25 dof) for the homogeneous ISM relation (null hypothesis probability of ) and a reduced (25 dof) for a wind ISM relation (null hypothesis probability of ). We note that our limits are conservative, since we had treated the lower limits on as actual measurements. If the breaks occurred significantly later than these limits, many of the bursts marked by arrows in Figs. 1 and 2 would move rightward in the plot, even more increasing the scatter in the correlation.
Given the concerns about using the Ghirlanda relation in terms of the jet interpretation, we also fitted the model-independent Liang-Zhang relation to the bursts in the sample. Again, by including only the events listed in the Nava et al. (2006) sample, we found consistent results with what they found, albeit with a slightly larger (see Table 2). Using the data as listed in the Tables 1 and 3 of Firmani et al. (2006), we find a significantly larger , which is entirely due to GRB 050525A (variation in the reduced from 0.83 to 2.46). We then added the Swift bursts to the sample, and again found that the relation worsened significantly. Moreover, the exponent in the Liang-Zhang relation is now ( confidence level), significantly different from the value needed to make the Ghirlanda and Liang-Zhang relations mutually consistent (Nava et al. 2006).
| Correlation | Nava [our] analysis | Swift data | Swift data achromatic breaks | Swift data pure breaks |
|---|---|---|---|---|
| (dof) | (dof) | (dof) | (dof) | |
| Ghirlanda ISM | 1.40 [1.42] (16) | 3.82 (25) | 2.35 (22) | 2.33 (20) |
| Ghirlanda wind | 1.13 [1.13] (16) | 3.09 (25) | 2.00 (22) | 1.72 (20) |
| Liang & Zhang∗ | 1.49 [1.81] (15) | 4.56 (24) | 2.44 (21) | 2.37 (19) |
∗ The logarithmic errors in this case have been evaluated as the mean of the lower and higher errors.
4 Discussion and conclusions
We have investigated in detail the addition of Swift bursts to the Ghirlanda and Liang-Zhang relations. Given the narrow energy band of the BAT instrument, only a small fraction of the GRBs so far discovered by Swift precisely determine the peak energy needed for the comparison with the Ghirlanda correlation. Putting together data from different instruments (mostly Wind-Konus, and occasionally HETE-2, RHESSI, and Suzaku) and including the few bursts for which a prompt measurement of was provided by BAT, we find a total of 19 GRBs. Of these, eight have a determination of the optical light curve break (seven are used), eight have a lower limit (three are used), and three not have enough (published) optical data to constrain it.
With the inclusion of these nine new GRBs (one was already in the Nava sample), the Ghirlanda correlation suffers from a worsening. Fitting the data, the reduced goes from 1.1 (1.1) to 3.8 (3.1) in the case of a homogeneous (wind) medium (see Table 2). The correlation is clearly still present, but it is not as tight as suggested in previous works. Its use for cosmological purposes is thus weakened. Actually, Spearman’s and Kendall’s (tau) correlation tests give a relatively weak probability of correlation on the Swift sample (seven objects). With these tests we obtain correlation probabilities of for both homogeneous and wind cases, to be compared with – for the pre-Swift sample.
In Table 1 we also report the predicted break times based on the Ghirlanda relation in order to see if there are corresponding breaks in the X–ray light curves. On average the predicted breaks do not occur in concordance with X–ray breaks. This means that even when considering breaks in the X–ray light curves, we are not able to reconcile the observed times with the ones predicted by the Ghirlanda relation.
The optical light curves of bursts discovered by Swift are significantly more complex than previously thought (e.g. Stanek et al. 2006; Gal-Yam et al. 2006). One might therefore speculate that the breaks observed in some of the strong outliers are different from those responsible for the existence of the Ghirlanda correlation. For example, GRB 050922C and GRB 060206 had breaks both in the optical and in the X–ray light curves, but at different times (Panaitescu et al. 2006; Stanek et al. 2006). The use of these breaks (so-called chromatic breaks) for the Ghirlanda relation is not appropriate in principle, since a jet break produces an achromatic steepening. Only GRB 060124, GRB 050525A and GRB 060614 show evidence for an achromatic break at a known redshift. Recently, several papers suggest a different origin of the X–ray and optical emission (Uhm & Belobodorov 2007; Grenet, Daigne & Mochkovitch 2007; Ghisellini et al. 2007), so that the need for achromatic breaks might be relaxed.
Optical breaks not coincident with X–ray breaks might have been missed before the launch of Swift due to the lack of X–ray coverage. For the outliers lying above (below) the correlation, a further break at later (earlier) times (the true “jet-break”) would be necessary in order to reconcile them with the Ghirlanda relation. This does not always look like a viable solution. For example, considering outliers in the upper part of the – plane, GRB 060206 showed a steep decay () after d (Monfardini et al. 2006; Stanek et al. 2006), similar to many of the breaks used to build the original Ghirlanda relation. Even if no observations are available at late times, a further break appears unlikely. Late observations were probably secured (but not published) for GRB 050922C, which would be particularly interesting in this respect. Concerning the bursts lying on the right side of the correlation, early observations are available for GRB 050401 (Rykoff et al. 2005; Watson et al. 2006), which shows a remarkable, unbroken decay starting s after the burst. Thus, at least for this burst, we have strong “evidence for absence” of a break that might have reconciled GRB 050401 with the Ghirlanda relation.
In addition, considering only bursts with achromatic breaks and upper limits (i.e. we disregard GRB 050922C, GRB 051109A and GRB 060206; we retain GRB 050820A since we do not have information from the X–rays), the results of the fits are improved, with a reduced of 2.35 in the case of a homogeneous medium (null hypothesis probability of ) and with a reduced (null hypothesis probability of ) in the case of a wind medium. As described above, concerns have also been expressed on GRB 050525A and GRB 060124 since their post break decay index is too flat and the decay variation is less than one. We thus also consider the case of only GRB 050820A and GRB 060526 and the upper limits (pure breaks in Table 2). In this case we obtain a reduced of 2.33 for a homogeneous medium (null hypothesis probability of ) and (null hypothesis probability of ) for a wind medium.
One might speculate on whether the Swift bursts have peculiar properties. In this respect, it is interesting to note that neither GRB 050922C nor GRB 050603 (the two strongest outliers of the relation) have any particularity, in terms of their duration, spectral properties, and fluence in the Swift sample. A distinguishing property of Swift bursts as a sample is their average measured higher redshift (e.g. Jakobsson et al. 2006). The average redshift of the Swift burst introduced in our sample is , to be compared with for the events in the sample of Nava et al. (2006). This might hint at a possible evolutionary effect, possibly due to the the properties of the jet propagation inside the progenitor stars and then in their environment during the afterglow phase. The current sample is, however, still too limited to draw any strong conclusion.
Acknowledgements.
This work is supported by ASI grant I/R/039/04 and MIUR grant 2005025417. We thank S. Barthelmy and J. Greiner for maintaining their GRB web pages. We also thank D. Malesani and A. Kann for detailed discussions as well as G. Ghirlanda et al. (2007, astro-ph/0704.0234) for comments. This work has made use of the GRBlog database.References
- (1) Amati, L. 2002, A&A, 390, 81
- (2) Amati, L. 2006, MNRAS, 372, 233
- (3) Amati, L. 2007, proc. of “Swift and GRBs: Unveiling the Relativistic Universe” Nuovo Cimento C, in press (astro-ph/0611189)
- (4) Amati, L., Della Valle, M., Frontera, F., Malesani, D., Guidorzi, C., Montanari, E., & Pian, E. 2007, A&A, 463, 913
- (5) Andreev, M., Pozanenko, A., Loznikov, V., & Rumyantsev, V. 2005, GCN Circ. 4048
- (6) Antoniuk, K., Rumyantsev, V., & Pozanenko, A. 2006, GCN Circ. 5647
- (7) Atteia, J.-L. 2003, A&A, 407, L1
- (8) Band, D. L., & Preece, R. D. 2005, ApJ, 627, 319
- (9) Bellm, E., Bandstra, M., Boggs, S., Wigger, C., Hajdas, W., Smith, D. M., & Hurley, K. 2006, GCN Circ. 5838
- (10) Blustin, A. J., et al. 2005, ApJ, 637, 901
- (11) Campana, S., et al. 2006, Nature, 442, 1008
- (12) Cenko, S. B., et al. 2006, ApJ, 652, 490
- (13) Chevalier, R. A. & Li, Z.-Y. 2000, ApJ, 536, 195
- (14) Cobb, B. E. 2006, GCN Circ. 5878
- (15) Crew, G., et al. 2005, GCN Circ. 4021
- (16) Curran, P., Kann, D. A., Ferrero, P., Rol E., & Wijers, R. A. M. J. 2007, proc. of “Swift and GRBs: Unveiling the Relativistic Universe”, Il Nuovo Cimento C, in press (astro-ph/0610067)
- (17) Dai, X., et al. 2007, ApJ submitted (astro-ph/0609269)
- (18) Della Valle, M., et al. 2006a, ApJ, 642, L103
- (19) Della Valle, M., et al. 2006b, Nature, 444, 1050
- (20) De Pasquale, M., et al. 2006, MNRAS, 370, 1859
- (21) Efimov, Y., Rumyantsev, V., & Pozanenko, A. 2006, GCN Circ. 5870
- (22) Fenimore, E. E., & Ramirez-Ruiz, E. 2000, preprint (astro-ph/0004176)
- (23) Firmani, C., Ghisellini, G., Avila-Reese, V., & Ghirlanda, G. 2006, MNRAS, 370, 185
- (24) Friedman, A. S., & Bloom, J. S. 2006, ApJ, 627, 1
- (25) Fynbo, J. P. U., et al. 2006a, Nature, 444, 1047
- (26) Fynbo, J. P. U., Jakobsson, P., Jensen, B. L., Hjorth, J., Sollerman, J., Watson, D., Castro Cerón, J. M., Vreeswijk, P., & Andersen, M. I. 2006b, GCN Circ. 5651
- (27) Gal-Yam, A., et al. 2006, Nature, 444, 1053
- (28) Gehrels, N., et al. 2006, Nature, 444, 1044
- (29) Ghirlanda, G., Ghisellini, G., & Lazzati, D. 2004a, ApJ, 616, 331
- (30) Ghirlanda, G., Ghisellini, G., Lazzati, D., & Firmani, C. 2004b, ApJ, 613, L13
- (31) Ghirlanda, G., Nava, L., Ghisellini, G., & Firmani, C. 2007, A&A in press (astro-ph/0702352)
- (32) Ghisellini, G., Ghirlanda, G., Nava, L., & Firmani, C. 2007, ApJ submitted (astro-ph/0701430)
- (33) Golenetskii, S., Aptekar, R., Mazets, E., Pal’shin, V., Frederiks, D., & Cline, T. 2005a, GCN Circ. 3179
- (34) Golenetskii, S., Aptekar, R., Mazets, E., Pal’shin, V., Frederiks, D., & Cline, T. 2005b, GCN Circ. 3474
- (35) Golenetskii, S., Aptekar, R., Mazets, E., Pal’shin, V., Frederiks, D., & Cline, T. 2005d, GCN Circ. 3518
- (36) Golenetskii, S., Aptekar, R., Mazets, E., Pal’shin, V., Frederiks, D., & Cline, T. 2005d, GCN Circ. 4030
- (37) Golenetskii, S., Aptekar, R., Mazets, E., Pal’shin, V., Frederiks, D., & Cline, T. 2005e, GCN Circ. 4238
- (38) Golenetskii, S., Aptekar, S., Mazets, E., Pal’shin, V., Frederiks, D., Ulanov, M, & Cline, T. 2006a, GCN Circ. 4989
- (39) Golenetskii, S., Aptekar, S., Mazets, E., Pal’shin, V., Frederiks, D., Ulanov, M, & Cline, T. 2006b, GCN Circ. 5264
- (40) Golenetskii, S., Aptekar, R., Mazets, E., Pal’shin, V., Frederiks, D., & Cline, T. 2006c, GCN Circ. 5722
- (41) Golenetskii, S., Aptekar, R., Mazets, E., Pal’shin, V., Frederiks, D., & Cline, T. 2006d, GCN Circ. 5837
- (42) Grenet, F., Daigne, F., & Mochkovitch, R. 2007, MNRAS submitted (astro-ph/0701204)
- (43) Grupe, D., et al. 2006, ApJ, 645, 464
- (44) Guidorzi, C., Frontera, F., Montanari, E., Rossi, F., Amati, L., Gomboc, A., Hurley, K., & Mundell, C. G. 2005, MNRAS, 363, 315
- (45) Halpern, J., & Armstrong, E. 2006, GCN Circ. 5853
- (46) Holland, S. T., et al. 2007, AJ, 133, 122
- (47) Jakobsson, P., et al. 2006, A&A, 447, 897
- (48) Lamb, D. Q., et al. 2006, GCN Circ. 4601
- (49) Li, W., Jha, S., Filippnko, A. V., Bloom, J. S., Pooley, D., Foley, R. J., & Perley, D. A. 2005, GCN Circ. 4095
- (50) Liang, E., & Zhang, B. 2005, ApJ, 633, 611
- (51) Liang, E., et al. 2004, MNRAS, 354, 81
- (52) Liang, E., et al. 2006, ApJ, 653, L81
- (53) Malesani, D., et al. 2006, GCN Circ. 5877
- (54) Mangano, V., et al. 2007a, ApJ, 654, 403
- (55) Mangano, V., et al. 2007b, A&A submitted
- (56) Mirabal, N., Bonfield D., & Schawinski, K. 2005, GCN Circ. 3488
- (57) Molinari, E., et al. 2007, A&A submitted
- (58) Monfardini, A., et al. 2006, ApJ, 648, 1125
- (59) Moretti, A., Burrows, D. N., Campana, S., Chincarini, G., Tagliaferri, G. 2006, GCN 5194
- (60) Mundell, C. G., et al. 2007, ApJ, submitted (astro-ph/0610660)
- (61) Nakar, E., & Piran, T. 2006, MNRAS, 360, L73
- (62) Nava, L., Ghisellini, G., Ghirlanda, G., Tavecchio, F., & Firmani, C. 2006, A&A, 450, 471
- (63) Norris, J. P., Marani, G. F., & Bonnell, J. T. 2000, ApJ, 534, 248
- (64) Nousek, J. A., et al. 2006, ApJ, 642, 389
- (65) O’Brien, P.T., et al. 2006, ApJ, 647, 1213
- (66) Page, K., Sakamoto, T., Marshall, F. E., Barthelmy, S. D., Burrows, D. N., Roming, P., & Gehrels, N. 2006, GCN Report 15.1
- (67) Palmer, D., et al. 2006, GCN Circ. 4697
- (68) Panaitescu, A., Mészáros, P., Burrows, D., Nousek, J., Gehrels, N. O’Brien, P., & Willingale, R. 2006, MNRAS, 369, 2059
- (69) Pavlenko, E., Berezovsky, K., Rumyantsev, V., & Pozanenko, A. 2005, GCN Circ. 4273
- (70) Pian, E., et al. 2006, Nature, 442, 1011
- (71) Perlmutter, S., et al. 1999, ApJ, 517, 565
- (72) Perri, M., et al. 2005, A&A, 442, L1
- (73) Press, W. H., Teukolsky, S. A., Vetterling, W. T., & Flannery, B. P. 2003, Numerical Recipes in Fortran 77 (Cambridge: Cambridge Univ. Press)
- (74) Reichart, D. E., Lamb, D. Q., Fenimore, E. E.; Ramirez-Ruiz, E., Cline, T. L. & Hurley, K. 2001, ApJ, 552, 57
- (75) Riess, A. G., et al. 2004, ApJ, 607, 665
- (76) Rhoads, J. E. 1999, ApJ, 525, 737
- (77) Romano, P., et al. 2006, A&A, 456, 917
- (78) Rykoff, E., et al. 2005, ApJ, 634, 1166
- (79) Sakamoto, T., et al. 2006, ApJ, 636, L73
- (80) Sari, R., Piran, T., & Halpern, J. 1999, ApJ, 519, L17
- (81) Sato, G., et al. 2007, ApJ, in press (astro-ph/0611148)
- (82) Schady, P., et al. 2007, MNRAS, submitted (astro-ph/0611089)
- (83) Schaefer, B. E. 2007, ApJ, in press (astro-ph/0612285)
- (84) Soderberg, A. M., et al. 2007, ApJ, in press (astro-ph/0607511)
- (85) Stamatikos, M., et al. 2006, GCN Circ. 5639
- (86) Stanek, K. Z., et al. 2006, ApJ, 654, L21
- (87) Still, M., et al. 2005, ApJ, 635, 1187
- (88) Troja, E., Page, K. L., Burrows, D., & Barbier, L. 2006, GCN Circ. 5641
- (89) Uhm, L. Z., & Belobodorov, A. M. 2007, ApJ submitted (astro-ph/0701205)
- (90) van Paradijs, J., Kouveliotou, C., & Wijers, R.A.M.J. 2000, ARA&A, 38, 379
- (91) Xu, D., Dai, Z. G., & Liang, E. W. 2005, ApJ, 633, 603
- (92) Watson, D., et al. 2006, ApJ, 652, 1011
- (93) Wigger, C., Bellm, E., Bandstra, M., Boggs, S., Hajdas, W., & Smith, D. M. 2006, GCN Circ. 5725
- (94) Willingale, R., et al. 2007, ApJ, submitted (astro-ph/0612031)
- (95) Woosley, S. E., & Bloom, J. S. 2006, ARA&A, 44, 507
- (96) Yamoaoka, K., et al. 2006, GCN Circ. 5724
- (97) Yost, S. A., et al. 2007, ApJ in press (astro-ph/0611414)
- (98) Zeh, A., Klose, S., Kann, D. A. 2006, ApJ, 637, 889
- (99) Zhang, B. 2006, Ad.Sp.Res., submitted (astro-ph/0611774)
- (100) Zhang, B., & Mészáros, P. 2005, Int. J. Mod. Phys. A, 19, 2385
- (101) Zhang, B., Zhang, B.-B., Liang, E. W., Gehrels, N., Burrows, D. N., & Mészáros, P. 2006, ApJ, 655, L25