A Search for Radio Continuum Emission
Towards Long-period Variable Stars
Abstract
We hereby report on a sensitive search for radio continuum observations from a sample of 34 Mira and semi-regular variable stars. The main aim of this survey was to search for thermal free-free emission from post-shock ionised gas. Thirty-four stars were observed at 3- and 6-cm using the Australia Telescope Compact Array. Radio continuum emission was detected from one source only, the symbiotic Mira R Aqr. No continuum emission was detected from the other sources, with three-sigma upper limits of typically 0.3 mJy. From the upper limits to the radio flux densities, we have found upper limits to the gas brightness temperatures near two stellar radii at a characteristic size of cm. Upper limits to shock velocities have been estimated using a shock model. For the 11 nearest sources in our sample we obtain brightness temperatures below 6 000 K and shock velocities below 13 km s-1. For 11 out of 14 sources with previously published detections, the radio brightness temperatures are below 4 000 K. For an upper limit of 4 000 K, we estimate that the shock velocities at two stellar radii are below 10 km s-1.
keywords:
circumstellar matter – infrared: stars.1 Introduction
Mira variables are optically-visible long-period variable stars with large-amplitude pulsations () and stellar periods over 100 days. The stars have reached an advanced stage of evolution on the asymptotic giant branch (AGB). Miras typically have photospheric radii of R⊙, stellar luminosities of L⊙ and effective temperatures of 2 500 K.
During their evolution on the AGB, Miras develop increasingly strong stellar winds, in which mass is lost from their outer hydrogen envelopes, with mass-loss rates above 10-7 M⊙ yr-1 and outflow velocities of typically 8 km s-1. Such mass-loss plays a critical role in their subsequent stellar evolution, leading eventually to the formation of a white dwarf star and planetary nebula.
The circumstellar mass-loss of Miras and other related AGB stars is driven by radiation pressure on solid grains, which form in the extended hydrogen atmospheres at heights of several stellar radii. Once formed, the grains are rapidly accelerated outwards, while grain–gas collisions lead to an expanding circumstellar envelope (Goldreich & Scoville, 1976). The radiation pressure model is well established but the physical conditions and mass-loss processes within the grain formation zone, are poorly understood. It is generally accepted that the high mass-loss rates are related to the stellar pulsations and strong shock waves which propagate outwards during each pulsation cycle, increasing the mass density in the upper stellar atmospheres to a height where dust formation occurs (e.g. Wood & Kahn, 1977; Wood, 1979; Morris, 1987; Anandarao, Pottasch & Vaidya, 1993). Shock velocities in the optically visible photospheres have been estimated from hydrogen Balmer and metallic emission lines to be between 10 and 90 km s-1 (e.g. Fox, Wood & Dopita, 1984; Gillet et al., 1985b; Richter & Wood, 2001).
Rudnitskij (1990) and Luttermoser & Brown (1992) argued that at centimetre wavelengths, a post-shock partially-ionised layer, extending to several stellar radii, would emit optically thick thermal free-free emission. For a Mira variable at a distance of several hundred parsec, the expected peak flux density from such a layer would be several milli-Janskys which is easily detectable. In addition, thermal emission from the stellar photosphere and non-thermal radio emission associated with stellar flare activity might also be detectable.
So far, radio continuum emission has been detected from approximately 15 Miras and semi-regular variables (Section 4). Reid & Menten (1997) reported the detection of optically-thick thermal continuum emission from six nearby long-period variable stars. Their VLA radio flux densities are a factor of about two larger than expected for emission from the optical stellar photospheres alone. Reid & Menten (1997) provided a convincing model for their data in which the radio emission occurs from a ‘radio photosphere’, of about twice the optical diameter, where the gas temperature and density are approximately 1 600 K and cm-3 respectively. For these sources, the low radio brightness temperatures are not consistent with strong shock activity in the radio emitting regions. However, earlier radio studies of several sources, including R Aql, Cet and CW Leo (e.g. Woodsworth & Hughes, 1973, 1977; Spergel, Giuliani & Knapp, 1983; Estalella, Paredes & Rius, 1983; Knapp et al., 1995) reported much stronger radio flux densities, consistent with higher brightness temperatures.
In this paper we describe a survey in which we used the Australia Telescope Compact Array (ATCA) to search for radio continuum emission at and 6 cm from a sample of 34 Miras and semi-regular variables. The primary aim of this study was to use radio continuum flux densities or their upper limits as a means of investigating whether high radio brightness temperatures, consistent with strong shock activity, may be present in some sources.
2 Source Selection
2.1 Selection Criteria
A sample of 34 Miras and semi-regular variables was selected using the data in the Fourth edition of the General Catalogue of Variable Stars (Kholopov et al., 1986–1989). Of the 34 sources, 26 are southern Mira variables with declinations below and visual magnitudes at maximum brightness of . One of the selected Miras, R Aqr, is a well-known symbiotic binary star. In addition, three northern Miras, U Ori, U Her and R Aql were also observed: U Ori and U Her as they have well-studied OH maser properties (Chapman & Cohen, 1985; Chapman, Cohen & Saikia, 1991) and R Aql as it has been previously detected in radio continuum emission.
The sample also included five southern sources, R Pic, L2 Pup, V Hya, W Hya and S Pav, which are classified as semi-regular variables but have well-defined light variations. The semi-regular variables have smaller amplitude pulsations and lower mass-loss rates than the Miras and might be expected to have weaker shocks. V Hya and W Hya, however, have previously been detected in radio continuum (Luttermoser & Brown, 1992; Reid & Menten, 1997). L2 Pup is one of the closest long-period variable stars, with a maximum-visual brightness of 2.6m.
Table 1 lists properties of the observed sources. The columns of the table are
-
(1)
source name
-
(2)
IRAS identification
-
(3)
variability type
-
(4)
, the stellar period
-
(5)
, the mean visual maximum
-
(6)
, the stellar distance
-
(7)
, the phase of the visual light curve
-
(8)
, the 3 upper limits to the 4.8 GHz (6 cm) flux density (Section 3)
-
(9)
, the 3 upper limits to the 8.64 GHz (3 cm) flux density (Section 3)
-
(10)
, the upper limit to the brightness temperature of the radio emission, for an adopted radio size of cm (Section 4.2)
-
(11)
, the upper limit to the shock velocity.
2.2 Stellar Distances
In Table 1, the stellar periods, mean visual maxima and phases have been taken from optical light curves provided by the American Association of Variable Star Observers (AAVSO). For 10 of the nearest sources ( Cet, R Hor, R Lep, L2 Pup, R Car, W Hya, R Nor, R Aql, RT Sgr, and R Aqr), the stellar distances have been determined directly using trigonometric parallax measurements recently provided by the Hipparcos astrometry mission. For these sources, the distance errors given in Table 1 are determined from the standard errors in the stellar parallaxes as given in the Hipparcos Catalogs (1997). For one nearby source, R Hya, Hipparcos parallax data were not available.
For the more distant sources, with distances above 320 pc, the Hipparcos parallax measurements are too small to provide reliable distances. For 23 sources, the distances have been calculated using the relationship between stellar period and absolute visual magnitude at mean maximum given by Clayton & Feast (1969); Foy, Heck & Mennessier M. -O. (1975). Interstellar extinction corrections were calculated iteratively using Van Herk’s model of visual absorption (Van Herk, 1965; Clayton & Feast, 1969) with:
| (1) |
where is the galactic latitude, is the source distance in pc and is the visual absorption in magnitudes. The stellar distances were then calculated in the standard way with
| (2) |
where and are the apparent and absolute -magnitudes at mean maximum. Mira distances calculated in this way are accurate to typically 30% with the uncertainties arising largely from the intrinsic scatter in the period–luminosity relation. Because of their irregular light variations, larger distance errors are expected for the semi-regular variables. For one source, V Hya, the distance has been determined using the near-infrared -band period-luminosity relation for oxygen-rich Miras in the LMC, given by Feast et al. (1989), with a distance modulus to the LMC of 18.55 and average value of -magnitudes given by Neugebauer & Leighton (1969); Gezari, Schmitz & Mead (1984); Fouqué et al. (1992).
For nine of the ten nearest sources, a comparison of the distances obtained from the Hipparcos data with distances determined from equations (1) and (2) shows good agreement within the likely errors. For one source, RT Sgr, the Hipparcos distance of 133 pc is considerably smaller than the distance of 408 pc determined from the – relation. The reason for this discrepancy is not clear.
| Upper limits | ||||||||||
|---|---|---|---|---|---|---|---|---|---|---|
| Star | IRAS | Type | ||||||||
| (days) | (mag) | (pc) | (mJy/Beam) | (K) | (km s-1)† | |||||
| S Scl | 001283219 | M | 363 | 6.7 | 315 | 0.88 | 0.26 | 0.25 | 13,100 | 21 |
| Cet | 021680312 | M | 332 | 3.6 | 12818 | 0.58 | 0.66 | 0.25 | 2,200 | 7 |
| U Cet | 023131322 | M | 235 | 7.5 | 592 | 0.61 | 0.30 | 0.48 | 89 000 | 118 |
| R Hor | 025225005 | M | 408 | 6.0 | 308102 | 0.18 | 0.27 | 0.28 | 14 000 | 22 |
| R Ret | 043306307 | M | 278 | 7.6 | 593 | 0.01 | 0.28 | 0.25 | 46,500 | 64 |
| R Cae | 043873819 | M | 391 | 7.9 | 493 | 0.72 | 0.30 | 0.30 | 38,600 | 54 |
| R Pic | 044484920 | SR | 171 | 7.1 | 532 | 0.20 | 0.28 | 0.25 | 37,400 | 52 |
| R Lep | 045731452 | M | 427 | 6.8 | 25053 | 0.22 | 0.22 | 0.19 | 6,300 | 13 |
| U Ori | 055282010 | M | 368 | 6.3 | 238 | 0.01 | 0.23 | 0.18 | 5,400 | 11 |
| V Mon | 062020210 | M | 341 | 7.0 | 351 | 0.15 | 0.36 | 0.30 | 19,600 | 30 |
| L2 Pup | 071204433 | SR | 141 | 2.6 | 615 | 0.94 | 0.28 | 0.26 | 500 | |
| R Car | 093096234 | M | 309 | 4.6 | 12814 | 0.12 | 0.26 | 0.24 | 2,100 | 7 |
| S Car | 100776118 | M | 150 | 5.7 | 255 | 0.77 | 0.24 | 0.30 | 10,300 | 18 |
| V Hya | 104912059 | SR | 531 | 10.0 | 380 | 0.37: | 0.21 | 0.21 | 16 000 | 25 |
| X Cen | 114664128 | M | 315 | 8.0 | 613 | 0.33 | 0.19 | 0.22 | 43,700 | 60 |
| U Cen | 123075422 | M | 220 | 7.0 | 418 | 0.94 | 0.22 | 0.24 | 22,200 | 33 |
| U Oct | 131828357 | M | 308 | 7.9 | 559 | 0.92 | 0.96 | 0.33 | 54,500 | 74 |
| R Hya | 132692301 | M | 389 | 4.5 | 108 | 0.63 | 0.22 | 0.21 | 1,300 | 6 |
| W Hya | 134622807 | SR | 361 | 6.0 | 11514 | 0.44 | 0.22 | 0.23 | 1 600 | 7 |
| R Cen | 141295940 | M | 546 | 6.3 | 172 | 0.01p | 0.63 | 0.27 | 4,200 | 10 |
| RS Lib | 152142244 | M | 218 | 7.5 | 570 | 0.12 | 0.18 | 0.18 | 30,900 | 44 |
| R Nor | 153234920 | M | 508 | 7.2 | 19571 | 0.82p | 0.22 | 0.20 | 4 000 | 10 |
| T Nor | 154025449 | M | 241 | 7.4 | 454 | 0.33 | 0.27 | 0.24 | 26,200 | 38 |
| U Her | 162351900 | M | 406 | 7.5 | 399 | 0.35 | 0.16 | 0.17 | 14,300 | 23 |
| RR Sco | 165343030 | M | 281 | 5.9 | 259 | 0.55 | 0.25 | 0.24 | 8,500 | 15 |
| RT Sco | 170013651 | M | 449 | 8.2 | 433 | 0.11 | 0.27 | 0.24 | 23,800 | 35 |
| R Aql | 190390809 | M | 284 | 6.1 | 21153 | 0.43 | 0.19 | 0.17 | 4 000 | 10 |
| T Pav | 194517153 | M | 244 | 8.0 | 708 | 0.51 | 0.25 | 0.25 | 66,300 | 89 |
| S Pav | 195105919 | M | 381 | 7.3 | 378 | 0.82 | 0.24 | 0.21 | 15,900 | 25 |
| RR Sgr | 195282919 | SR | 336 | 6.8 | 348 | 0.69 | 0.25 | 0.23 | 14,700 | 23 |
| RU Sgr | 195524159 | M | 241 | 7.2 | 492 | 0.82 | 0.21 | 0.20 | 25,600 | 37 |
| RT Sgr | 201443916 | M | 306 | 7.0 | 13359 | 0.86 | 0.23 | 0.22 | 2,100 | 7 |
| U Mic | 202594035 | M | 334 | 8.8 | 882 | 0.33 | 0.20 | 0.19 | 78,200 | 104 |
| R Aqr | 234121533 | M | 387 | 6.5 | 197122 | 0.64 | detected (see text) | |||
∗Distances with formal errors have been determined
using Hipparcos trigonometric parallax measurements.
Other distances have been determined from
period–luminosity relations.
∗∗Brightness temperatures are calculated
for an adopted radio size of
cm (Section 4.2).
†Shock velocities estimated using the model of Fadeyev & Gillet (1998).
pprimary maximum
3 Observations and Results
The observations were taken on 1995 November 3–5, using the Australia Telescope Compact Array (ATCA) with a maximum baseline of 6 km. The ATCA is a synthesis instrument consisting of six 22-m antennas on an east–west track, located near Narrabri in New South Wales. The selected sources were simultaneously observed in two frequency bands centered at 8.64 GHz (3 cm) and 4.80 GHz (6 cm) with a bandwidth in each case of 128 MHz. Each source was observed for a total time of approximately 75 minutes, split into five scans of 15 minutes with the scans distributed over the sidereal time range of the source. The data were corrected for atmospheric amplitude and phase variations using observations of nearby strong continuum sources, and the absolute flux density scale was calibrated using the primary calibrator source 1934638, which was taken to have 6 and 3 cm flux densities of 5.83 and 2.84 Jy, respectively.
The data reduction was carried out in a standard way using the AIPS software package. After editing and calibrating the data, the source visibilities were Fourier transformed using ‘natural weighting’. The images were CLEANed (Högbom, 1974; Clark, 1980) and restored with a synthesized beam of minimum FWHM 1 arcsec at 3 cm and 2 arcsec at 6 cm. The rms noise levels in the images were measured empirically from the images.
Radio continuum emission was detected from one source only, the symbiotic binary R Aqr. This source is discussed below. For the remaining 33 sources, columns 8 and 9 of Table 1 list the 3- upper limits to the 4.80 and 8.64 GHz flux densities which are between 0.16 and 0.96 mJy at 4.80 GHz and between 0.17 and 0.48 mJy at 8.64 GHz.
4 Discussion
4.1 R Aquarii
R Aquarii is a nearby symbiotic binary system with a cool Mira star and a hot dwarf or sub-dwarf companion star. The latter is evident from strongly ionised optical emission lines but is not directly visible. The separation of the two stars has been estimated to be AU and the temperatures of the Mira and companion stars to be and 40 000 K respectively (Burgarella, Vogel & Paresce, 1992; Hollis, Pedelty & Lyon, 1997). Mass transfer between the two stars probably occurs as the hot companion captures material from the cool circumstellar wind of the Mira variable. Maser emission from SiO, H2O and OH molecules clearly indicates the presence of cool dusty material associated with mass-loss from the Mira (Zuckerman, 1979; Seaquist, Ivison & Hall, 1995), while a complex ionised envelope, detected in both radio continuum and optical emission, extends to at least 15 000 AU from the binary pair.
R Aqr also contains an astrophysical jet, first detected from optical spectroscopy by (Wallerstein & Greenstein, 1980) and in radio continuum by (Sopka et al., 1982). HST images have revealed a narrow, collimated and curved jet structure which extends from within the orbit of the binary pair to a distance of several thousand AU (Paresce & Hack, 1994).
Radio continuum emission was first detected from R Aqr in 1971 with a flux density of mJy at 85 GHz (Johnson, 1980). Gregory & Seaquist (1974) monitored the source during 1973 and found the radio emission to be strongly variable, on a timescale of months. The available radio flux measurements of R Aqr (including our ATCA result) indicate that the radio continuum emission has been in a quiescent state since the mid-1970’s. Willson et al. (1981) suggested that the initial variability may have been due to the periastron of the companion star to R Aqr, revolving around the Mira in a highly eccentric orbit with years. This result is supported by VLA 43-GHz observations of Hollis, Pedelty & Lyon (1997). They spatially resolved the Mira variable (detected from its SiO maser emission) and the hot companion (detected in radio continuum) and determined the spatial offset between the two stars to be 552 milliarcsec. Based on an orbital period of 44 years, Hollis et al. estimate the semi-major axis of the orbit to be cm with a high eccentricity of .
The radio continuum emission from R Aqr has previously been imaged using several different configurations of the Very Large Array (Sopka et al., 1982; Kafatos, Hollis & Michalitsianos, 1983; Kafatos et al., 1989; Hollis, 1985; Hollis, Dorband & Yusef-Zadeh, 1992; Hollis, Pedelty & Lyon, 1997, and references therein). On the largest scale, the 6-cm images of Hollis et al. (1987); Hollis, Oliversen & Wagner (1989) show optically-thin, thermal emission over an extended 2-arcmin region which is associated with the optical emission nebula. On much smaller angular scales, radio images at 2 and 6 cm show discrete components corresponding to compact regions within the jet. The strongest radio continuum emission occurs from a region located close to the Mira position, which has a spectral index of (where ), consistent with optically-thick thermal free-free emission from an outflowing wind. Other jet components however have negative radio spectral indices indicating non-thermal emission.
Dougherty et al. (1995) observed R Aqr on MERLIN at 5 GHz (December 1992) and 1.7 GHz (August 1993). In their 5-GHz images of R Aqr (resolution 40 milliarcsec), the jet is resolved into six, apparently thermal components with a total flux density of 16.10.6 mJy.
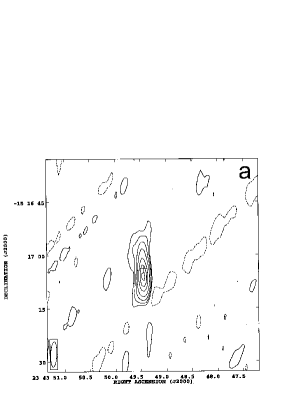
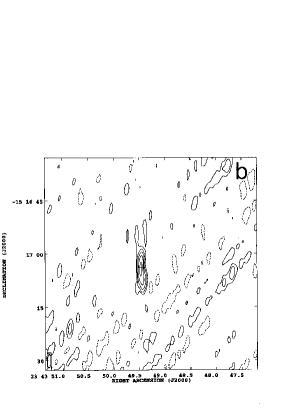
In 1995 November the total 6-cm flux density detected with the ATCA was 17.2 mJy (Figure 1), in good agreement with the MERLIN value. The total detected 3 cm flux density was 15.9 mJy (Figure 2), corresponding to a spectral index, averaged over the detected region, of . The ATCA radio images show the radio continuum emission from R Aqr to be slightly extended in a north-south direction. A comparison of the ATCA images with the far more sensitive earlier VLA and MERLIN images shows that radio continuum was detected from the inner jet region. The -coverage and sensitivity of the ATCA survey data were however not sufficient to resolve the complex structures within the jet, or to detect the extended envelope around the binary system.
We do not discuss R Aqr further in this paper.
4.2 Brightness Temperature Limits
For optically-thick radio continuum emission at centimetre wavelengths, the gas brightness temperature, , is related to the radio flux density, , by the Rayleigh–Jeans approximation so that
| (3) |
where is the radius of the radio-emitting region, is the frequency of the radio emission, is the source distance and is the speed of light. This may be written as
| (4) | |||
Direct optical interferometric measurements of AGB stars have determined photospheric radii of typically (2–3) cm (Tuthill et al., 1994; Haniff, Scholz & Tuthill, 1995), while thermal continuum emission is expected to occur from outside the optical photosphere but within the grain condensation radii of a few stellar radii (Greenhill et al., 1995). From their radio data Reid & Menten (1997) have shown that at cm-wavelengths the thermal radio emission from an extended photosphere reaches unity optical depth at a radius of approximately two stellar radii. For comparison with their results, column 10 of Table 1 gives upper limits to the brightness temperatures determined from equation (4) using the stellar distances given in column 6 of Table 1 and a ‘characteristic’ radio size of cm.
4.3 Shock Velocity Limits
For optically-thick thermal radio continuum emission, we can use the observed brightness temperature, , as a direct measure of the post-shock electron temperature . To obtain ‘reasonable’ estimates of the shock velocities we adopt a characteristic size for the radio-emitting region of cm.
Column 11 of Table 1 gives the upper limits to the shock velocities determined using the model of (Fadeyev & Gillet, 1998) and upper limits to the radio brightness temperatures given in column 10. Fadeyev & Gillet (1998) obtained a self-consistent solution of the equations of fluid dynamics, radiation transfer and atomic kinetics, involving partial ionisation and excitation of bound atomic states. In Table 2 of Fadeyev & Gillet (1998) the dependence of the post-shock electron temperature on the shock velocity is nearly linear and can be approximated as
| (5) |
Shock velocity limits have been calculated using formula (5).
The primary result of our ATCA survey was the lack of any radio continuum emission detected from the 33 sources observed (excluding the symbiotic star R Aqr). The brightness temperature limits given in Table 1 cover a wide range of values, due primarily to their strong dependence on the stellar distances.
For the six nearest sources in our sample (L2 Pup, R Hya, W Hya, Cet, R Car and RT Sgr), with distances within 140 pc, the upper limits to the brightness temperatures are comparable to or lower than the stellar photospheric temperatures. For these sources, we can exclude strong shock activity near two stellar radii with shock velocities above 7 km s-1. For the nearest source in our sample, the semi-regular variable L2 Pup, the lack of any radio continuum detection is surprising. For this source the upper limit to the 3-cm radio flux density is a factor of three lower than predicted by the Reid & Menten’s model and a factor of nearly two lower than expected for blackbody emission from an optical photosphere of radius cm and temperature 2 500 K. A likely explanation is that the stellar size is smaller than the adopted value used to estimate brightness temperatures. Our flux density limits are consistent with a stellar radius of cm or smaller. For the other five sources with distances below 140 pc, the brightness temperature limits are consistent with the radio-photosphere model of Reid & Menten (1997).
For a further five sources, R Lep, U Ori, R Cen, R Nor and R Aql, which are within 250 pc, the brightness temperature limits are below 6,300 K, consistent with stellar shock velocities below 10–13 km s-1. We note that these are conservative upper limits and that actual shock velocities may be considerably lower.
For all 15 sources in Table 1 with distances within 320 pc, we can rule out the presence of strong stellar shocks with velocities above 22 km s-1. For the 17 sources in the sample, with distances greater than 320 pc, our data are insufficiently sensitive to provide useful limits to the gas temperatures or shock velocities yield higher upper limits for , ranging between 23 and 118 km s-1.
4.4 Comparison with Previous Radio Detections
Many searches have been made for radio continuum emission from long period variable stars with largely negative results (e.g. Wendker, 1995, and references therein). In Table 2 we summarise previously published detections of radio continuum emission at cm-wavelengths from Mira and semi-regular variable stars.
The columns of Table 2 are:
-
(1)
source name (variability type, spectral type)
-
(2)
, the stellar distance. For Cet, W Hya, V Hya and R Aql, distances are as for Table 1. For CW Leo, the distance is taken from Crosas & Menten (1997). For RZ Ari the distance is determined from the Hipparcos parallax. Other distances are taken from the references given in column 8.
-
(3)
the year of observation
-
(4)
, the frequency (GHz)
-
(5)
, the detected flux density (mJy)
-
(6)
radio telescope used
-
(7)
reference for radio detection
-
(8)
, the radio brightness temperature calculated assuming optically thick radio emission for a ‘characteristic’ radius of cm (Section 4.2)
-
(9)
, the shock velocity calculated from the model of Fadeyev & Gillet (1998), using the brightness temperature given in column 8.
at cm-wavelengths
| Star | Year | Tel | Ref | |||||
| (Var, Sp) | (pc) | (GHz) | (mJy) | (K) | (km s-1)† | |||
| Cet (M,M) | 1981 | 4.9 | 0.74 | VLA | 1 | 20,000 | 30 | |
| 1989 | 8.4 | 0.35 | VLA | 2 | 3,200 | 9 | ||
| 1990/91 | 8.4 | 0.35–0.49 | VLA | 3 | 3,200–4,500 | 9–10 | ||
| 1989 | 14.9 | 0.93 | VLA | 2 | 2,700 | 8 | ||
| 1989/90 | 14.9 | 0.940.11 | VLA | 3 | 2,700 | 8 | ||
| 1989/90 | 22.4 | 2.60.20 | VLA | 3 | 3,400 | 9 | ||
| 2004/05 | 8.5 | 0.192,3 | VLA | 4 | 1,700 | 7 | ||
| 2004/05 | 14.9 | 1.060.373 | VLA | 4 | 3,100 | 8 | ||
| 2004/05 | 22.5 | 1.132,3 | VLA | 4 | 1,400 | 6 | ||
| 2004/05 | 43.3 | 2.522,3 | VLA | 4 | 900 | 6 | ||
| Per (SR, M) | 1985 | 5 | 0.18 | VLA | 5 | 2,800 | 8 | |
| 1985 | 15 | 0.54 | VLA | 5 | 900 | 6 | ||
| Gem (SR, M) | 1984 | 5 | 0.180.05 | VLA | 5 | 1,400 | 6 | |
| R Leo (M, M) | 1990/91 | 8.4 | 0.18–0.27 | VLA | 3 | 1,200–1,800 | 6–7 | |
| 1989 | 8.4 | 0.25 | VLA | 2 | 1,700 | 7 | ||
| 1991 | 8.4 | 0.260.03 | VLA | 6 | 1,800 | 8 | ||
| 1989 | 14.9 | 0.75 | VLA | 2 | 1,600 | 7 | ||
| 1989/90 | 14.9 | 0.640.17 | VLA | 3 | 1,400 | 6 | ||
| 1989/90 | 22.4 | 1.470.20 | VLA | 3 | 1,400 | 6 | ||
| CW Leo (M, C) a | 150 | 1981 | 4.9 | 0.420.10 | VLA | 1 | 15,500 | 24 |
| 1987 | 5 | 0.280.05 | VLA | 7 | 10,000 | 17 | ||
| 1991 | 8.4 | 0.770.03 | VLA | 6 | 9,700 | 17 | ||
| 1987 | 15 | 1.160.12 | VLA | 7 | 4,600 | 10 | ||
| 1985 | 15 | 1.40.05 | VLA | 8 | 5,500 | 12 | ||
| 1984 | 20 | 6.01.52 | OVRO | 8 | 13,300 | 22 | ||
| 1991/93 | 8.4 | 0.670.032 | VLA | 9 | 8,400 | 15 | ||
| 1991/93 | 14.9 | 2.140.182 | VLA | 9 | 8,600 | 15 | ||
| 1991/93 | 22.5 | 4.200.462 | VLA | 9 | 7,400 | 14 | ||
| RW LMi (SR, C)b | 230 | 1991 | 8.4 | 0.140.03 | VLA | 6 | 4,100 | 10 |
| V Hya (SR, C) | 380 | 1989 | 8.4 | 0.220.03 | VLA | 10 | 17,800 | 27 |
| W Hya (SR, M) | 1990/91 | 8.4 | 0.23–0.45 | VLA | 3 | 1,700–3,300 | 7–9 | |
| 1989/90 | 14.9 | 1.120.17 | VLA | 3 | 2,600 | 8 | ||
| 1989/91 | 22.4 | 2.700.242 | VLA | 3 | 2,800 | 8 | ||
| g Her (SR, M) | 1989 | 8.4 | 0.14 | VLA | 2 | 1,000 | ||
| 1987 | 15 | 0.420.12 | VLA | 7 | 900 | 6 | ||
| Her (SR, M) | 1983/84 | 5 | 0.830.062 | VLA | 5 | 18,000 | 28 | |
| 1984 | 15 | 1.710.10 | VLA | 5 | 4,100 | 10 | ||
| R Lyr (SR, M) | 1987 | 15 | 0.450.12 | VLA | 7 | 900 | 6 | |
| R Aql (M, M) | 1982 | 2.3 | 38116 | DSN 64m | 11 | see | text | |
| 1982 | 8.4 | 406 | DSN 64m | 11 | ” | ” | ||
| 1970 | 10.5 | 23240 | ARO 46m | 12 | ” | ” | ||
| 1978 | 14.9 | 5.32.0 | Bonn 100m | 13 | ” | ” | ||
| 1989/90 | 14.9 | 0.24 | VLA | 3 | 1,900 | 7 | ||
| 1989/90 | 22.4 | 0.800.4 | VLA | 3 | 2,800 | 21 | ||
| Cyg (M, S) | 1989/90 | 8.4 | 0.270.04 | VLA | 3 | 2,800 | 21 | |
| 1989/90 | 14.9 | 0.790.20 | VLA | 3 | 2,600 | 21 | ||
| 1989/90 | 22.4 | 1.620.30 | VLA | 3 | 2,300 | 20 | ||
| R Cas (M,M) | 1989/90 | 8.4 | 0.110.05 | VLA | 3 | 1,600 | 7 | |
| 1989/90 | 22.4 | 0.790.30 | VLA | 3 | 1,600 | 7 |
Notes to Table 2:
Other names: aIRC10216, AFGL 1381; bCIT 6, IRC30219, AFGL 1403;
1Range of flux densities obtained from VLA monitoring data
2Average of two or more values
3Mira A only
References:
(1) Spergel, Giuliani & Knapp (1983),
(2) Drake, Linsky & Judge (1993),
(3) Reid & Menten (1997),
(4) Matthews & Karovska (2006),
(5) Drake & Linsky (1986),
(6) Knapp et al. (1995),
(7) Drake et al. (1991),
(8) Sahai, Claussen & Masson (1989),
(9) Menten et al. (2006),
(10) Luttermoser & Brown (1992),
(11) Estalella, Paredes & Rius (1983),
(12) Woodsworth & Hughes (1973),
(13) Bowers & Kundu (1979).
Apart from R Aqr (Section 4.1), radio continuum emission has previously been detected from four of the sources in our sample, V Hya, R Aql, Cet and W Hya.
For the carbon star V Hya, our three-sigma upper limit of 0.21 mJy is consistent with the 1989 VLA 8.4-GHz detection of 0.22 mJy by Luttermoser & Brown (1992).
For R Aql, strong flare activity and non-thermal emission has been reported from several single-dish observations: Woodsworth & Hughes (1973, 1977) observed a rapid rise in the 10.6 GHz emission from 23 to 240 mJy over a period of only 30 minutes. Less intense, but still unusually strong emission from R Aql was later observed by Bowers & Kundu (1979), while Estalella, Paredes & Rius (1983) detected non-thermal emission with a spectral index, between 2.3 and 8.4 GHz, of . A possible explanation for such a steep spectral index is non-thermal synchroton emission from electrons accelerated by a strong stellar shock (Rudnitskij, 1993). The more recent interferometric data for R Aql however shows no evidence for excess continuum emission. Our 8 GHz upper limit of 0.2 mJy is consistent with the 1990 VLA upper limit of 0.09 mJy (Reid & Menten, 1997). The association of the earlier single-dish detections (which did not have accurate radio positions) with the stellar source is unclear. We do not however rule out the possibility that unusual and irregular flare activity may occur from R Aql.
For W Hya, our upper limit of 0.25 mJy is slightly lower than the mean flux density of 0.36 mJy obtained by Reid & Menten (1997). Their observations partially resolved the stellar disk, with an average diameter of 0.08 arcsec and a brightness temperature of 1,500 570 K .
For Cet, the three-sigma detection of Spergel, Giuliani & Knapp (1983) is a marginal result. As this is inconsistent with both Drake, Linsky & Judge (1993) and Reid & Menten (1997), the published detection is probably spurious. Reid & Menten (1997) found marginal evidence for periodic variability in the radio continuum emission with a mean flux density at 8.4 GHz of 0.42 mJy and peak-to-mean ratio of 1.1. From a periodic fit to the radio fluxes they showed that such variability could be explained by a modulation of the thermal radio emission caused by a weak pulsation-driven stellar shock propagating through the radio-photosphere, with a shock velocity of approximately 7 km s-1. Our 3-sigma upper limit at 8.6 GHz of 0.25 mJy is lower than the 8.4 GHz flux densities of 0.35 to 0.49 mJy obtained by Reid & Menten in 1990–1991. The cause of the discrepancy between the VLA flux densities and the ATCA flux density limit, obtained five years later, is unclear. However, it is well-known that pulsations amplitudes and shock strengths vary from cycle-to-cycle and some variation in the radio continuum emission appears likely. Source variability may also occur on a longer timescales. Tuthill, Haniff & Baldwin (1995) showed that the optical size of Cet, measured at wavelengths between 700 and 900 nm, increased systematically by a factor of 1.8 between 1991 September and 1993 December. The increase in optical size may imply an episode of increased mass-loss and a build-up of the circumstellar dust shell. Such an enhancement of circumstellar dust density may damp the shock waves in the inner part of the stellar envelope (Rudnitskij, 1997).
The star Cet is a symbiotic binary comprising a variable red giant (Mira A) and an companion (possibly a white dwarf, Mira B) accreting material from the primary. It was resolved in VLA observations of Matthews & Karovska (2006). The radio fluxes at 8.5, 14.9, 22.5 and 43.3 GHz were measured separately for both components at several epochs in 2004–2005. In Table 2we list only the fluxes measured for the red-giant component Mira A.
For 11 of the sources listed in Table 2 ( Cet, Per, Gem, R Leo, RW LMi, W Hya, g Her, R Lyr, R Aql, Cyg and R Cas) the detected radio continuum flux densities agree well with the radio-photosphere model of Reid & Menten (1997). For these sources we estimate brightness temperatures of 15004000 K indicating little if any excess emission. From the shock model given in paper I, the radio brightness temperatures indicate that only weak or moderate shock strengths are possible with shock velocities below 10 km s-1.
As discussed by Reid & Menten (1997), at temperatures between 1 000 and 4 000 K, free electrons occur primarily from elements such as potassium, sodium and calcium which, although far less abundant, have much lower ionisation potentials than hydrogen. Their calculations show that the dominant source of the free-free opacity occurs from interactions between free electrons from ionised metals with neutral hydrogen atoms and molecules.
4.5 AGB Stars with Excess Radio Continuum Emission
Excluding R Aql and Cet (discussed above), only three sources in Table 2, CW Leo, V Hya and Her show a strong excess of radio continuum emission above the levels expected for radio photospheres. We note that two of the three sources, CW Leo and V Hya are N-type AGB carbon stars. The carbon stars represent around eight per cent of AGB stars and have C/O ratios enhanced surface carbon abundances due to a dredge-up of processed material. These stars have high mass loss rates and are considered likely to be near the end of the AGB stage of evolution.
CW Leo (=IRC10216) is an extreme carbon star (C9) and a strong source of molecular emission, with over 50 molecular species detected from its circumstellar envelope. From an analysis of the CO properties, Crosas & Menten (1997) estimate the distance to be 150 pc. For this distance, the cm radio continuum flux densities indicate radio brightness temperatures between 5,000 and 15,000 K. For our model, the corresponding shock velocities are between 11 and 24 km s-1. For CW Leo, the radio continuum emission almost certainly occurs from a chromospheric region. IUE ultraviolet spectra with ionised emission features from MgII, CII and FeII have shown that both oxygen-rich and carbon-rich AGB stars have stellar chromospheres (Johnson & Luttermoser, 1987). Luttermoser et al. (1989) provided a chromospheric model for N-type carbon stars. In their model the inner chromospheres have a steep temperature gradient and an outwards expansion velocity of around 50 km s-1, while the outer chromospheres are nearly static relative to the stellar photospheres. The heating mechanisms in the chromospheres of late-type stars are not well understood. However, if strong shocks are present then some chromospheric heating is likely to occur due to the dissipation of shock energy and heating of the post-shock gas. Menten et al. (2006) monitored CW Leo in 1991–1993 in the radio continuum with VLA at 8.4, 14.9 and 22.5 GHz (see Table 2). They found possible variability correlated with the infrared phase and a spectral index very close to 2. The variability, observed flux densities and upper limit on the source size are consistent with the emission arising from the stellar photosphere or a slightly larger radio photosphere. Using the model of Fadeyev & Gillet (1998), we have estimated shock velocities that would heat the radio photosphere to temperatures listed in Table 2; we have obtained km s-1.
V Hya is also an extreme (C9) carbon star. CO imaging of V Hya has shown that most of the stellar mass-loss occurs within a high-velocity wide-angle bipolar outflow (Kahane et al., 1996). Such a geometry indicates that the star is likely to be close to leaving the AGB and may be in a short-lived common envelope binary system. Kahane et al. (1996) find that along the bipolar axis there is a strong velocity gradient with velocities decreasing outwards from over 50 km s-1 at the inner boundary to around 8 km s-1 at the outer boundary. Within the bipolar cones, multiple shocks are likely to occur as faster moving gas collides with more slowly moving material. From this model and the above discussion we suggest that the radio continuum emission from V Hya, detected by Luttermoser & Brown (1992), has two possible sources; chromospheric emission from the outer atmosphere and emission from high-velocity shocked regions located near the base of the bipolar outflows.
Finally, Her is an M5II star which belongs to a visual binary system. For this source the 515 GHz spectral index of 0.8 is close to the canonical value of 0.6 for thermal emission from an ionised wind expanding at a constant velocity (e.g. Wright & Barlow, 1975). Drake & Linsky (1986) interpret the emission from this source as thermal emission occuring from a chromospheric region of temperature 10,000 K and radius two stellar radii. Here we note that the spectral index of 0.8 is consistent with expansion in the stellar chromosphere.
4.6 Comparison of Radio and Optical Studies
Considerable controversy exists on the interpretation of optical spectra of M-type Mira and semi-regular variables. These characteristically show hydrogen Balmer and metallic line emission lines, which are strongest near maximum light and decline in intensity with increasing phase towards minimum light. The linewidths of the emission lines are also strongly phase dependent with full widths of typically 80 km s-1 near light maximum and 40 km s-1 near light minimum (e.g. Gillet et al., 1985a, b; Richter & Wood, 2001).
From an analysis of the Balmer linewidths, Gillet et al. (1985a, b); Gillet (1988a, b); Gillet, Lafon & David (1989) advocate a model in which the double-peaked structure of the H emission line profiles observed in some M-type Miras occurs from the front and back-side of a single spherical shock wave, with shock velocities estimated, in most cases, to be between 40 and 70 km s-1. For S Car, Gillet et al. (1985b) estimated a maximum shock velocity of 90 km s-1.
Other authors determine smaller shock velocities by arguing that multiple shocks exist simultaneously in Mira atmospheres (Wood, 1979; Bowen, 1988; Derviz & Somsikov, 1990; Woodsworth, 1995). In this case, the H emission line profiles may have complex shapes. Woodsworth (1995) found three components in the H line profiles of several S-type Miras. These were modelled as emission from different ionised layers, associated with a ‘main’ outward shock and an ‘inner’ shock caused by infalling post-main-shock gas. The shock velocities, inferred by this model, are below 40 km s-1.
From the radial velocities of optical hydrogen and metallic emission lines, Fox, Wood & Dopita (1984) and Richter & Wood (2001) showed that at maximum light the post-shock emission region has an outwards velocity of 10–20 km s-1. Similar velocities have also been obtained from low-opacity ultraviolet emission lines (Wood & Karovska, 2000). Richter & Wood (2001) demonstrate that the radial velocities decrease with increasing phase, and are almost zero at minimum light. This can be interpreted as a decrease in shock strength as a shock wave moves outwards through the stellar atmosphere, while the decrease in linewidth is likely to reflect a decrease in temperature and hence Doppler broadening behind the shock front.
In the present study we have argued that the lack of any detected radio continuum emission from the 11 nearest sources in our sample is consistent with an upper limit to stellar shock velocities of around 6–7 km s-1 near two stellar radii. A similar conclusion, based on the lack of strong radio variability, was also reached by Reid & Menten (1997). The lack of radio continuum detections in the present study clearly favours low shock velocities and/or damping of the shock energy within the inner few stellar radii.
5 Conclusions
We have made a sensitive search with the ATCA for radio continuum emission at 3 and 6 cm from 34 Mira and semi-regular variable stars. Our search provided no detections of radio continuum emission, apart from for R Aqr which is a well Known symbiotic binary system. In 1995 November the radio emission from R Aqr was in a quiescent state.
From the upper limits to the flux densities determined for the other 33 sources, we have estimated upper limits to the gas brightness temperatures near two stellar radii at a characteristic size of cm. Shock velocities have been estimated using the model presented by Fadeyev & Gillet (1998).
For the six nearest sources in the ATCA survey, with distances within 140 pc, we obtain brightness temperatures below 2,300 K indicating that there is no excess of radio continuum above the levels expected from the radio-photosphere model of Reid & Menten (1997). From previously published detections of centimetre continuum emission we find that for 10 out of 13 sources the detected flux densities indicate radio brightness temperatures below 4,000 K. In the model of Fadeyev & Gillet (1998) we have used, a brightness temperature limit of 4,000 K corresponds to a shock velocity limit of 10 km s-1.
Only three long-period variable stars of those observed by other authors, CW Leo, V Hya and Her, show a strong excess of radio continuum emission. In each case, the strong continuum emission is likely to be associated with a stellar chromosphere.
Acknowledgments
The Australia Telescope is funded by the Commonwealth of Australia for operation as a National Facility managed by CSIRO. G. M. Rudnitskij gratefully acknowledges financial support from the Anglo-Australian Observatory and Australia Telescope National Facility. The authors are grateful to late Dr. Janet A. Mattei and to the American Association of Variable Star Observers (AAVSO) for supplying the light curves for all the stars as well as to Harm Habing and Lee Ann Willson for comments on an earlier draft of the manuscript. This research made use of the SIMBAD database, operated at Centre des données astronomiques de Strasbourg (CDS), France.
References
- Anandarao, Pottasch & Vaidya (1993) Anandarao B. G., Pottasch S. R., Vaidya D. B., 1993, A&A, 273, 570
- Bowen (1988) Bowen G. H., 1988, ApJ, 329, 299
- Bowers & Kundu (1979) Bowers P. F., Kundu M. R., 1979, AJ, 84, 791
- Burgarella, Vogel & Paresce (1992) Burgarella D., Vogel M., Paresce F., 1992, A&A, 262, 83
- Chapman & Cohen (1985) Chapman J. M., Cohen R. J., 1985, MNRAS, 212, 375
- Chapman, Cohen & Saikia (1991) Chapman J. M., Cohen R. J., Saikia D. J., 1991, MNRAS, 249, 227
- Clark (1980) Clark B. G., 1980, A&A, 89, 377
- Clayton & Feast (1969) Clayton M. L., Feast M. W., 1969, MNRAS, 146, 411
- Crosas & Menten (1997) Crosas M., Menten K. 1997, ApJ, 483, 913
- Derviz & Somsikov (1990) Derviz T. E., Somsikov V. V., 1990, SvAL, 16, 21
- Dougherty et al. (1995) Dougherty S. M., Bode M. F., Lloyd H. M., Davis R. J., Eyres S. P., 1995, MNRAS, 272, 843
- Drake & Linsky (1986) Drake S. A., Linsky J., 1986, AJ, 91, 602
- Drake, Linsky & Judge (1993) Drake S. A., Linsky J. L., Judge P. G., 1993, unpublished VLA results, quoted by Wendker (1995)
- Drake et al. (1991) Drake S. A., Linsky J. L., Judge P. G., Elitzur M., 1991, AJ, 101, 230
- Estalella, Paredes & Rius (1983) Estalella R., Paredes J. M., Rius A., 1983, A&A, 124, 309
- Fadeyev & Gillet (1998) Fadeyev Yu. A., Gillet D., 1998, A&A, 333, 687
- Fouqué et al. (1992) Fouqué P., Le Bertre T., Epchtein, N., Guglielmo F., Kerschbaum F., 1992, A&AS, 93, 151
- Fox, Wood & Dopita (1984) Fox M. W., Wood P. R., Dopita M. A., 1984, ApJ, 286, 337
- Foy, Heck & Mennessier M. -O. (1975) Foy R., Heck A., Mennessier M.-O., 1975, A&A, 43, 175
- Gezari, Schmitz & Mead (1984) Gezari D. Y., Schmitz M., Mead J. M., 1984, Catalog of Infrared Observations, NASA RP 1118
- Gillet (1988a) Gillet D., 1988a, A&A, 190, 200
- Gillet (1988b) Gillet D., 1988b, A&A, 192, 206
- Gillet, Lafon & David (1989) Gillet D., Lafon J.-P. J., David P., 1989, A&A, 220, 185
- Gillet et al. (1985a) Gillet D., Ferlet R., Maurice E., Bouchet P., 1985a, A&A, 150, 89
- Gillet et al. (1985b) Gillet D., Maurice E., Bouchet P., Ferlet R., 1985b, A&A, 148, 155
- Goldreich & Scoville (1976) Goldreich P., Scoville N. Z., 1976, ApJ, 205, 144
- Greenhill et al. (1995) Greenhill L. J., Colomer F., Moran J. M., Backer D. C., Danchi W. C., Bester M., 1995, ApJ, 449, 365
- Gregory & Seaquist (1974) Gregory P. C., Seaquist E. R., 1974, Nat, 247, 532
- Haniff, Scholz & Tuthill (1995) Haniff C. A., Scholz M., Tuthill P. G., 1995, MNRAS, 276, 640
- Hipparcos Catalogs (1997) Hipparcos Catalogs, 1997, ESA Publications Agency SP-1200
- Högbom (1974) Högbom J. A., 1974, A&AS, 15, 417
- Hollis, Dorband & Yusef-Zadeh (1992) Hollis J. M., Dorband J. E., Yusef-Zadeh F., 1992, ApJ, 386, 293
- Hollis (1985) Hollis J. M., Kafatos M., Michalitsianos A. G., McAlister H. A., 1985, ApJ, 289, 765
- Hollis et al. (1987) Hollis J. M., Michalitsianos A. G., Oliversen R. J., Yusef-Zadeh F., Kafatos M., 1987, ApJ, 321, L55
- Hollis, Oliversen & Wagner (1989) Hollis J. M., Oliversen R. J., Wagner R. M. 1989, ApJ, 337, 795
- Hollis, Pedelty & Lyon (1997) Hollis J. M., Pedelty J. A., Lyon R. G., 1997, ApJ, 482, L85
- Johnson (1980) Johnson H. M., 1980, ApJ, 237, 840
- Johnson & Luttermoser (1987) Johnson H. R., Luttermoser D. G., 1987, ApJ, 314, 329
- Kafatos, Hollis & Michalitsianos (1983) Kafatos M., Hollis J. M., Michalitsianos A. G., 1983, ApJ, 267, L103
- Kafatos et al. (1989) Kafatos M., Hollis J. M., Yusef-Zadeh, F., Michalitsianos A. G., Elitzur M., 1989, ApJ, 346, 991
- Kahane et al. (1996) Kahane C., Barnabum C., Audinos P., Morris M., 1996, A&A, 314, 871
- Kholopov et al. (1986–1989) Kholopov P. N. et al., 1986–1989, General Catalogue of Variable Stars, Nauka, Moscow, vols 1–3
- Knapp et al. (1995) Knapp G. R., Bowers P. F., Young K., Phillips T. G., 1995, ApJ, 455, 293
- Luttermoser & Brown (1992) Luttermoser D. G., Brown A., 1992, ApJ, 384, 634
- Luttermoser et al. (1989) Luttermoser D. G., Johnson H. R., Avrett E. H., Loser R., 1989, ApJ, 345, 543
- Matthews & Karovska (2006) Matthews L. D., Karovska M., 2006, ApJ, 637, L49
- Menten et al. (2006) Menten K. M., Reid M. J., Krügel E., Klaussen M. J., Sahai R., 2006, A&A, 453, 301
- Morris (1987) Morris M., 1987, PASP, 99, 1115
- Neugebauer & Leighton (1969) Neugebauer G., Leighton R. B., 1969, Two Micron Sky Survey, NASA SP-3047
- Paresce & Hack (1994) Paresce F., Hack W., 1994, A&A, 287, 154
- Reid & Menten (1997) Reid M. J., Menten K. M., 1997, ApJ, 476, 327
- Richter & Wood (2001) Richter He., Wood P. R., 2001, A&A, 369, 1027
- Rudnitskij (1990) Rudnitskij G. M., 1990, in Mennessier M.-O., Omont A., eds, Proc. Intern. Coll. From Miras to Planetary Nebulae: Which Path for Stellar Evolution? Editions Frontières, Gif sur Yvette, p. 268
- Rudnitskij (1993) Rudnitskij G. M., 1993, in Weinberger R., Acker A., eds, Planetary Nebulae, Proc. 155th Symp. IAU, Held in Innsbruck, Austria, July 13–17, 1992, Kluwer, Dordrecht, p. 323
- Rudnitskij (1997) Rudnitskij G. M., 1997, Ap&SS, 251, 259
- Sahai, Claussen & Masson (1989) Sahai R., Claussen M. J., Masson C. R., 1989, A&A, 220, 92
- Seaquist, Ivison & Hall (1995) Seaquist E. R., Ivison R. J., Hall P. J., 1995, MNRAS, 276, 867
- Sopka et al. (1982) Sopka R. J., Herbig G., Kafatos M., Michalitsianos A. G., 1982, ApJ, 258, L35
- Spergel, Giuliani & Knapp (1983) Spergel D. N., Giuliani J. L., Knapp G. R., 1983, ApJ, 275, 330
- Tuthill, Haniff & Baldwin (1995) Tuthill P. G., Haniff C. A., Baldwin J. E., 1995, MNRAS, 277, 1541
- Tuthill et al. (1994) Tuthill P. G., Haniff C. A., Baldwin J. E., Feast M. W., 1994, MNRAS, 266, 745
- Van Herk (1965) Van Herk G., 1965, Bull. Astron. Inst. Neth., 18, 71
- Wallerstein & Greenstein (1980) Wallerstein G., Greenstein J. L., 1980, PASP, 92, 275
- Wendker (1995) Wendker H. J., 1995, A&AS, 109, 177 (ftp://cdsarc. u-strasbg. fr/pub/cats/II/199A/)
- Willson et al. (1981) Willson L. A., Garnavich P., Mattei J. A., 1981, IBVS, No. 1961
- Wood (1979) Wood P. R., 1979, ApJ, 227, 220
- Wood & Kahn (1977) Wood P. R., Cahn J. H., 1977, ApJ, 211, 499
- Wood & Karovska (2000) Wood B. E., Karovska M., 2000, ApJ, 535, 304
- Woodsworth (1995) Woodsworth A. W., 1995, ApJ, 444, 396
- Woodsworth & Hughes (1973) Woodsworth A. W., Hughes V. A., 1973, Nature Phys. Sci., 246, 111
- Woodsworth & Hughes (1977) Woodsworth A. W., Hughes V. A., 1977, A&A, 58, 105
- Wright & Barlow (1975) Wright A. E., Barlow M. J., 1975, MNRAS, 170, 41
- Zuckerman (1979) Zuckerman, B., 1979, ApJ, 230, 442