The effects of environment on morphological evolution between in the COSMOS Survey⋆
Abstract
We explore the evolution of the morphology density relation using the COSMOS-ACS survey and previous cluster studies. The Gini parameter measured in a Petrosian aperture is found to be an effective way of selecting early-type galaxies free from systematic effects with redshift. We find galaxies are transformed from late (spiral and irregular) to early (E+S0) type galaxies more rapidly in dense than sparse regions. At a given density, the early-type fraction grows constantly with cosmic time, but the growth rate increases with density as a power law of index . However, at densities below 100 galaxies per Mpc2 no evolution is found at . In contrast the star-formation-density relation shows strong evolution at all densities and redshifts, suggesting different physical mechanisms are responsible for the morphological and star formation transformation. We show photometric redshifts can measure local galaxy environment, but the present results are limited by photometric redshift error to densities above galaxies per Mpc2.
Subject headings:
galaxies: evolution — galaxies: formation — cosmology: observations — cosmology: large scale structure — galaxies: structure — galaxies: clusters1. Introduction
The correlation between galaxy properties such as color and morphology with galactic environment, specifically the local density of galaxies, was first noted by Hubble (1926). Later, low redshift surveys showed a high percentage of early-type (E+S0) and redder galaxies in clusters compared with the field which was quantified as the morphology-density (T-) (Dressler, 1980; Dressler et al., 1997; Treu et al., 2003; Smith et al., 2005; Postman et al., 2005) and star formation rate-density (SFR-): (Oemler, 1974; Melnick & Sargent, 1977; Butcher & Oemler, 1984; Kauffmann et al., 2004) relations. Spectroscopic redshifts from the Sloan Digital Sky Survey (SDSS) enabled an extension of these correlations over five orders of magnitude in at z (Goto et al., 2003; Kauffmann et al., 2004). Such studies clearly indicate the present properties of galaxies have been strongly influenced by galaxy environment, presumably by galaxy interactions.
Most investigations of galaxy evolution have focused on the star formation rates and stellar masses as determined from integrated photometry and spectroscopy (Cowie et al., 1999; Lilly et al., 1995; Dickinson et al., 2003; Glazebrook et al., 2004; Bauer et al., 2005; Drory et al., 2005; Feulner et al., 2005; Juneau et al., 2005). In these studies star formation activity is seen to progress to less massive galaxies as the universe ages – a phenomenon often called “downsizing” (Cowie et al., 1999). Nevertheless, the process of star formation in galaxies is complex and poorly understood (Somerville, 2005). On the other hand, the morphology of a galaxy is linked to the angular momentum distribution which is simpler to quantify, and hence a valuable alternative to star formation. The presence of a disk clearly indicates a dynamically-cold stellar population that has not been significantly disturbed, while it is likely that spheroidal systems have been heated by interactions, merging or other mechanisms.
At redshifts above ground-based imaging generally has inadequate resolution for morphological surveys since the typical size of a galaxy is 0.75′′ (Ferguson et al., 2004), so HST data is required. The small field of view available on HST limited previous studies of the T- relation at to a few previously known galaxy clusters and field samples (Dressler et al., 1997; Treu et al., 2003; Postman et al., 2005). Combining these studies, Smith et al. (2005) found high density and low density regions evolved differently. They postulated different formation times were possibly responsible for the observed effect, but were limited by the look-back time and density resolution of the available data. The COSMOS ACS data is the first HST imaging survey able to study statistically significant samples of galaxies over a range of environments and redshifts with high resolution morphologies.
In this paper, we use the COSMOS data, combined with photometric redshifts, to quantify the evolution of the T- relation as a function of redshift over the range z to . These measurements are combined with previous studies in the literature (Dressler, 1980; Dressler et al., 1997; Postman et al., 2005; Smith et al., 2005) to provide a larger dynamic range in density and span in redshift than possible with COSMOS data alone. In Section 2 we describe the imaging data and photometric redshifts (Mobasher et al., 2007) used for this study and the selection of our sample. The morphological parameters used to characterize the galaxies are discussed and tested in Section 3. Details of estimating density with photometric redshifts and correspondingly poor line of sight distances, are discussed in Section 4. Finally, dependence of morphology on density and redshift is presented and discussed in Sections 6 and 7 respectively. Throughout this paper we use a standard cosmology with , , and . All literature values are converted to this cosmology unless otherwise noted.
2. Imaging and Redshifts
The Hubble Space Telescope Advanced Camera for Surveys (HST-ACS) images, taken as a part of the COSMOS survey (Scoville et al., 2007b; Koekemore et al., 2007) are used to measure morphologies. These images cover an area of 1.8 square degrees in and 81 square arc-minutes in with single orbit exposures. The completeness is 50% in F814W for a galaxy 0.5′′ in diameter with F814W magnitude (Scoville et al., 2007b). The point source depth is mag deeper but this is not relevant to morphological studies. The median image quality is and (FWHM) in F475W and F814W respectively .
Photometric redshifts are determined from multi-band ground-based photometry (Capak, 2006) as described in Mobasher et al. (2007). Our present investigation is focused on redshifts z to for which the photometric redshifts have an accuracy for galaxies with I mag. The redshift accuracy was determined directly by comparison of the photometric redshifts with spectroscopic redshifts for over 900 galaxies at with I in the COSMOS field.
A magnitude cutoff of was adopted based on experimentation in making morphological measurements. Below this magnitude, the low surface brightness also leads to incompleteness for a typically sized galaxy which is 0.75″in size (Ferguson et al., 2004; Scoville et al., 2007b).
Stars are removed from the object catalog using the SExtractor Bertin & Arnouts (1996) CLASS_STAR parameter measured on the ACS F814W image. Objects with CLASS_STAR are considered to be stars.
A total of 120,187 galaxies meet our magnitude cut of and fall outside of the masked regions on the images. Of these, 32,958 are meet the criteria to be used in our morphology-density analysis (see Section 4 and 6). Table 1 gives the number of objects as a function of redshift.
| Redshift | ||
|---|---|---|
| Range | Look Back Time | |
| 18250 | 2154 | |
| 17419 | 2817 | |
| 27018 | 6193 | |
| 19062 | 7829 | |
| 13075 | 7799 | |
| 7975 | 6166 |
3. Morphological Classification
Galaxies exhibit a range of morphologies which is difficult to quantify automatically. So, classification by eye is often used to test the efficacy of automated classifiers. At high redshifts two additional problems arise : surface brightness dimming () reduces the visibility of disk identifying features such as arms and bars and redshifting (or band shifting) means that the observed visible bands increasingly sample the rest frame ultraviolet (UV). The UV is unlikely to provide a reliable classification of the major galactic stellar components since it is highly biased in favor of the youngest star forming regions and areas of low extinction. These redshift dependent effects introduce systematics which are difficult to separate from the desired evolutionary trends.
Most of the automated morphological classification schemes (Abraham et al., 1994, 1996; Conselice et al., 2003) have focussed on separating elliptical, disk and irregular systems; these galaxies exhibit a wide variety of structure and their appearances are very dependent on viewing angle and other projection effects. On the other hand, dynamically hot systems (E+S0 galaxies) are generally more centrally concentrated (therefore less susceptible to surface brightness dimming) and more spherical (therefore less subject to projection effects). Thus, many difficulties in the morphological classification discussed above are minimized by selecting just the early-type (E+S0) population. Specifically, independent of the method, we classify galaxies with respect to whether they are or are not early-type and do not differentiate within the late type population. This binary classification is entirely adequate for studying the T- relation so long as any systematic biases do no vary with redshift or density.
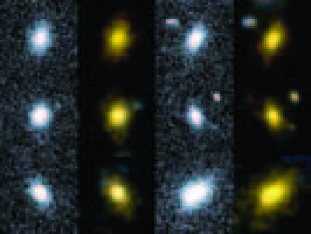
Surface brightness has proven particularly problematic for previous morphological studies (R. Ellis & R. Abraham private communication). Both visual and automated classification schemes miss low surface brightness disks, resulting in systematic effects with magnitude and redshift. These systematic effects can be mitigated by defining the edge of an object in a way which is independent of signal-to-noise per pixel. Figure 1 illustrates one such method for eyeball classifications. The original HST-ACS images are shown together with adaptively smoothed images for several galaxies with faint disks, all of which were visually classified as early-types (Scoville et al., 2007a). The stretch and scale factors are identical for all images. The adaptive smoothing gives equal signal-to-noise per resolution element but with varying spatial resolution dependent on the local signal to noise ratio – i.e. higher resolution in brighter areas. This enhances the visibility of low surface brightness, extended features. In the processed images, spiral structure becomes visible in all four galaxies although it was difficult to see visually in the original images.
Petrosian apertures provide object limits (edges) independent of signal-to-noise per pixel for automated classification methods (Lotz et al., 2004). We use a ‘Quasi-Petrosian’ aperture to minimize the effects of surface brightness dimming. This was constructed using a new algorithm that is intended to work for galaxies of arbitrary shape, and which has more graceful convergence properties than the usual formulation of Petrosian apertures. (Ordinary Petrosian indices are based on circular apertures, and are not guaranteed to converge). The details of our procedure are given in (Abraham et al., 2007b) and only an outline is given here. The first step is to use SExtractor to isolate the galaxy from the sky. The flux values of the pixels in the galaxy are then sorted in decreasing order to construct of curve of sorted flux values. This curve is then summed over to construct a curve of cumulative flux values, which is then multiplied by a scale factor . The flux value where the scaled cumulative distribution intersects the sorted pixel value distribution defines a critical flux value. Only those pixels with fluxes greater than this critical value are used in calculating the ‘Quasi-Petrosian’ coefficients.
Rotational asymmetry and Gini are two commonly used parameters for automated morphological classification (Abraham et al., 1994, 1996; Conselice et al., 2003). The asymmetry coefficient is calculated from the difference between the galaxy image and it’s image rotated 180∘ about it’s central peak. The Gini parameter measures segregation of light into bright and faint pixels and is strongly correlated with the concentration of galaxy light, but the Gini parameter is a more robust indicator of galaxy morphology than the usual concentration coefficient (Abraham et al., 2003). In particular Gini is less sensitive to surface brightness effects and does not require a well defined centroid. Specific details of our Gini and asymmetry measurements are given in Abraham et al. (2007a).
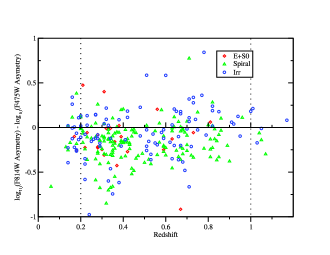
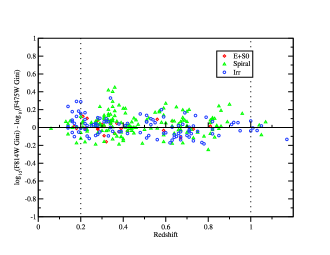
The F814W HST data which covers the whole field will sample a different rest frame wavelength range at each redshift. So any morphological classification scheme used to study galaxy evolution must be independent of the rest frame wavelength. We can test for systematic variations due to band shifting in our data by using the the central 81 square arc minutes of COSMOS with dual band coverage (F814W and F475W). Figure 2 shows the difference between asymmetry measured in F475W and F814W bands with redshift. A shift between the classifications derived in the two bands is observed at where the median wavelength of the F475W band moves into the rest frame ultraviolet (UV) light while F814W still samples the rest frame visible. A shift back to consistent classification occurs at where both bands sample the rest frame UV light. As noted earlier, the rest frame UV selects regions of active star formation which tend to be irregular/clumpy; as a result, the asymmetry is significantly higher in the rest frame UV than in the rest frame optical. Figure 3 shows the difference between Gini measured in F475W and F814W bands with redshift. The scatter is much smaller, and no systematic trends are observed with redshift.
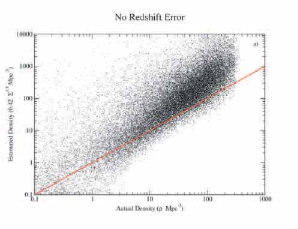
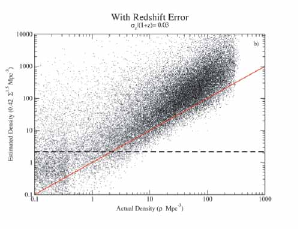
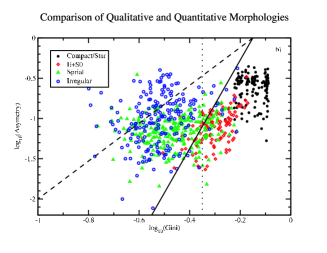
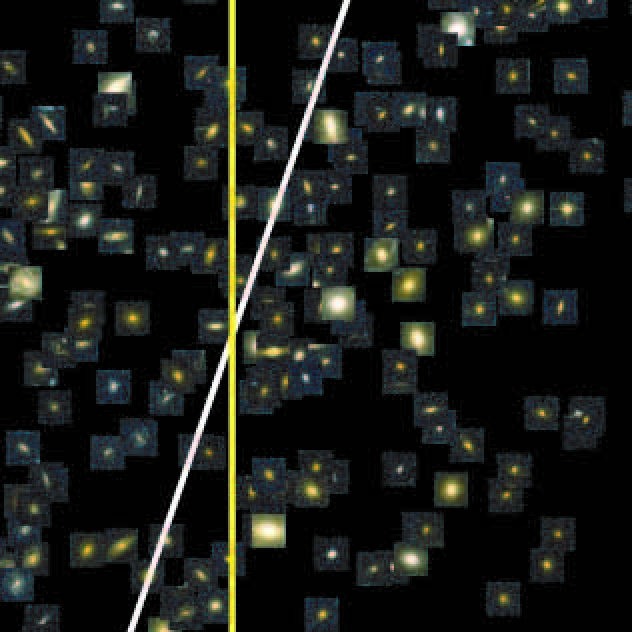
Figure 4 shows a version of the (Abraham et al., 1996) morphology classification system compared to visual morphologies. Visual morphologies were provided by one of us [RSE] for a complete sample of 2000 F814W22.5 galaxies in the inner, dual band coverage region using the precepts discussed in Bundy et al. (2005). The scatter is reasonably large due to the effects of band shifting and surface brightens dimming on the asymmetry coefficient and visual classification. The difference between Spiral and Irregular galaxies is not important for the present investigation of the T- relation; we therefore use only the Gini parameter to classify early-type galaxies. We chose a cut at log10(Gini) as the dividing line between early and late type galaxies because it gave a similar fraction of early and late type galaxies as the Abraham et al. (1996) system at . Figure 5 shows a region of Figure 4 near the division line between early and late type galaxies. The axes are identical, but the symbols have been replaced with color images of the actual galaxies. Our specified cut in Gini coefficient clearly separates early and late type galaxies.
4. Density Estimate
We adopted the Nth neighbor projected density estimate introduced by a number of previous investigators (Dressler, 1980; Dressler et al., 1997; Postman et al., 2005; Smith et al., 2005). The projected density in the vicinity of each galaxy is estimated from the distance to the Nth neighbor. This distance defines the radius of a circle whose area is used to estimate the surface density as:
| (1) |
To be consistent with previous studies, we chose to use the 10th nearest neighbor. A median background density is then subtracted to correct for line of sight superposition due to uncertainties in the distances (ie. redshift). This estimator is optimal when line of sight distances are uncertain since only projected distances need to be estimated.
Photometric redshifts improve the nearest neighbor method in several key ways. The rest-frame absolute luminosity of galaxies can be accurately estimated so similar galaxies (from the same part of the luminosity function) can be selected at all redshifts. The nearest neighbor counting can be done in redshift bins rather than along the entire line of sight, reducing the background contamination and allowing multiple structures to be discriminated in the same field. In addition, the reduction in background galaxy counts enables one to probe to much lower projected densities.
Following Smith et al. (2005) we adopt a luminosity cut of at and allow for one magnitude of passive evolution between and the present. This should select a similar mix of galaxies at all redshifts. Furthermore, maintaining a consistent magnitude cut between studies is very important because the galaxy density and morphological mix may change with magnitude (Benson et al., 2001).
With this magnitude cut and fading due to band shifting our F814W data are sufficiently deep at ; however, a redshift slice of is required around each galaxy to ensure all objects in a structure are measured. As a result, we are only able to accurately measure densities for .
4.1. Accuracy of the Density Estimator
The accuracy of the photometric redshifts determines the minimum density to which the Nth nearest neighbor method will work. This minimum density can be estimated by considering a structure of density embedded in a random background of density , where is the number density of galaxies per per redshift interval. The projected density of background sources for a slice of thickness along the line of sight is then . Assuming that is large enough to include all galaxies within the structure, the fraction of galaxies actually in the structure is given by:
| (2) |
Equation 2 can also be inverted to define a minimum density above which a certain fraction of the galaxies will be members of a given structure. We do not need to consider Poisson error because is determined with the same number of galaxies at all densities.
In the present data, the largest redshift error is at , where and Mpc2. This means 50% of galaxies will be assigned to the correct structures at Mpc2 and 77% will be correctly assigned at Mpc2. At , and Mpc2, so 42% of galaxies will be assigned to the correct structures at Mpc2 and 71% will be correctly assigned at Mpc2.
4.2. Relation of with Volume Density
Ideally, one would measure volume densities rather than projected densities. Unfortunately, the line of sight error from photometric redshifts make volume densities difficult to measure (Cooper et al., 2005). To first order, the relation between the projected mean density, , and volume density is:
| (3) |
if we assume spherical symmetry.
To see how well this relation holds we created a simulated galaxy catalog with structures of known density. The structures had a gaussian density profile and peak densities ranging from to galaxies per Mpc3, similar to the observed range in COSMOS. The results are shown in Figure 6a. There is a strong correlation between the input and recovered densities for all but the sparsest regions (below galaxies per Mpc2), where our assumption of spherical symmetry breaks down. Furthermore, the same assumption appears to overestimate the true density by a factor of . This is also due to our assumption of spherical symmetry, which will underestimate the true volume. This offset is only applicable if projected densities used in this paper are converted to real space densities. No offset is observed between projected densities measured with and without redshift error.
In addition to these effects, objects in low density regions projected in front of or behind a dense region are scattered to higher densities; however, the fraction of these objects is less than 2% of the total, and can be neglected. Figure 6b shows the effect of redshift error on the density analysis. The scatter is larger than Figure 6a due to the line of sight errors, however the real space density is clearly recoverable.
Similar tests by Cooper et al. (2005) on mock galaxy catalogs from CDM simulations agree with our results (see Table 2 and Figure 1 in Cooper et al. (2005)). However, the average density in the COSMOS data is significantly higher than those in the Cooper et al. simulations, which leads Cooper et al. to conclude that the accuracy of photometric redshifts is not sufficient for the majority of galaxies. A density of galaxies per Mpc2 corresponds to D in Cooper et al., above which there are very few galaxies in their simulation, but a significant number of galaxies in the COSMOS data.
To understand these differences we applied our estimator to mock galaxy catalogs provided by the Millennium simulation (Springel et al., 2005). These are the same simulation used by Cooper et al., but with dimensions and limiting magnitudes for the COSMOS survey. As found by Cooper et al. densities above galaxies per Mpc2 are successfully measured with photometric redshifts. However, the number of galaxies at densities greater than 3 galaxies per Mpc2 in the Millennium simulation is considerably lower than those in the COSMOS data. Figure 7 shows the distribution of densities recovered from the Millennium simulation and from the COSMOS survey. At densities above there are a factor of more galaxies in the COSMOS survey than the v2.0 simulations.
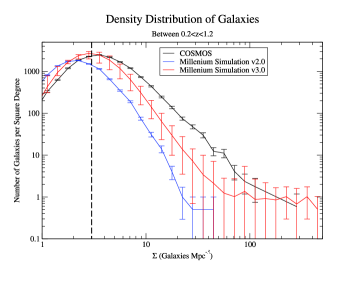
The discrepancy in density distribution is due to the way galaxies are distributed within dark matter haloes. In earlier versions of the Millennium simulation galaxy orbits were not followed in detail after dark matter haloes merged (M. Kitzbichler & S. White private communication). This resulted in systematically fewer galaxies in high density regions. This has been corrected in the latest versions (v3.0 and newer) of the simulation, improving the agreement, but still underestimating the number of galaxies in high density regions (See Figure 7). However, McCracken et al. (2007) find a higher amplitude in both the overall correlation function and the correlation function on small scales than predicted by the mock catalogs, which indicates the mock catalogs still tend to under-populate dense regions.
5. Comparison With Literature Data
| Reference | Redshift | H0 | Magnitude Limit | Correction to | Correction to | ||
|---|---|---|---|---|---|---|---|
| Range | (km s-1 Mpc-1) | M 11In a H, , cosmology | Density22In units of log. The correction includes conversion to a H, , cosmology and an offset for the different magnitude limits. | FE+S0 | |||
| Dressler (1980) | 0.011-0.066 | 50 | 1.0 | 0.0 | -19.75 | -0.33 | 0.0 |
| Goto et al. (2003) | 0.05-0.1 | 75 | 0.3 | 0.7 | -20.333The actual limit is M, which corresponds to M at the median galaxy color. | 0.0 | 0.0 |
| Dressler et al. (1997) | 0.37-0.56 | 50 | 1.0 | 0.0 | -20.0 | -0.47 | -0.045 |
| Treu et al. (2003) | 0.4 | 65 | 0.3 | 0.7 | -18.7 | -0.38 | -0.056 |
| Smith et al. (2005) | 0.78-1.27 | 65 | 0.3 | 0.7 | -21.244The values given are for , Smith et al. (2005) allows for one magnitude of passive evolution between and , while Postman et al. (2005) allows for 0.8 magnitude of passive evolution. | -0.12 | 0.0 |
| Postman et al. (2005) | 0.4-1.27 | 70 | 0.3 | 0.7 | -20.0744The values given are for , Smith et al. (2005) allows for one magnitude of passive evolution between and , while Postman et al. (2005) allows for 0.8 magnitude of passive evolution. | -0.32 | -0.045 |
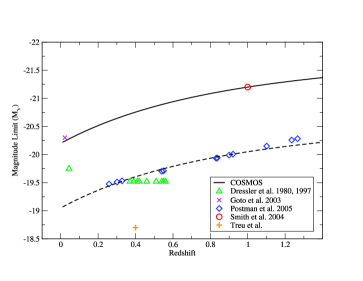
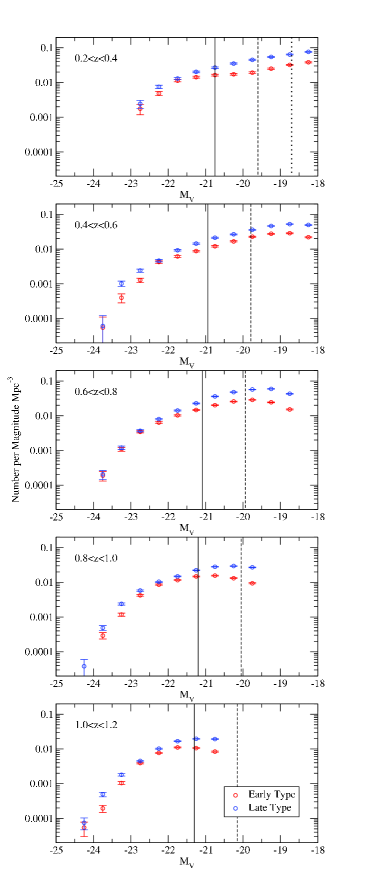
It is important to maintain a consistent magnitude limit when studying the morphology density relation because the galaxy density and morphological mix may change with magnitude (Benson et al., 2001) (see Section 4). Dressler (1980); Dressler et al. (1997); Postman et al. (2005) and Treu et al. (2003) use a magnitude limit more than a magnitude fainter than Goto et al. (2003); Smith et al. (2005) and our work (see Figure 8). To quantify the effects of the different limiting magnitudes in the literature we began by constructing morphologically selected luminosity functions uncorrected for incompleteness at the faint end. These are shown for five redshift bins in Figure 9. The solid lines mark our magnitude limit, while the dashed line indicates the fainter limit used by Dressler (1980); Dressler et al. (1997) and Postman et al. (2005). A dotted line in the bin indicates the limit used by Treu et al. (2003). The overall fraction of late type galaxies is clearly higher at fainter magnitudes. In addition our data becomes incomplete at for the fainter magnitude limits.
We estimate corrections for the differing magnitude limits by analyzing our data with three magnitude limits at : , , and . All three analysis include 1 magnitude of passive evolution between and the present. The limit corresponds to Dressler et al. (1997) and Postman et al. (2005), while matches the Treu et al. (2003) work at .
The density measured with both fainter magnitude limits is 0.26 dex higher than that measured with at densities above galaxies per Mpc2. This offset appears to vary with density at galaxies per Mpc2. However, these densities are not reliable (see Section 4.1) and the trend is not apparent at higher density. No trend with redshift was observed in either magnitude bin or at any density.
The early-type fraction is 0.045 lower using a limit of , and 0.056 lower with a limit of than with a limit of . No significant trends in these offset are observed with density between galaxies per Mpc2 or redshift between . However, we do not probe the highest densities and redshifts used in the literature.
A summary of the literature data and the correction factors applied is given in Table 2.
6. Results
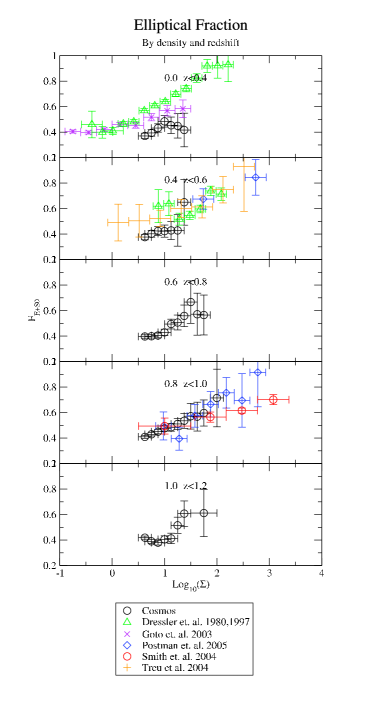
Our measurements of the T- relation, along with those taken from the literature (Dressler, 1980; Dressler et al., 1997; Goto et al., 2003; Smith et al., 2005; Postman et al., 2005), are shown in Figure 10 for five redshift bins. The densities for the literature points have been converted to a , , cosmology and corrected for differences in the limiting magnitude. After applying these corrections, our data is consistent with the earlier studies. The COSMOS data significantly improves the precision of the early-type morphological fraction, and increases the redshift and density resolution, compared to earlier studies. We find that the T- relation was already in place at , but differs from the local relation. As seen in previous studies (Postman et al., 2005; Smith et al., 2005), the early-type fraction is smaller and increases more gradually with density at than the at .
The evolution of the T- relation with redshift is encapsulated in Figure 11. This figure shows the fraction of early-type galaxies as a function of time for four different density bins—growth in the early-type fraction with look-back time is seen at all densities with more rapid growth at higher densities. However, the majority of the evolution occurs at for densities below galaxies per Mpc2. Assuming the growth rate of the early-type fraction is smooth, a line can be fit to the data at each density bin in Figure 11. The slope of this line yields the growth rate of the early-type fraction at any given density, which are plotted in Figure 12.
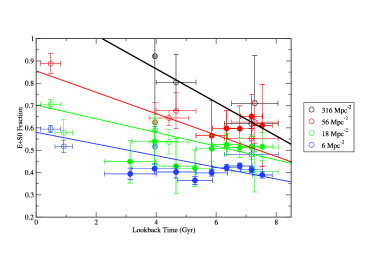
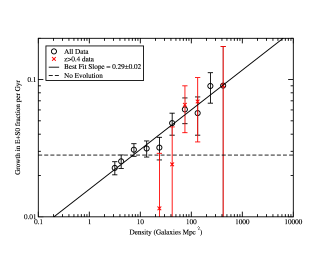
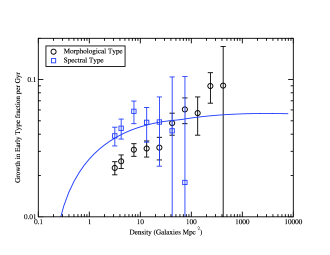
Figure 12 shows a clear trend for more rapid early-type (E+S0) production at higher densities. The data are well fit by a power law with a slope of . However, without the points the growth rate drops off quickly at densities below galaxies per Mpc2. It should be noted that points above galaxies per Mpc2 come entirely from cluster surveys in the literature. However, it is unlikely that the observed evolution is due to systematic effects because all three studies (Treu et al., 2003; Smith et al., 2005; Postman et al., 2005) at these redshifts and densities use the same visual morphological classification system, and the trend to stronger evolution at higher density is seen by both Smith et al. (2005) and Postman et al. (2005) independently.
The growth in the fraction of non-star forming (passive) galaxies is shown in Figure 13 along with the data from Figure 12. The spectral types are drawn from a similar analysis in Scoville et al. (2007a), however, the density measure and magnitude limit are the same ones used in this study, not those from Scoville et al. (2007a). Note the difference in the evolution measured from star formation and morphology.
Many bulge dominated but elongated objects with higher asymmetry (seen near the top of Figure 4) are selected by both the Abraham et al. and our early-type selection. These elongated objects are likely edge on S0 galaxies. The Gemini-Deep-Deep-Survey (GDDS) finds that many of these elongated objects have residual star formation (Abraham et al., 2004). Although such object with active star formation activity do not strictly meet the criteria of early-type galaxies, they are bulge dominated, and hence more dynamically relaxed than galaxies with smaller Gini co-efficent. These objects are likely progenitors of S0’s or galaxies with early-type morphology undergoing a burst of star formation. Furthermore, since our Gini parameter is invariant with redshift, the same fraction of the galaxy population will be selected at all redshifts, implying that any contamination will not affect the observed evolution.
However, it is important to remember there are multiple sub-classes of early-type galaxies, and each sub-class could be evolving differently. Postman et al. (2005) investigate this effect by analyzing the ellipticity distribution of cluster early-type galaxies and find no evolution in the ellipticity distribution between and . A similar analysis of our data for galaxies per Mpc2 also finds no evolution in the ellipticity distribution of early-types. A Kolmogorov-Smirnov test finds the distribution of ellipticities at is consistent with those at with 96.5% certainty. Therefore, any differential evolution in the E and S0 population is not seen in the overall ellipticity distribution of early-type galaxies.
7. Discussion
Whether the morphology-density (T-) relation is an intrinsic property of cluster galaxies or a result of environmental influence has been a matter of debate for some time. In contemporary simulations of galaxy formation the majority of galaxies begin as dynamically cold, gas rich, star forming disks. They are subsequently transformed into early-type systems through interactions with other galaxies or by losing or exhausting the gas required to form stars. In this context there are two hypothesis explaining the T- relation: dense regions formed earlier than sparse ones, and dens regions have stronger and more frequent interactions. A third hypothesis is that dense regions intrinsically form a higher fraction early-types, and that no transformation is needed.
The relative importance of these hypothesis can be separated with a simple closed box model. If galaxy clusters were closed systems one would expect the growth in the early-type fraction to slow with time as the fraction of early-type galaxies increases. This occurs because there are fewer late type galaxies left to transform as the early-type fraction approaches 100%. Formally, the growth rate is given by:
| (4) |
where the rate of change in the number density of early-type galaxies NE+S0 is given by the total number density of galaxies N, and the conversion rate of late to early-type galaxies per unit time as a function of density, . Integrating Equation 4 with respect to time we get:
| (5) |
where is the early-type fraction at time t, is the primordial fraction of early types at a given density, and is the cluster formation time. This equation can be differentiated to yield:
| (6) |
If we assume constant and the observed increase in the production rate of early-type galaxies with density suggests cluster galaxies formed significantly later than the field galaxies. Since detailed studies of cluster ellipticals indicate they are older than their counterparts in the field (Bower et al., 1992; Ellis et al., 1997; Stanford et al., 1998; Lucey et al., 1991; van Dokkum & Franx, 1996; Bender et al., 1998; Pahre et al., 1998; Kelson et al., 2000), we can rule out differences in formation time as the sole source of the T- relation. A model were increases with density, but , is also ruled out by the data if we require that formation time is constant or increasing with density. A combination of earlier formation times in dense regions, increasing transformation rates with density, and an intrinsically higher early type fractions in dense regions is required to explain the observed data with a closed box model. However, simply allowing for galaxy in-fall also explains the observed evolution.
Dynamical friction or “harassment” (Spitzer, 1958; Moore et al., 1998) is the most likely source of an increased late to early type transformation rate in dense regions. This process operates by increasing the orbital energy of stars inside individual galaxies through tidal interactions. The rate of momentum exchange due to dynamical friction increases with density, which naturally leads to the observed increase in transformation rate. Furthermore, Goto (2005) find differences in the velocity dispersion of cluster early and late type galaxies which can be explained if the early type galaxies underwent more dynamical friction than the late type galaxies, but can not be explained by gas stripping. Finally, the amount of energy transfered to a galaxy through dynamical friction is proportional to the galaxy mass (Spitzer, 1958; Moore et al., 1998; Goto, 2005), so the color-magnitude and fundamental plain relations may also be a consequence.
Intrinsic differences in the galaxy formation process between clusters and the field also appear to be important in determining galaxy morphology. Using only our data, no evolution is measured in the T- relation, but COSMOS only covers redshifts greater than 0.4 and densities below galaxies per Mpc2. At higher densities, evolution is independently observed by both Smith et al. (2005) and (Postman et al., 2005). Nevertheless, the lack of evolution at low densities suggests the galaxy formation process may be intrinsically different in dense regions than sparse.
Bundy et al. (2006) also find intrinsic differences in the galaxy formation process may be more important than environment. They show the star formation properties of galaxies are more correlated with galaxy mass than environment. Environment is only important when the local galaxy density was significantly greater than the field density. If a similar statement can be made for morphologies, it would explain why evolution is only observed in the highest density regions.
However, morphology and star formation appear to be affected by different processes. The fraction of galaxies with early-type morphologies and the fraction with low star-formation rates evolve in different ways with density (see Figure 13). These different rates of evolution can be explained if the growth in the early type fraction were driven by interactions, while the reduction in star formation was caused by gas stripping .
Assuming gas removal due to cluster interactions is responsible for truncating the star formation, we can recycle our closed box model to describe the process. For the SFR- relation because stars must form to make galaxies. If the gas density traces the galaxy density, becomes the rate at which star-formation is truncated and becomes the formation time for the cluster. This simple model accurately reproduces the observed shape and evolution of the SFR- relation while also predicting reasonable galaxy formation times. However, points at much lower density than what we can probe with photometric redshifts are required to confirm the gas striping hypothesis.
Nevertheless, several studies of the local universe also suggest the SFR- relation is driven by gas stripping, while the T- relation is due to galaxy interactions. Blanton et al. (2005) find color is a better predictor of density than morphology, indicating star formation is strongly affected by environment while early-type morphologies are not necessarily the result of environment. Further evidence is provided by Quintero et al. (2006), who find both morphology and color are correlated with distance from cluster centers, but the correlation between morphology and star-formation is asymmetric. Specifically, for a given star formation rate, the fraction of morphological early-type galaxies does not change with distance from the cluster, but at a given morphological type, the average star formation rate increases with distance from the cluster. In addition, both Dressler et al. (1997) and Treu et al. (2003) show morphology is more strongly correlated with local density than distance to the cluster center, indicating the number of neighbors and hence the number of interactions is the more important quantity in determining morphology.
Galaxy in-fall may also play a role in shaping the T- relation. It is predicted by CDM models, but it is difficult to explain the small scatter in the colors and fundamental plane of cluster ellipticals if most early-type galaxies were recently transformed from field galaxies. Nevertheless, Treu et al. (2003) point out that the dynamics of galaxy clusters would erase the T- relation if the orbits of individual galaxies were not confined to regions of nearly constant density. So, if in-fall is responsible galaxies are likely accreted smoothly via dynamical friction from adjacent regions of already elevated density.
There is no quantitative study of how harassment or gas starvation should affect the evolution of the T- relation. Benson et al. (2001) attempts to model evolution of the T- relation at low densities in cold dark matter (CDM) simulations via halo mergers. The amplitude of the predicted evolution is correct at galaxies per Mpc2, and no differential evolution is seen at lower densities. Unfortunately, at higher densities, where we have the bulk of our data, the Benson et al. model is not valid because individual galaxy orbits are not tracked once the dark matter halos merge, so no comparison can be made.
Clearly more detailed models are needed, but care must be taken when comparing the results. A magnitude-morphology relation is predicted by most CDM models, so changing the magnitude limit used to measure density will change the observed T- relation and its observed evolution. As a result, it is very important to match the absolute magnitude cuts when comparing models and data. Furthermore, the present measurements do not distinguish between moderate density regions on the outskirts of massive clusters and the centers of moderate mass groups. Treu et al. (2003) find this distinction is not important, nevertheless, it remains a potential source of systematic uncertainty in our measurements.
In considering Figure 11, several limitations of our present data become evident. Our measurement of the early-type growth rate strongly depend on the local measurements from Goto et al. (2003) and Dressler (1980) which use a different morphological classification scheme. Furthermore, the large gap in data between , which is nearly a quarter of the cosmic time we probe, limits our ability to measure how the growth in the early-type fraction changes with time. COSMOS has too small an area and the SDSS has neither the depth nor the spatial resolution to probe the T- relation in this gap. To probe a volume at comparable to COSMOS at , a survey would have to cover square degrees with seeing in one band.
8. Conclusions
We have developed a technique for measuring the early-type galaxy fraction with density and redshift. The Gini parameter is found to reliably select early-type galaxies between using only the ACS F814W filter. This selection is free from systematic effects in red-shift (band shifting) or surface brightness.
We find densities are measurable with photometric redshifts if projected densities are used. Nevertheless, for photometric redshift accuracies of projected densities below galaxies per Mpc2 are difficult to measure. The observed number of galaxies at a galaxies per Mpc2 is significantly higher than that found in earlier CDM galaxy simulations because these simulations did not follow the orbits of galaxies within dark matter haloes. The latest simulations now follow galaxies, improving the agreement, but still underestimating the number of galaxies in dense regions.
Using these techniques we measure the evolution of the T- relation and the growth rate of the early-type fraction with cosmic time. We find the growth rate of the early-type fraction is increasing with density, which can not be explained by a closed box model with early formation times. We conclude some density dependent process combined with galaxy in fall is responsible for the observed relation and evolution, with dynamical friction and harassment being the most likely mechanisms.
The SFR- relation appears to result from different processes than the T- relation. In particular, SFR- relation evolves differently from the T- relation and there does not appear to be a direct relationship between the two. Gas stripping is the most likely source of the SFR- relation.
At galaxies per Mpc2, the rate of dark halo interactions in CDM models predict the correct amplitude of growth in the early-type fraction, but these models are not valid at higher densities. No current model attempts to predict our observed evolution at , so we can only speculate as to what physical mechanisms must be at play. Furthermore, the current generation of CDM models appear to under-estimate the number of galaxies in high density regions.
Acknowledgments
References
- Abraham et al. (2004) Abraham, R. G., Glazebrook, K., McCarthy, P. J., Crampton, D., Murowinski, R., Jørgensen, I., Roth, K., Hook, I. M., Savaglio, S., Chen, H.-W., Marzke, R. O., & Carlberg, R. G. 2004, AJ, 127, 2455
- Abraham et al. (2007a) Abraham, R. G., McCarthy, P. J., Glazebrook, K., Mentuch, E., Nair, P., Yan, H., Savaglio, S., Crampton, D., Murowinski, R., Juneau, S., Le Borgne, D., Carlberg, R. G., Jorgensen, I., Roth, K., Chen, H.-W., & Marzke, R. O. 2007a, ArXiv Astrophysics e-prints
- Abraham et al. (2007b) Abraham, R. G., Nair, P., Ellis, R. S., & van den Bergh, S. 2007b, ApJ
- Abraham et al. (1996) Abraham, R. G., Tanvir, N. R., Santiago, B. X., Ellis, R. S., Glazebrook, K., & van den Bergh, S. 1996, MNRAS, 279, L47
- Abraham et al. (1994) Abraham, R. G., Valdes, F., Yee, H. K. C., & van den Bergh, S. 1994, ApJ, 432, 75
- Abraham et al. (2003) Abraham, R. G., van den Bergh, S., & Nair, P. 2003, ApJ, 588, 218
- Bauer et al. (2005) Bauer, A. E., Drory, N., Hill, G. J., & Feulner, G. 2005, ApJ, 621, L89
- Bender et al. (1998) Bender, R., Saglia, R. P., Ziegler, B., Belloni, P., Greggio, L., Hopp, U., & Bruzual, G. 1998, ApJ, 493, 529
- Benson et al. (2001) Benson, A. J., Frenk, C. S., Baugh, C. M., Cole, S., & Lacey, C. G. 2001, MNRAS, 327, 1041
- Bertin & Arnouts (1996) Bertin, E. & Arnouts, S. 1996, A&AS, 117, 393
- Blanton et al. (2005) Blanton, M. R., Eisenstein, D., Hogg, D. W., Schlegel, D. J., & Brinkmann, J. 2005, ApJ, 629, 143
- Bower et al. (1992) Bower, R. G., Lucey, J. R., & Ellis, R. S. 1992, MNRAS, 254, 601
- Bundy et al. (2005) Bundy, K., Ellis, R. S., & Conselice, C. J. 2005, ApJ, 625, 621
- Bundy et al. (2006) Bundy, K., Ellis, R. S., Conselice, C. J., Taylor, J. E., Cooper, M. C., Willmer, C. N. A., Weiner, B. J., Coil, A. L., Noeske, K. G., & Eisenhardt, P. R. M. 2006, ApJ, 651, 120
- Butcher & Oemler (1984) Butcher, H. & Oemler, A. 1984, ApJ, 285, 426
- Capak (2006) Capak, P. 2006, ApJ, 999, 999
- Conselice et al. (2003) Conselice, C. J., Bershady, M. A., Dickinson, M., & Papovich, C. 2003, AJ, 126, 1183
- Cooper et al. (2005) Cooper, M. C., Newman, J. A., Madgwick, D. S., Gerke, B. F., Yan, R., & Davis, M. 2005, ApJ, 634, 833
- Cowie et al. (1999) Cowie, L. L., Songaila, A., & Barger, A. J. 1999, AJ, 118, 603
- Dickinson et al. (2003) Dickinson, M., Papovich, C., Ferguson, H. C., & Budavári, T. 2003, ApJ, 587, 25
- Dressler (1980) Dressler, A. 1980, ApJ, 236, 351
- Dressler et al. (1997) Dressler, A., Oemler, A. J., Couch, W. J., Smail, I., Ellis, R. S., Barger, A., Butcher, H., Poggianti, B. M., & Sharples, R. M. 1997, ApJ, 490, 577
- Drory et al. (2005) Drory, N., Salvato, M., Gabasch, A., Bender, R., Hopp, U., Feulner, G., & Pannella, M. 2005, ApJ, 619, L131
- Ellis et al. (1997) Ellis, R. S., Smail, I., Dressler, A., Couch, W. J., Oemler, A. J., Butcher, H., & Sharples, R. M. 1997, ApJ, 483, 582
- Ferguson et al. (2004) Ferguson, H. C., Dickinson, M., Giavalisco, M., Kretchmer, C., Ravindranath, S., Idzi, R., Taylor, E., Conselice, C. J., Fall, S. M., Gardner, J. P., Livio, M., Madau, P., Moustakas, L. A., Papovich, C. M., Somerville, R. S., Spinrad, H., & Stern, D. 2004, ApJ, 600, L107
- Feulner et al. (2005) Feulner, G., Gabasch, A., Salvato, M., Drory, N., Hopp, U., & Bender, R. 2005, ApJ, 633, L9
- Glazebrook et al. (2004) Glazebrook, K., Abraham, R. G., McCarthy, P. J., Savaglio, S., Chen, H.-W., Crampton, D., Murowinski, R., Jørgensen, I., Roth, K., Hook, I., Marzke, R. O., & Carlberg, R. G. 2004, Nature, 430, 181
- Goto (2005) Goto, T. 2005, MNRAS, 359, 1415
- Goto et al. (2003) Goto, T., Yamauchi, C., Fujita, Y., Okamura, S., Sekiguchi, M., Smail, I., Bernardi, M., & Gomez, P. L. 2003, MNRAS, 346, 601
- Hubble (1926) Hubble, E. P. 1926, ApJ, 64, 321
- Juneau et al. (2005) Juneau, S., Glazebrook, K., Crampton, D., McCarthy, P. J., Savaglio, S., Abraham, R., Carlberg, R. G., Chen, H.-W., Le Borgne, D., Marzke, R. O., Roth, K., Jørgensen, I., Hook, I., & Murowinski, R. 2005, ApJ, 619, L135
- Kauffmann et al. (2004) Kauffmann, G., White, S. D. M., Heckman, T. M., Ménard, B., Brinchmann, J., Charlot, S., Tremonti, C., & Brinkmann, J. 2004, MNRAS, 353, 713
- Kelson et al. (2000) Kelson, D. D., Illingworth, G. D., van Dokkum, P. G., & Franx, M. 2000, ApJ, 531, 137
- Koekemore et al. (2007) Koekemore, A Aussel, H., Brusa, M., Capak, P., Carollo, C. M., Elvis, M., Giavalisco, M., Guzzo, L., Hasinger, G., Impey, C., Kneib, J. P., LeFevre, O., J. Lilly, S., Mobasher, B., Renzini, A., Rich, R. M., Sanders, D. B., Schinnerer, E., Schminovich, D., Shopbell, P., Taniguchi, Y., & Tyson, N. D. 2007, ApJ
- Lilly et al. (1995) Lilly, S. J., Le Fevre, O., Crampton, D., Hammer, F., & Tresse, L. 1995, ApJ, 455, 50
- Lotz et al. (2004) Lotz, J. M., Primack, J., & Madau, P. 2004, AJ, 128, 163
- Lucey et al. (1991) Lucey, J. R., Bower, R. G., & Ellis, R. S. 1991, MNRAS, 249, 755
- McCracken et al. (2007) McCracken, H. J., Aussel, H., Capak, P., El-Zant, A., Guzzo, L., & Scoville, N. Z. 2007, ApJ
- Melnick & Sargent (1977) Melnick, J. & Sargent, W. L. W. 1977, ApJ, 215, 401
- Mobasher et al. (2007) Mobasher, B., Capak, P., Scoville, N., Dahlen, T., Salvato, M., Aussel, H., Thompson, D., & Feldman, R. 2007, ApJ
- Moore et al. (1998) Moore, B., Lake, G., & Katz, N. 1998, ApJ, 495, 139
- Oemler (1974) Oemler, A. J. 1974, ApJ, 194, 1
- Pahre et al. (1998) Pahre, M. A., de Carvalho, R. R., & Djorgovski, S. G. 1998, AJ, 116, 1606
- Postman et al. (2005) Postman, M., Franx, M., Cross, N. J. G., Holden, B., Ford, H. C., Illingworth, G. D., Goto, T., Demarco, R., Rosati, P., Blakeslee, J. P., Tran, K.-V., Benítez, N., Clampin, M., Hartig, G. F., Homeier, N., Ardila, D. R., Bartko, F., Bouwens, R. J., Bradley, L. D., Broadhurst, T. J., Brown, R. A., Burrows, C. J., Cheng, E. S., Feldman, P. D., Golimowski, D. A., Gronwall, C., Infante, L., Kimble, R. A., Krist, J. E., Lesser, M. P., Martel, A. R., Mei, S., Menanteau, F., Meurer, G. R., Miley, G. K., Motta, V., Sirianni, M., Sparks, W. B., Tran, H. D., Tsvetanov, Z. I., White, R. L., & Zheng, W. 2005, ApJ, 623, 721
- Quintero et al. (2006) Quintero, A. D., Berlind, A. A., Blanton, M., & Hogg, D. W. 2006, ArXiv Astrophysics e-prints
- Scoville et al. (2007a) Scoville, N. Z., Aussel, H., Benson, A. J., Blain, A., Calzetti, D., Capak, P., Ellis, R. S., El-Zant, A., Finoguenov, A., Giavalisco, M., Guzzo, L., Hasinger, G., Koda, J., LeFevre, O., Massey, R., McCracken, H. J., Mobasher, B., Renzini, A., Rhodes, J., Salvato, M., Sanders, D. B., Sasaki, S., Schinnerer, E., Sheth, K., Shopbell, P. L., Tanaguchi, Y., Taylor, J. E., & Thompson, D. 2007a, ApJ
- Scoville et al. (2007b) Scoville, N. Z., Aussel, H., Brusa, M., Capak, P., Carollo, C. M., Elvis, M., Giavalisco, M., Guzzo, L., Hasinger, G., Impey, C., Kneib, J. P., LeFevre, O., J. Lilly, S., Mobasher, B., Renzini, A., Rich, R. M., Sanders, D. B., Schinnerer, E., Schminovich, D., Shopbell, P., Taniguchi, Y., & Tyson, N. D. 2007b, ApJ
- Smith et al. (2005) Smith, G. P., Treu, T., Ellis, R. S., Moran, S. M., & Dressler, A. 2005, ApJ, 620, 78
- Somerville (2005) Somerville, R. S. 2005, in Multiwavelength Mapping of Galaxy Formation and Evolution, ed. A. Renzini & R. Bender, 131–+
- Spitzer (1958) Spitzer, L. J. 1958, ApJ, 127, 17
- Springel et al. (2005) Springel, V., White, S. D. M., Jenkins, A., Frenk, C. S., Yoshida, N., Gao, L., Navarro, J., Thacker, R., Croton, D., Helly, J., Peacock, J. A., Cole, S., Thomas, P., Couchman, H., Evrard, A., Colberg, J., & Pearce, F. 2005, Nature, 435, 629
- Stanford et al. (1998) Stanford, S. A., Eisenhardt, P. R., & Dickinson, M. 1998, ApJ, 492, 461
- Treu et al. (2003) Treu, T., Ellis, R. S., Kneib, J., Dressler, A., Smail, I., Czoske, O., Oemler, A., & Natarajan, P. 2003, ApJ, 591, 53
- van Dokkum & Franx (1996) van Dokkum, P. G. & Franx, M. 1996, MNRAS, 281, 985