The WSRT Virgo Filament Survey
Abstract
In the last few years the realization has emerged that the universal baryons are almost equally distributed by mass in three components: (1) galactic concentrations, (2) a warm-hot intergalactic medium (WHIM) and (3) a diffuse intergalactic medium. These three components are predicted by hydrodynamical simulations and are probed by QSO absorption lines. To observe the WHIM in neutral hydrogen, observations are needed which are deeper than log(NHI)=18. The WHIM should appear as a Cosmic Web, underlying the galaxies with higher column densities. We have used the WSRT, to simulate a filled aperture by observing at very high hour angles, to reach very high column density sensitivity. To achieve even higher image fidelity, an accurate model of the WSRT primary beam was developed. This will be used in the joint deconvolution of the observations. To get a good overview of the distribution and kinematics of the Cosmic Web, a deep survey of 1500 square degrees of sky was undertaken, containing the galaxy filament extending between the Local Group and the Virgo Cluster. The auto-correlation data has been reduced and has an RMS of cm-2 over 20 kms-1. Several sources have been tentatively detected, which were previously unknown, as well as an indication for diffuse intergalactic filaments.
keywords:
Cosmic Web , IGM , WHIM1 Introduction
The number of detected baryons in the Low Redshift Universe is significantly below expectations. According to cosmological measurements the baryon fraction is about 4 at (Bennett et al. (2003); Spergel et al. (2003)). This is consistent with actual numbers of baryons detected at (Weinberg et al. (1997); Rauch (1998)). In the current epoch however, at about half of this matter has not been observed (Fukugita et al. (1998); Cen & Ostriker (1999); Tripp et al. (2000); Savage et al. (2002); Penton et al. (2004)).
Recent hydrodynamical simulations give a possible solution for the ¨Missing Baryon¨ problem (Cen & Ostriker (1999); Davé et al. (2001); Fang et al. (2002)). These simulations show that in the current epoch, cosmic baryons are almost equally distributed amongst three phases (Davé et al., 1999): (1) diffuse phase, (2) a shocked phase and (3) a condensed phase. The diffuse phase is associated with warm, low-density photo-ionized gas. The shocked phase consists of gas that has been heated by shocks during structure formation, with a moderate overdensity. Because the temperature range is very broad from to K, it is also called the Warm Hot Intergalactic Medium (WHIM). The condensed phase is associated with cool galactic concentrations. These three components are each coupled to a decreasing range of baryonic over-density: 1, 1-3.5, and 3.5 and are probed by QSO absorption lines with specific ranges of neutral column density: log 14, 14-18 and 18 (Braun & Thilker, 2005).
2 WHIM
The Warm Hot Intergalactic Medium is thought to be formed during structure formation. Low density gas is heated by shocks during its infall onto the filaments that define the Large Scale Structure of the Universe. Most of these baryons are still concentrated in unvirialized filamentary structures of highly ionized gas.
The WHIM has been observationally detected in O VI absorption (Tripp et al., 2004), but also via Ne VIII (Savage et al., 2005) and X-ray absorption (Nicastro et al., 2005). Of course absorption studies alone, do not give us complete information on the spatial distribution of the WHIM. Emission from the WHIM would give entirely new information about the distribution and kinematics.
Direct detection of the WHIM is very difficult in the EUV and X-ray bands (Cen & Ostriker, 1999). The gas is ionized to such a degree, that it becomes “invisible” in infrared, optical or UV light, but should be visible in the FUV and X-ray bands (Nicastro et al., 2005). Given the very low density, extremely high sensitivity and a large field of view is needed to image the filaments. Capable detectors are not yet available for the X-ray or FUV (Yoshikawa et al. (2003); Nicastro et al. (2005)).
Large-scale gas filaments have been detected in X-ray emission (Wang et al. (1997); Scharf et al. (2000); Tittley & Henriksen (2001)). With the current facilities, these X-ray emission studies reveal gas which is hotter and denser than the WHIM. This gas is not expected to contain a substantial part of WHIM baryons at the current epoch (Davé et al., 2001). The WHIM should be most prominent in the soft X-ray band. The interstellar medium of the Galaxy complicates its detection since in the soft X-ray band the Galaxy is a strong source of emission at an effective temperature of K. The neutral hydrogen in the Galaxy on the other hand, prevents observations of the EUV.
We have adopted a different approach by observing the WHIM in neutral hydrogen emission.
At the current epoch we can confidently predict that in going down from HI column densities of cm-2 (which define the current ¨edges¨ of well studied nearby galaxies in HI emission) to cm -2 the surface area will increase by a factor of 30 (Braun & Thilker, 2004). The critical observational challenge is crossing the “HI desert”, the range of log(NHI) from about 19.5 down to 18 over which photo-ionization by the intergalactic radiation field produces an exponential decline in the neutral fraction from essentially unity down to a few percent (eg. Dove & Shull (1994)). Nature is kinder again to the HI observer below log(NHI) = 18, where the neutral fraction decreases only very slowly with log(NHI). The neutral fraction of hydrogen is thought to decrease with decreasing column density from about 100 for 19.5 to about 1 at (Dove & Shull, 1994). The baryonic mass traced by this gas (with a 1 or less neutral fraction ) is expected to be comparable to that within the galaxies, as noted above.
3 Observations
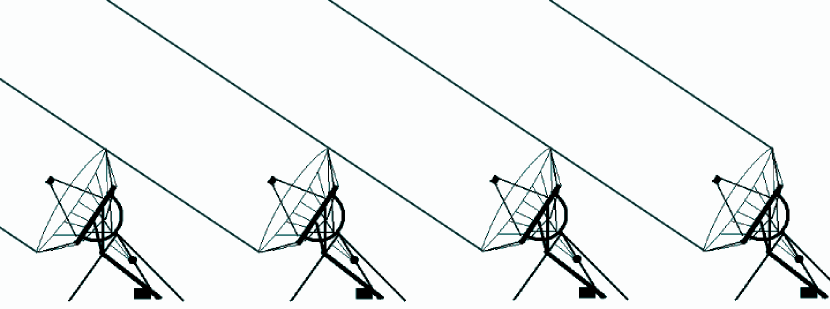
To obtain the highest possible brightness sensitivity, the WSRT has been used to simulate a large filled aperture. 12 of the 14 WSRT 25 m telescopes are positioned at regular intervals of 144 m. When observing at very low declinations and extreme hour angles, a filled aperture can be formed (as can be seen in Fig. 1), which is 300 25 m in projection. In this peculiar observing mode the excellent spectral baseline and PSF properties of the interferometer are still obtained while achieving excellent brightness sensitivity. A deep fully-sampled survey of the galaxy filament joining the Local Group to the Virgo Cluster has been undertaken, extending from 8 to 17 hours in RA and from -1 to +10° in Dec. and covering 40 MHz of bandwidth with 8 km s-1 resolution. Mosaic-mode drift-scan observations are undertaken twice for each of 22,000 positions, once at positive hour angle and once at negative hour angle. The expected survey RMS sensitivity is cm-2 over 20 km s-1 in the synthesis data.
3.1 Primary Beam
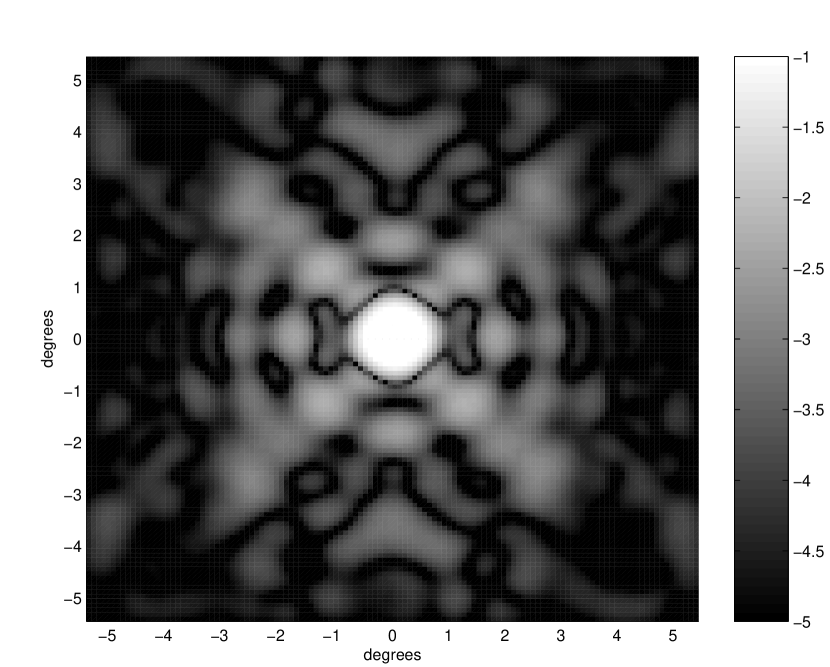
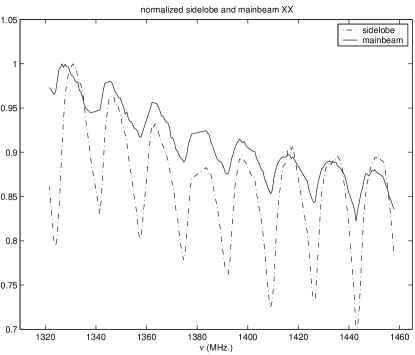
To obtain high dynamic range and image fidelity in a mosaiced field, the shape of the primary beam must be known to high precision. The approximation for the beam shape used in the past has strong limitations, since it assumes the beam to be axisymmetric and is truncated at a level of a few percent, which is above the level of the first sidelobes. We modeled the WSRT primary beam in great detail. Three series of holographic measurements were undertaken to fully sample angular scales between a few arcminutes and several degrees. An empirical model-cube was constructed, containing the primary beam pattern between 1322 and 1457 MHz, with a 1 MHz frequency resolution. In Fig. 2 the model is plotted on a logarithmic scale, averaged between 1424 and 1440 MHz. In Fig. 3 (left panel) the integrated main beam and side lobes are plotted on a normalized scale against frequency. There is a very significant periodic modulation of the beam size of in addition to the expected linear scaling with frequency. This modulation has a period of 17 MHz. When doing the joint-deconvolution of the mosaic observations, an interpolated PSF will be calculated, corresponding to the frequency of the data.
Compared to the previously employed cos6 function, the new model has a systematically broader main beam (at all phases of the oscillations), a “diamond”-shaped departure from circular symmetry as well as inclusion of the first few near-in sidelobes (and their strong variation with frequency). When correcting for the primary beam attenuation, this can have a significant influence on the calculated source fluxes, especially far from the beam center. To investigate the difference between the new model and the old beam description we have compared the implied flux densities of off-axis continuum sources with those obtained from the NVSS survey.
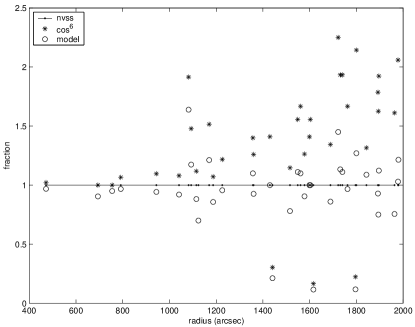
The NVSS (NRAO VLA Sky Survey: Condon et al. (1998)) is a large area radio survey at 1.4 GHz. The images are on-line and can be downloaded. We have employed the WSRT SINGS continuum survey (Braun et al., 2006) which contains single pointing observations of more than 30 fields at the same frequency which means that they can be easily compared. We have produced an inital sample of 36 compact sources for which fluxes have been determined in both the NVSS images as well as the WSRT single pointing observations. The WSRT observations have been corrected for primary beam attenuation with the old cos6 approximation and with the new model. The sources are located at different distances from the pointing center, to determine the reconstructed flux accuracy at different radii.
The results are plotted in Fig. 3 (right panel), where the obtained fluxes are plotted against the radius from the center of the beam. All fluxes are normalized to the fluxes of the NVSS observations which are used as a reference. At small radii, the old approximation (stars) as well as the new model (open circles) are very comparable with the NVSS-fluxes (straight line). When going to larger radii, there are more differences. The main beam of the cos6 approximation is clearly too small, which means that the correction for attenuation will be larger and flux discrepancies will be larger when going out from the center. Indeed, at large radii the old approximation gives fluxes which are significantly too high, while the new model agrees with the reference values. Much larger samples of comparison sources will be required to document the accuracy of the new correction in detail.
4 Results
All observations for our WSRT Virgo Filament Survey (WVFS) have now
been completed. We have begun analysis of the database by first
reducing the auto-correlations which were obtained simultaneously with the
cross-correlation mosaic. The first data cubes and moment images are
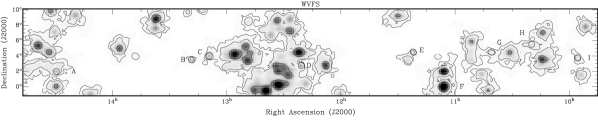
now available for this total power data. Figure 4 shows the
integrated column density map of the observed region. In addition to
the many hundreds of known galaxies which were detected in this region
there are a total of nine discrete sources found, which have not been detected before. All sources were selected to be above a level of . The radial velocities are corrected for Virgo infall and the distances are calculated, using km s-1 Mpc-1. Global properties for the nine objects are given in table 1.
Between the galaxies, diffuse filaments are apparent with column
densities going down to cm-2. While this
is exactly the type of signature we were hoping to detect, further
analysis will be required to rule out an instrumental origin for these
features.
| RA | DEC | Flux | max(NHI) | Vrad | Distance | Mass | |
|---|---|---|---|---|---|---|---|
| (Jy-km/s) | (cm-2) | km/s | (Mpc) | ||||
| A | 14:29:19 | 02:00:00 | 26 | 1.8 | 1604 | 22.6 | 3 |
| B | 13:18:08 | 03:30:00 | 4 | 5 | 791 | 11.1 | 1 |
| C | 13:09:06 | 04:00:00 | 18 | 2 | 938 | 13.2 | 7 |
| D | 12:20:59 | 02:45:00 | 22 | 3 | 1350 | 19.0 | 2 |
| E | 11:21:49 | 04:30:00 | 5 | 5 | 1389 | 19.6 | 4 |
| F | 11:05:46 | 02:00:00 | 131 | 1.4 | 785 | 11.0 | 4 |
| G | 10:40:42 | 04:30:00 | 3 | 5 | 596 | 8.4 | 6 |
| H | 10:19:38 | 05:30:00 | 6 | 9 | 1167 | 16.4 | 4 |
| I | 09:55:35 | 03:45:00 | 8 | 9 | 1344 | 18.9 | 7 |
5 Discussion
The Warm Hot Intergalactic medium is expected to contribute about
30-50 to the total baryon budget. Observing the WHIM is very
difficult and extremely sensitive methods are needed. We are observing
the WHIM in neutral hydrogen emission since the expected column densities,
between log(NHI) 14-18, are just accessible to current instrumentation at the high end. The first results look promising, since
we reach a sensitivity of
cm-2 over 20 km s-1 in the auto-correlation data of our survey.
Nine discrete sources have been tentatively detected which were previously unknown, as well as an indication for diffuse filaments that may be the HI counterparts of the ”Cosmic Web”.
Once the distribution of the WHIM is known, absorption lines
toward strong background sources will be sought. These may provide
both the metalicity and the neutral fraction. With the neutral
fraction in hand, the total mass of the WHIM can be estimated, allowing us to test the conjecture that the ”Missing Baryons” have finally been found.
References
- Bennett et al. (2003) Bennett, C. L., Halpern, M., Hinshaw, G., et al. 2003, ApJs, 148, 1
- Braun et al. (2006) Braun, R., Oosterloo, T. A., Morganti, R., Klein, U., & Beck, R. 2006, AA, in-prep
- Braun & Thilker (2004) Braun, R. & Thilker, D. A. 2004, AA, 417, 421
- Braun & Thilker (2005) Braun, R. & Thilker, D. A. 2005, in ASP Conf. Ser. 331: Extra-Planar Gas, 121–
- Cen & Ostriker (1999) Cen, R. & Ostriker, J. P. 1999, ApJ, 514, 1
- Condon et al. (1998) Condon, J. J., Cotton, W. D., Greisen, E. W., et al. 1998, AJ, 115, 1693
- Davé et al. (2001) Davé, R., Cen, R., Ostriker, J. P., et al. 2001, ApJ, 552, 473
- Davé et al. (1999) Davé, R., Hernquist, L., Katz, N., & Weinberg, D. H. 1999, ApJ, 511, 521
- Dove & Shull (1994) Dove, J. B. & Shull, J. M. 1994, ApJ, 423, 196
- Fang et al. (2002) Fang, T., Bryan, G. L., & Canizares, C. R. 2002, ApJ, 564, 604
- Fukugita et al. (1998) Fukugita, M., Hogan, C. J., & Peebles, P. J. E. 1998, ApJ, 503, 518
- Nicastro et al. (2005) Nicastro, F., Elvis, M., Fiore, F., & Mathur, S. 2005, Advances in Space Research, 36, 721
- Penton et al. (2004) Penton, S. V., Stocke, J. T., & Shull, J. M. 2004, ApJs, 152, 29
- Rauch (1998) Rauch, M. 1998, ARAA, 36, 267
- Savage et al. (2005) Savage, B. D., Lehner, N., Wakker, B. P., Sembach, K. R., & Tripp, T. M. 2005, ApJ, 626, 776
- Savage et al. (2002) Savage, B. D., Sembach, K. R., Tripp, T. M., & Richter, P. 2002, ApJ, 564, 631
- Scharf et al. (2000) Scharf, C., Donahue, M., Voit, G. M., Rosati, P., & Postman, M. 2000, ApJl, 528, L73
- Spergel et al. (2003) Spergel, D. N., Verde, L., Peiris, H. V., et al. 2003, ApJs, 148, 175
- Tittley & Henriksen (2001) Tittley, E. R. & Henriksen, M. 2001, ApJ, 563, 673
- Tripp et al. (2004) Tripp, T. M., Bowen, D. V., Sembach, K. R., et al. 2004, astro-ph, 0411151
- Tripp et al. (2000) Tripp, T. M., Savage, B. D., & Jenkins, E. B. 2000, ApJl, 534, L1
- Wang et al. (1997) Wang, Q. D., Connolly, A., & Brunner, R. 1997, ApJl, 487, L13
- Weinberg et al. (1997) Weinberg, D. H., Miralda-Escude, J., Hernquist, L., & Katz, N. 1997, ApJ, 490, 564
- Yoshikawa et al. (2003) Yoshikawa, K., Yamasaki, N. Y., Suto, Y., et al. 2003, PASJ, 55, 879