Statistical methods applied to composition studies of ultrahigh energy cosmic rays
Abstract
The mass composition of high energy cosmic rays above eV is a crucial issue to solve some open questions in astrophysics such as the acceleration and propagation mechanisms. Unfortunately, the standard procedures to identify the primary particle of a cosmic ray shower have low efficiency mainly due to large fluctuations and limited experimental observables. We present a statistical method for composition studies based on several measurable features of the longitudinal development of the CR shower such as , , asymmetry, skewness and kurtosis. Principal component analysis (PCA) was used to evaluate the relevance of each parameter in the representation of the overall shower features and a linear discriminant analysis (LDA) was used to combine the different parameters to maximize the discrimination between different particle showers. The new parameter from LDA provides a separation between primary gammas, proton and iron nuclei better than the procedures based on only. The method proposed here was successfully tested in the energy range from to eV even when limitations of shower track length were included in order to simulate the field of view of fluorescence telescopes.
keywords:
cosmic rays , primary composition , longitudinal developmentPACS:
96.40-z,96.40.Pq,96.40.De1 Introduction
The most important questions about cosmic rays with energy above eV can only be solved if the mass composition spectra is known. The complete understanding of the energy spectra and its features is only possible with the knowledge of the mass composition since it stores information about the source and the acceleration mechanisms. The evolution of the energy spectrum and the explanation of its possible features (2nd knee, ankle and the GZK cutoff) are intrinsically linked to the primary composition because the source power (in a Fermi mechanism) is directly proportional to the particle charge. Furthermore, the attenuation length of the particles due to the various energy loss mechanisms depends on the particle type and thus different mass composition can modulate the energy spectrum up to the highest energies.
Present measurements with different techniques are not conclusive about the mass spectrum and its evolution with energy. Currently, composition studies have been done using fluorescence telescopes and ground arrays. Fluorescence telescopes are sensitive to the primary composition by measuring the depth in which the shower has the maximum number of particles () while ground based experiments usually extract the composition information from the muon density or the temporal structure of the signal. However, due to the large fluctuations in the shower development, the limited number of measurable parameters and the uncertainties in the hadronic interaction models [2, 3] the primary particle identification is very difficult and not possible on a event by event basis.
Several experiments have published mass composition studies. The Haverah Park experiment has reported an iron fraction around 66% in the energy range 0.2-1 EeV [4] and similar results have been measured by the Akeno [5] experiment. At energies above eV, the AGASA experiment [6] measured an upper limit of the iron fraction of 35% in the range eV and 76% in the range eV. On the other hand, the HiRes Collaboration [7], measured an unchanging light composition above eV and a change from heavy to light composition in the range eV. Thus, the composition measurement for energies above eV are still inconclusive [8].
In this paper, we present the application of a statistical method to differentiate the primary particle based on several features of the longitudinal development of the CR shower rather than using only the depth of shower maximum (). The longitudinal development of the CR shower can be well measured by fluorescence telescopes in operation by the HiRes and Auger Collaborations [9]. Our results are based on Monte Carlo simulations of the showers.
This article is organized as follows: section 2 describes the longitudinal profile and the parameter that is commonly used for composition studies. Section 3 describes the additional shower parameters proposed in this paper and the principal component analysis (PCA) used to evaluate them. Section 4 describes the linear discriminant analysis (LDA) and the results obtained using the newly defined parameters. Section 5 shows the results of the new method when the field of view of fluorescence telescopes is taken into account. A discussion of our results and future perspectives are summarized in the final section.
2 Shower longitudinal profile and the parameter
We have simulated air showers using the CORSIKA version 6.203 [10] Monte Carlo program with the QGSJET 01 [11] hadronic interaction model. Particles in the shower were followed down to the energy of 0.05 GeV (muon and hadrons) and 50 keV (photons and electrons). The longitudinal development of the showers was sampled in vertical steps of 5 g/cm2. The thinning algorithm [12, 13] was used with a thinning factor of and a maximum weight of . Primary photons have been simulated with the pre-shower [14] effect and . Two thousand shower were simulated for each type of primary particle and for each energy ranging from eV to eV.
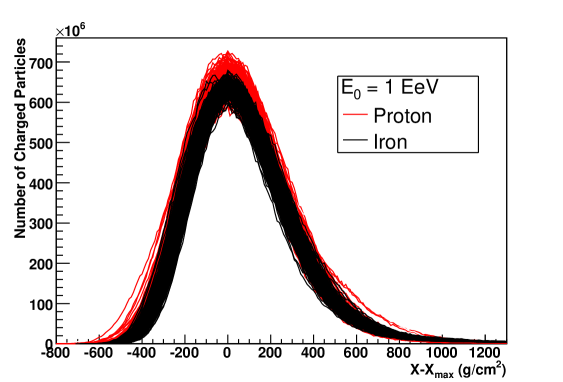
Figure 1 shows the simulated longitudinal profile of iron and proton showers. Shower profiles shown in this figure were shifted by its for better comparison of the profile shapes.
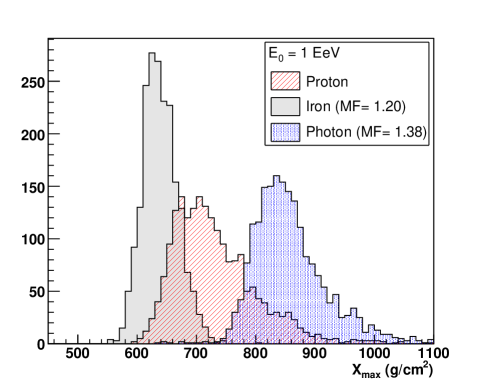
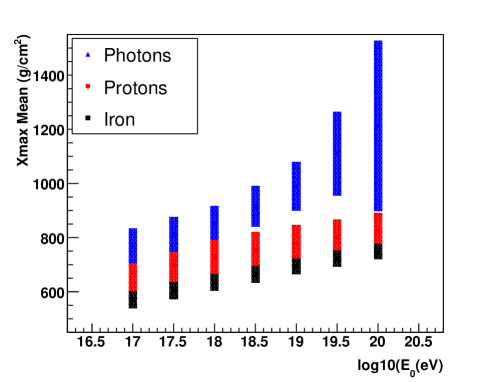
Composition studies done by fluorescence telescopes are usually based on this parameter. Figure 2 shows the distribution for primary protons, iron nuclei and photons for showers simulated with primary energy of eV. This figure illustrates that the parameter can be a good discriminator for gamma showers but its capability to differentiate protons from iron nuclei primary particles is quite limited due to the large overlap between the two distributions. In the energy range between eV to eV the discrimination capability of varies as shown in figure 3. The elongation rate shows how the average varies with energy and is normally used to report the evolution of the composition with energy. Figure 3 also shows the RMS of the distribution as the error bars and the clear overlap of the parameter for different primary particles indicates that the discrimination between the different particles becomes more difficult for higher energies.
To quantify the separation capability hence the discrimination between the different primary particle distributions, we are going to use the merit factor (MF) statistical parameter. The merit factor between two distributions (A and B) is defined as:
| (1) |
where and are the distributions averages, and and the respective standard deviations.
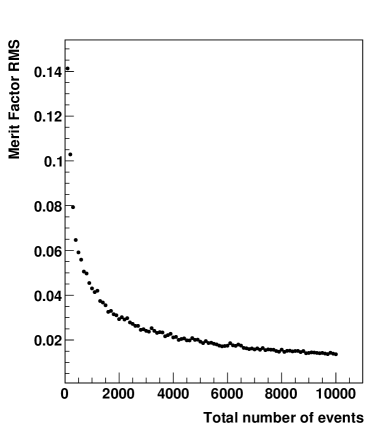
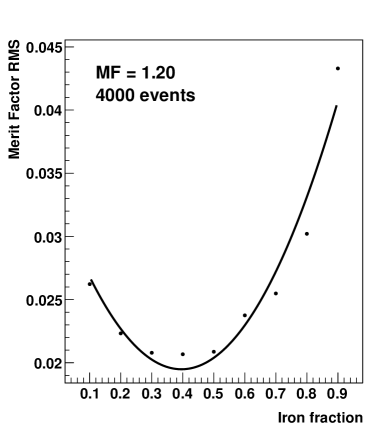
Figure 4a shows the merit factor fluctuation as a function of the number of events. We have used the distribution of primary iron nuclei and protons as shown in figure 2 for this calculation. Random values were drawn following those distribution 1000 times and for each time a merit factor value was calculated. Following this procedure the fluctuation of the merit factor as a function of the number of showers could be calculated. Figure 4a shows that the results presented here using the merit factor parameter have uncertainties smaller than 3% since we are always comparing two distributions with 2000 events each, summing 4000 total events. We have also studied how the uncertainty varies with the fraction of iron nuclei in the total number of events. Figure 4b shows that for any mixture of iron and proton the merit factor uncertainty is smaller than 3%.
The merit factor achieved for the separation between proton and iron and proton and photon using the distributions is 1.20 and 1.38, respectively. These values are going to be compared to the merit factor obtained from the new analysis proposed here.
3 New parameters and the principal component analysis
Comparing the shapes of the longitudinal profile shown in figure 1, it is possible to notice that there are differences between the two different primary particles. Thus, we have looked for mathematical parameters that express these differences to improve the discrimination capacity between the particles.
Several new parameters were tested and only some have shown good separation capabilities and the most powerful ones seem to be those related to the asymmetry of the longitudinal profiles. Below we list some tested parameters and show its discrimination capability by quoting the merit factor (MF) between proton and iron distributions.
:the atmospheric depth (g/cm2) in which the shower has the maximum number of particles. It is the most used composition parameter and is calculated in any analysis procedure of fluorescence telescopes data. A indirect measurement of the can also be done by water Čerenkov detectors via the rise time method [15]. .
: the number of particles in the shower at a . This is also a standard parameter calculated in any fluorescence telescope analysis and it is directly proportional to the shower energy. If the error in the energy reconstruction is large the inclusion of this parameter in the composition study would lead to a dependence with energy that is hard to disentangle. However, the fluorescence telescopes reconstruct the energy with an error of about 15% what we believe is a safe margin since variations in the energy of an EAS of this order do not affect the hypothesis about the chemical composition of the primary.
Asymmetry and Sigma: in order to measure the asymmetry of the distribution we have fit an asymmetric function to the longitudinal profile defined as:
if ( )
if ( )
and are fixed in the fit. Asymmetry and sigma are the only two variables allowed to vary in the fit procedure. The asymmetry variable is a direct measure of the difference between the parts of the shower below and above . Sigma gives a measure of the width of the shower. Asymmetry: and Sigma: .
Skewness: is the third momentum of the distribution and is also a measurement of the asymmetry of the longitudinal distribution.
Kurtosis: is the fourth momentum of the distribution and is a combined measurement of the size of the peak and the tails.
Other parameters were tested and rejected. For instance, we have fit a linear function in the range between and a second linear function in the range between . The slope of these functions were taken as a measurement of the increase and decrease rate of the number of particles in the shower. However, no combination of the slopes has shown any capability to separate proton from iron showers.
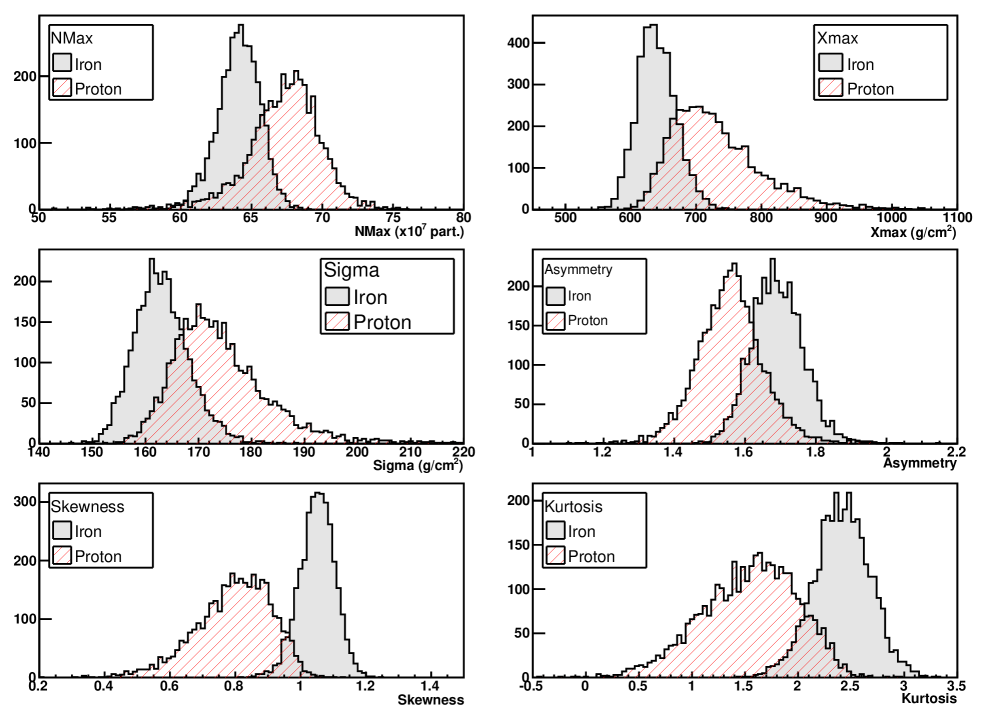
The distribution of the six parameters used in the composition studies proposed here are shown in figure 5 for proton and iron nuclei primaries.
Principal component analysis (PCA) was used to study the relevance of each parameter to the determination of the shower overall features. PCA is a linear transformation that rewrites a dataset into a new set of variables that are uncorrelated. These new variables, called principal components, are ordered by the amount of variance [16].
PCA has wide applications in astrophysics in analysis of spectra and galaxy surveys [17, 18] and in analysis of the Gamma Ray Bursts’ spectra [19], parameter reduction in Dark Energy studies [20], finding systematic differences between stellar populations [21], among others. In cosmic ray research, it has been used as a method to distinguish photon generated showers from hadronic showers applied to the secondary particle distributions at ground level produced by photons and protons showers [22]. In another work, PCA was used in the data analysis of Čerenkov Gamma Ray Telescopes [23].
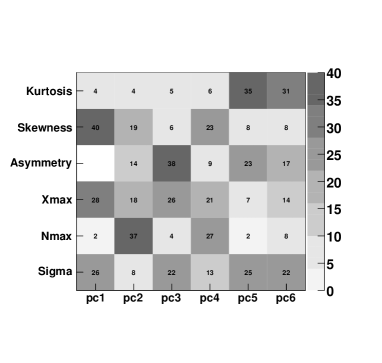
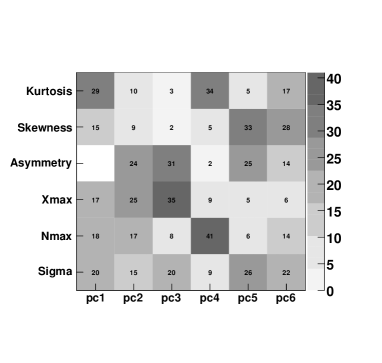
We have applied PCA for proton and iron showers and defined the eigenvectors which characterizes their longitudinal profile. The first principal component is the eigenvector with the largest variance, related with the largest eigenvalue, the second principal component is associated with the second largest eigenvalue and so on. Figure 6a shows the contribution of each parameter to the principal component parameters when applied to the proton initiated showers. Figure 6b corresponds to the equivalent plot for the iron initiated showers. The weights shown in the figures were normalized to 100%. It is interesting to note that the relative weight of the new parameters such as the skewness and the kurtosis is considerably different between the two data sets. Also, by comparing the variance of the principal components distributions from the two data sets, we have noted that some of the principal components show different profiles, indicating that indeed there are clear differences between the relative weights of the featured parameters to the overall shower determination. To take advantage of these differences for discriminating the two different data sets, we have applied a statistical method known as the linear discrimination analysis.
4 Linear discriminant analysis
Linear discriminant analysis (LDA) was used to search for the best combination of parameters to separate proton from iron nuclei showers and photon from hadronic primaries. LDA is a statistical discrimination method used to find a function of linear combinations of variables that maximizes the separation between two or more classes of objects or events. It accomplishes that by maximizing the ratio of the variability between different groups, determined through the pooled (overall) covariance matrix, to the variability within each group (covariance matrix of each class)[24].
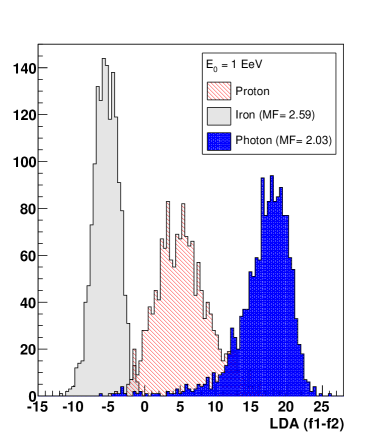
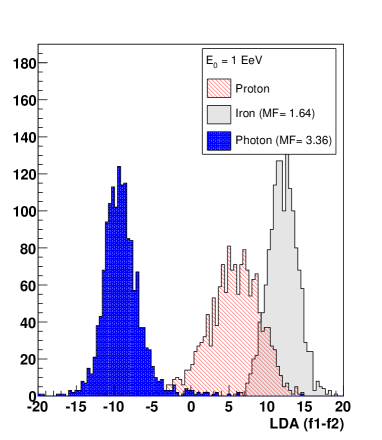
In our analysis all six parameters presented in figure 5 were included in the LDA calculation. Training datasets for proton and iron showers were used to determine a set of discriminant coefficient vectors. These discriminant coefficient vectors are then used to calculate the LDA variables and for each new data point, that was not in the original training dataset. The difference between the two LDA parameters () is expected to yield the best separation between the two populations. Applying this method to the proton and iron populations, we have obtained a merit factor of 2.59. Including showers originated by photons in the same analysis keeping the discriminant coefficients that were calculated for proton and iron a separation merit factor of 2.03 was achieved between photons and protons 7a. To improve the photon-hadron discrimination, we repeated the procedure but using as training datasets one group of hadrons (50%proton and 50% iron showers) and another group of photons induced showers in which case, a merit factor of 3.36 was achieved. It is worthwhile to emphasize that alone has a merit factor equal to 1.20 for proton and iron showers and a merit factor of 1.38 between proton and photon distributions.
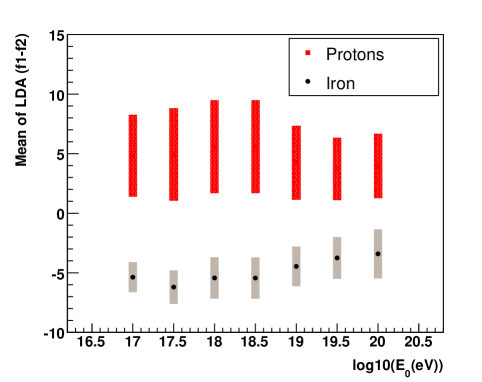
The capability of the LDA parameters was tested as a function of energy, where we have recalculated the dependent parameters coefficient for each energy. Figure 8 shows the evolution of the LDA diagonal projection with energy calculated for proton and iron nuclei. This figure can be compared to the elongation rate (see figure 3). Figure 3 shows a overlap of the distribution along the entire energy range while figure 8 shows a clear separation of the LDA parameter along the same energy range.
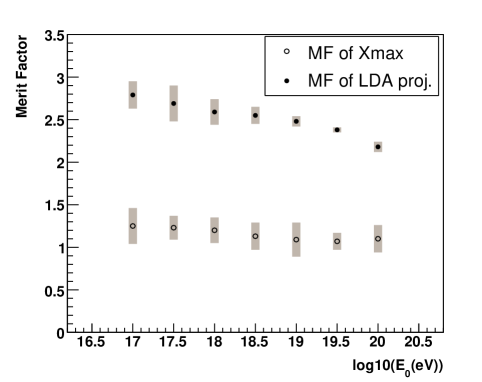
A comparison of both methods as a function of energy can be seen in figure 9 where we show the evolution of the merit factor for the LDA diagonal projection and for with energy.
5 Simulation of the telescopes’ field of view
In order to test the effectiveness of the new analysis in a real situation with showers detected by fluorescence telescope we have reduced the track length of the showers used in our analysis and recalculated the discrimination capability. We have also repeated the same LDA with a reduced part of the longitudinal shower profile. Showers were limited to a maximum length ranging from 400 g/cm2 to 2000 g/cm2 around its .
The method presented here is based on the properties of the longitudinal profile and consequently the limited field of view of fluorescence telescopes is the main detection feature that affects the quality of the method. Detector fluctuations and reconstruction uncertainties are expected to be a minor contribution to degrade the method capabilities. However, it is clear that the exact discrimination values of the new parameters must be calculated for each specific telescope configuration and analysis procedure.
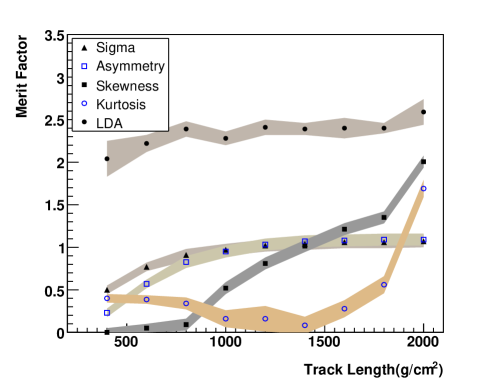
Figure 10 shows the merit factor of each parameter as a function of the total track length of the shower considered in our analysis. Calculations were done for showers with primary energy equals to eV but similar results were seen for all energies. As expected, kurtosis and skewness are efficient only when a large fraction of the shower is detected due to their dependence to the tails of the longitudinal distributions. Asymmetry and sigma remain good parameters even when the shower has 1000 g/cm2, but it also degrades very fast for lower track length. Also shown are the merit factor calculated using LDA, and which remained above 2 for all the entire range considered, showing that it yields better discrimination than considering each parameter independently.
6 Conclusion
We studied different features of the cosmic ray shower longitudinal profile aiming to determine a better set of parameters that can improve primary particle identification. The relevance of each parameter to the overall profile was studied using a principal component analysis which showed that the relative weight of these additional parameters proposed in this analysis changed depending on the shower type.
The discrimination capability of the different parameters was compared using a merit factor that measures how separate are the parameter distributions of the two different data sets. When evaluating the complete shower profile, we have determined that some of the proposed parameters such as the distribution skewness and kurtosis show better discrimination capability than that is commonly used for composition analysis. However, these parameters loose very quickly its discrimination power when the track length of the shower is reduced. To combine the separation capability of all the parameters the statistical method linear discrimination analysis was applied resulting in a new parameter with much better separation efficiency. With LDA, we were able to get separation merit factors above 2 sigma, between proton and iron initiated showers. For the separation between photon and hadron (proton+iron) showers, LDA yields a separation merit factor of 3.3 sigma for shower energy of eV. Comparing to the composition analysis using the standard , the LDA yields a better separation efficiency, even when considering incomplete shower profiles. It is clear that to have a better estimate of the applicability of this method to real data, a more complete simulation analysis considering a complete simulation of the detector response and atmospheric effects have to be considered.
In conclusion, we have shown that it is possible to improve composition studies of cosmic ray showers by considering a more complete set of variables that describe better the shower longitudinal profile. Further analysis with more complex and sophisticated statistical separation methods such as hierarchical clustering methods and neural network analysis can also further enhance this analysis.
7 Acknowledgment
This work was supported by the Brazilian science foundations FAPESP and CNPq to which we are grateful. We would also like to thank Prof. Dr. Carlos O. Escobar for the discussions and comments that were essential to this work.
References
- [1] M. Risse et al., in: Proc. 29th ICRC, Pune (2005)/ astro-ph/0701065.
- [2] J. Knapp et al., Astrop. Phys., 19 (2003) 77.
- [3] A. Haungs et al., Nuclear Physics B (Proc. Suppl.), 151 (2006) 167.
- [4] M. Ave et al., Astrop. Phys., 19 (2003) 61.
- [5] M. Nagano et al., J. Phys. G : Nucl. Phys., 12 (1986) 69.
- [6] K. Shinozaki and M. Teshima, Nuclear Physics B (Proc. Suppl.) 136 (2004) 18.
- [7] R. U. Abbasi, ApJ, 622 (2005) 910.
- [8] A. A. Watson, Nuclear Physics B,(Proc. Suppl.), 151 (2006) 83.
- [9] J. Abraham et al., Nuclear Instruments and Methods in Physics Research A, 523 (2004) 50.
- [10] D. Heck et al., Report FZKA 6019, Forschungszentrum Karlsruhe, 1998.
- [11] N. N. Kalmykov et al., Yad. Fiz., 56 (1993) 105. N.N. Kalmykov, S.S. Ostapchenko, Phys. Atom. Nucl., 56 (1993) 346.
- [12] M. Hillas, Nuclear Physics B, (Proc. Suppl.), 52B (1997) 29.
- [13] D.Heck and J.Knapp, Report FZKA 6097, Forschungszentrum Karlsruhe, 1998.
- [14] P. Homola et al., Nucl. Phys. B, (Proc. Suppl.),151 (2006) 106.
- [15] A. A. Watson, Nuclear Physics B,(Proc. Suppl.), 151 (2006) 83.
- [16] R. A. Johnson and D. W. Wichern, Applied Multivariate Statistical Analysis, 5th edition Prentice Hall, New Jersey.
- [17] J. Berian. et al., Mon. Not. R. Astron. Soc., 370 (2006) 933.
- [18] K. Glazebrook, A.Offer and K.Deeley, ApJ, 492 (1998) 98.
- [19] Z. Bagolly et al., Il NuovoCimento, 28 (2005) 295.
- [20] E. Linder and D. Huterer, Physical Review D, 72 (2005) 043509.
- [21] I. Ferreras et al.,Mon. Not. R. Astron. Soc, 370 (2006) 828 .
- [22] E. Faleiro et al., ApJ, 155, (2004) 167 .
- [23] J. L. Contreras et al., Astrop. Phys., 26 (2006) 50.
- [24] Y. Mallet, D. Coomans and O. de Vel, Chemometrics and Intelligent laboratory Systems, 35 (1996) 157.