Three-Dimensional Simulations of the Deflagration Phase of the Gravitationally Confined Detonation Model of Type Ia Supernovae
Abstract
We report the results of a series of three-dimensional (3-D) simulations of the deflagration phase of the gravitationally confined detonation mechanism for Type Ia supernovae. In this mechanism, ignition occurs at one or several off-center points, resulting in a burning bubble of hot ash that rises rapidly, breaks through the surface of the star, and collides at a point opposite breakout on the stellar surface. We find that detonation conditions are robustly reached in our 3-D simulations for a range of initial conditions and resolutions. Detonation conditions are achieved as the result of an inwardly-directed jet that is produced by the compression of unburnt surface material when the surface flow collides with itself. A high-velocity outwardly-directed jet is also produced. The initial conditions explored in this paper lead to conditions at detonation that can be expected to produce large amounts of 56Ni and small amounts of intermediate mass elements. These particular simulations are therefore relevant only to high luminosity Type Ia supernovae. Recent observations of Type Ia supernovae imply a compositional structure that is qualitatively consistent with that expected from these simulations.
1 Introduction
Type Ia supernovae have received increased interest because of their importance as “standard candles” for cosmology. Observations using Type Ia supernovae as standard candles have revealed that the expansion rate of the universe is accelerating and have led to the discovery of “dark energy” (Riess et al., 1998; Perlmutter et al., 1998). But the way in which Type Ia supernovae explode is not completely understood. The current leading paradigms for the explosion mechanism are (1) pure deflagration (Reinecke et al., 2002b; Gamezo et al., 2003; Röpke & Hillebrandt, 2005), (2) deflagration to detonation transition (DDT) (Khokhlov, 1991; Gamezo, Khokhlov & Oran, 2004; Gamezo et al., 2005), (3) pulsational detonation (PD) (Khokhlov, 1991; Bravo et al., 2006), and (4) gravitationally confined detonation (GCD) (Plewa, Calder, & Lamb, 2004; Livne et al., 2005; Plewa, 2007; Townsley et al., 2007). There is increasing evidence that a detonation is needed (Höflich et al., 2002; Badenes et al., 2006; Wang et al., 2006, 2007; Gerardy et al., 2007), as is posited in the last three models.
A fundamental question has been how the transition to a detonation occurs in a white dwarf star [see, e.g., Niemeyer (1999)]. While the DDT, PD, and GCD paradigms incorporate a detonation, all existing DDT simulations invoke the transition to a detonation in an ad-hoc fashion and the PD mechanism remains largely unexplored by detailed simulations. In contrast, extensive two-dimensional (2-D) cylindrical simulations have shown that detonation conditions are robustly reached in the GCD model for a variety of initial conditions (Plewa, Calder, & Lamb, 2004; Plewa, 2007; Röpke, Woosley, & Hillebrandt, 2007; Townsley et al., 2007). Thus, to date, the GCD mechanism is the only proposed mechanism for which a detonation has been demonstrated to arise naturally.
However, the achievement of detonation conditions has not been demonstrated in 3-D [see, e.g., Röpke, Woosley, & Hillebrandt (2007)]. This is a concern since the behavior of turbulence is different in 3-D than in 2-D, and the cylindrical symmetry of the 2-D simulations might enhance the focusing of the surface flow that triggers the detonation in the GCD model. Hence, a major question that we address in this paper is whether it is possible to achieve detonation conditions in a fully 3-D simulation of the GCD model. In addition, the large amount of nuclear burning that occurs in the Röpke, Woosley, & Hillebrandt (2007) simulations appears to play a role in the failure of these simulations to achieve detonation conditions in 3-D. In this paper, we report the results of seven 3-D simulations of the GCD model for several different sets of initial conditions and two resolutions. We find that the conditions for detonation are robustly achieved for these initial conditions. Thus the simulations reported in this paper address the first point above and provide a counter example to the second.
The organization of the paper is as follows. We describe the simulation setup in §2 and the results of the simulations in §3. We discuss the properties of Type Ia supernovae expected in the GCD model and compare the results of our simulations with earlier work in §4. Finally, we state our conclusions in §5.
2 Simulation Setup
We perform our 3-D simulations of the deflagration phase of the GCD model using FLASH 3.0, an adaptive-mesh hydrodynamics code (Fryxell et al., 2000; Calder et al., 2002). The general simulation setup is identical to that in the 2-D simulations of the GCD model described in Townsley et al. (2007). In particular, the initial model is a 1.38 WD with a uniform composition of equal parts by mass of 12C and 16O. It has a central density of g cm-3, a uniform temperature of K, and a radius of approximately 2,000 km.
The physical thickness of the carbon burning stage of the nuclear flame front in the deflagration phase of Type Ia supernovae is to cm for the densities of interest, and is therefore unresolvable in any whole-star simulation. Consequently, a method must be used to determine the location and speed of the flame front. Two fairly different methods of flame-front tracking have been used in recent studies of WD deflagration. One is the level set technique, in which the location of the flame front is calculated based upon the value of a smooth field defined on the grid and propagated with an advection equation acting in addition to the hydrodynamics (Reinecke et al., 1999; Röpke, Niemeyer, & Hillebrandt, 2006a; Röpke & Hillebrandt, 2005). This method has been used to study the effect of turbulence on the nuclear burning rate (Schmidt, Niemeyer, & Hillebrandt, 2006a) and in many simulations of WD deflagration [see, e.g., Reinecke et al. (1999); Röpke & Hillebrandt (2005); Schmidt, Niemeyer, & Hillebrandt (2006b)]. The other method artificially broadens the flame front using a reaction progress variable and propagates it using an advection-diffusion-reaction (ADR) equation (Khokhlov, 1995; Vladimirova, Weirs, & Ryzhik, 2006). This ADR flame model has been used to study the effect of the Rayleigh-Taylor (R-T) instability on a propagating flame front (Khokhlov, 1995; Zhang et al., 2007) and in many previous previous simulations of WD deflagration (Gamezo et al., 2003; Calder et al., 2004; Plewa, Calder, & Lamb, 2004; Plewa, 2007; Townsley et al., 2007).
In this paper, we follow the nuclear flame using a new version (Asida et al., 2008) of ADR flame model. The new prescription uses the Kolmogorov-Petrovski-Piskunov (KPP) form of the reaction term in which this term is slightly truncated, as opposed to the top-hat form used previously by ourselves and others [e.g., Khokhlov (1995)]. This new version is numerically quieter, more stable, and exhibits far smaller curvature effects (Asida et al., 2008). The thickness of the flame is grid points; more details and the explicit values of the parameters in the ADR flame model that we use are given in Townsley et al. (2007). We also use a new, acoustically-quiet version (Townsley et al., 2007) of the nuclear energy release method described in Calder et al. (2007) that accounts more accurately for the nuclear energy released in the flame and in the evolution of nuclear statistical equilibrium (NSE) as conditions change within the bubble of hot ash.
We do not include nuclear burning outside the flame in the simulations reported in this paper. This approach is the same as that adopted by Röpke, Woosley, & Hillebrandt (2007). Were we to have included such burning, both the 2-D simulations reported in Townsley et al. (2007) and the 3-D simulations reported in this paper would detonate at the first instant at which detonation conditions are reached, as we will report in later papers (Meakin et al., 2008a; Jordan et al., 2008). Thus including nuclear burning outside the flame would not have allowed us to demonstrate that the simulations reported in this paper robustly reach conservative conditions for detonation; i.e., that they exceed the temperature and the density needed to detonate for a significant period of time.
We treat the effect of R-T–driven turbulence in the same manner as in Townsley et al. (2007); namely, we impose a minimum flame speed , where is the grid size of the simulation, is a geometrical factor, and is a constant that we have calibrated (Townsley et al., 2007, 2008). This is a conservative approach that allows the simulation to treat the effects of R-T driven turbulence on resolved scales while ensuring that turbulence on the scale of the (artificially broadened) flame thickness does not disrupt the flame. We disable this prescription in the truncated cone encompassing the region where the surface flow collides with itself to ensure that no unrealistic heating occurs.
If the nuclear burning rate, as well as the overall dynamics of R-T–driven turbulent nuclear burning, are determined by the behavior at large scales, turbulence at small scales does not increase the burning rate and the moderate resolution possible in current simulations is adequate. That this may be the case is suggested by the results of Zhang et al. (2007), who find that the time-averaged rate of buoyancy-driven nuclear burning did not vary when the resolution was varied by a factor of four. Because we rely on the resolution of our simulations to describe turbulent nuclear burning, and therefore the rate of nuclear burning, we have paid close attention to how the rate varies with resolution. We have found no evidence for more than a modest variation of the nuclear burning rate due to unresolved behavior – as we discuss below. However, the appropriate way to treat turbulent nuclear burning is an open question [cf. Reinecke et al. (2002a); Zingale et al. (2005); Schmidt, Niemeyer, & Hillebrandt (2006a); Zhang et al. (2007)], and further studies are needed in order to answer definitively this question.
The core of the star is thought to be convective and therefore to have velocities on the largest scales of km s-1 (Woosley, Wunsch, & Kuhlen, 2004; Wunsch & Woosley, 2004), which are comparable to the laminar flame speed in this region (Timmes & Woosley, 1992). The temperature fluctuations in the convective region may lead to one, to a few, or to many ignition points. The convective motions are likely to distort the ignition region(s), seeding later Rayleigh-Taylor instability modes. However, the motions are not strong enough to destroy the ignition region(s), once born. In addition, Livne et al. (2005) find that the general outcome of off-center ignitions is not strongly affected by the presence of a convective velocity field. Finally, we would like to understand the behavior of the simpler case of a single, spherical ignition region and zero velocity in the core of the star before considering more complicated cases. For all of these reasons, we adopt a single ignition point at a range of offset distances from the center of the star as the initial conditions in this paper. We will investigate ignition at multiple points and the effects of convective motions in the core of the star in future papers.
We model the ignition region as a spherical bubble of hot ash initially at rest, characterized by an initial radius, , and an initial distance, , from its center to the center of the star along the z-axis. The edge of the burned region forms a smooth transition from fuel to ash that is 4 zones in width [see Townsley et al. (2007) for more details]. The density of the hot ash is chosen to maintain pressure equilibrium with the surrounding material. The surface of the bubble of hot ash corresponds to the isosurface, where is the flame progress variable for 12C 12C burning (Townsley et al., 2007). Thus the radius, , is approximately the radius of the isosurface.
Initially, the spherical bubble of hot ash rises slowly, due to its small size and the small value of the acceleration of gravity near the center of the star. The growth of the bubble is self-similar – i.e., independent of its initial radius – provided that (Vladimirova, 2007; Fisher et al., 2008). Here is the initial radius of the bubble, is the minimum wavelength for the unstable Rayleigh-Taylor growth of flame surface perturbations, is the laminar flame speed, is the Atwood number, and is the acceleration of gravity at . Otherwise, the initial bubble is immediately unstable to the growth of Rayleigh-Taylor modes. This is inconsistent with the assumption of a small, spherical ignition region. Thus, for all of the simulations reported in this paper, except for two we conducted to compare with those of Röpke, Woosley, & Hillebrandt (2007).
The adaptive mesh refinement criteria we use are chosen to capture the relevant physical features of the burning and the flow at reasonable computation expense. The criteria for refinement are the same as those described in Townsley et al. (2007), except that we maximally refine a sphere of radius km at the center of the star and a truncated cone encompassing the region where the flow of hot bubble material over the surface of the star collides with itself. The truncated cone has an opening half angle , and extends from a radius km to a radius km.
3 Results
We performed a suite of seven 3-D simulations of the deflagration phase of the GCD model for initially stationary, spherical flame bubbles, varying the initial bubble radius , the initial bubble offset , and the finest resolution. Table 1 lists the initial conditions and several properties of these simulations. The simulations are denoted by initial bubble radius, offset distance, and finest resolution. Thus 18b42o6r denotes a 3-D simulation in which the initial bubble radius km, the offset distance km, and the finest resolution is 6 km.
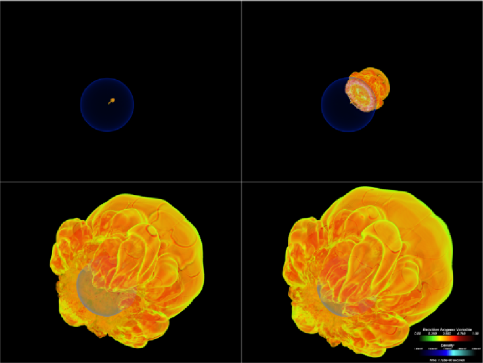
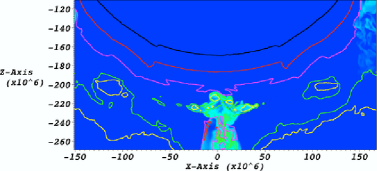
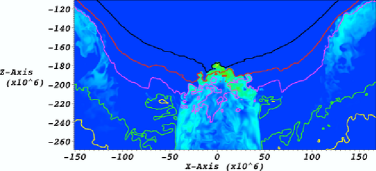
Our 3-D simulations of the GCD model progress similarly to previous 2-D GCD simulations (Plewa, Calder, & Lamb, 2004; Plewa, 2007; Townsley et al., 2007), passing through several distinct stages. Initially, the spherical bubble of hot ash that we adopt as our model of the ignition region grows at a rate dictated by the laminar flame speed. At s of simulation time, the radius of the bubble exceeds , the minimum wavelength for the unstable Rayleigh-Taylor growth of flame surface perturbations (Khokhlov, 1995; Zhang et al., 2007). When this happens, the top surface of the bubble develops a bulge, and the bubble quickly evolves into a mushroom-like shape (Calder et al., 2004; Plewa, Calder, & Lamb, 2004; Vladimirova, 2007; Plewa, 2007; Townsley et al., 2007). Subsequently, the shape of the bubble becomes ever more complex as the critical wavelength becomes smaller (as the bubble rises and at the position of the bubble increases) and additional generations of smaller features appear as a result of the Rayleigh-Taylor instability. During this time, the rate at which the bubble rises increases, and the bubble breaks through the stellar surface at s. The hot ash in the bubble (which was produced at a range of densities and so consists of both iron-peak and intermediate-mass elements) then spreads rapidly over the surface of the star, pushing unburned material in the outermost layer of the star ahead of it.
The mass of the hot ash from the bubble that sweeps over the surface of the star ranges from 0.038-0.010 for offset distances of the initial bubble ranging from 20 km to 100 km. Its composition ranges from roughly 0.009-0.002 of intermediate mass elements and roughly 0.007-0.03 of Fe-peak elements for these offset distances. However, we caution that the present simulations do not seek to accurately treat mixing between the ash flow across the surface of the star and the underlying outermost layers of the white dwarf, which will significantly affect the final composition of these layers.
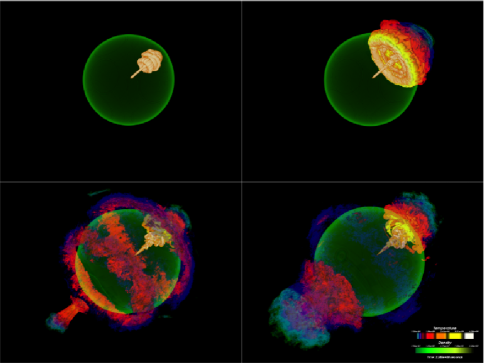
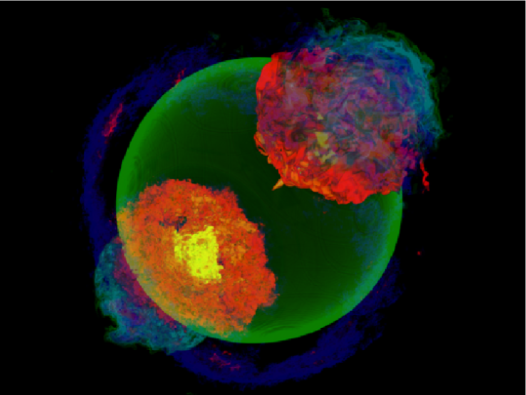
At sec, the flow of hot ash collides with itself at the opposite point on the stellar surface from the place where the bubble broke out, compresses the unburnt surface layers there, and initiates a detonation (Plewa, Calder, & Lamb, 2004; Plewa, 2007; Townsley et al., 2007). Figures 1 and 2 illustrate these different stages in the 18b42o6r simulation. The image in Figure 3 is identical to that in Figure 2(d), except we have rotated the star to show the very hot ( K) region at the head of the inward jet that has reached densities greater than g cm-3, conditions that exceed conservative criteria for initiation of a detonation (Niemeyer & Woosley, 1997; Röpke, Woosley, & Hillebrandt, 2007).
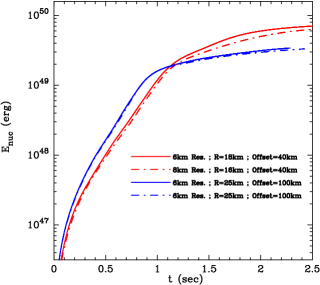
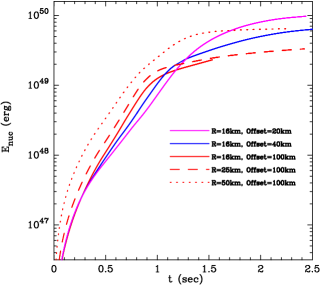
We compare the nuclear energy, , released during the deflagration phase as a function of time for the 18b42o6r and 16b40o8r simulations, and the 25b100o6r and 25b100o8r simulations, in the left panel of Figure 4. In both cases, the curves for the two different resolutions are in close agreement. This result is expected if buoyancy-driven nuclear burning depends mostly on the fluid dynamical behavior at larger scales. As remarked earlier, such a picture is suggested by the results of Zhang et al. (2007), who find that the time-averaged rate of buoyancy-driven nuclear burning did not vary when the resolution was varied by a factor of four. However, this is an open question, as discussed in §2, and further studies are needed in order to answer it.
We compare the nuclear energy released, , as a function of time for the 16b20o8r, 16b40o8r, 16b100o8r, 25b100o8r, and 50b100o8r simulations in the right panel of Figure 4. The first three form a sequence in which both the time at which the curves flatten and the amount of nuclear energy that is released decreases as the offset distance of the ignition region increases. This behavior is similar to that found by Townsley et al. (2007) in their 2-D simulations of the GCD model.
The unburnt surface material in the initial collision region reaches K but densities of only g cm-3, which are insufficient to produce a detonation (Niemeyer & Woosley, 1997). The collision, however, produces inward- and outward-directed jets. The outward jet ejects material at velocities km s-1. The inward jet impacts the stellar surface, stalls, and spreads a little. This sequence of events compresses the hot ( K) material ahead of the jet to densities g cm-3, and in some cases even g cm-3. These conditions exceed conservative conditions for initiation of a detonation (Niemeyer & Woosley, 1997; Röpke, Woosley, & Hillebrandt, 2007). As we will report in a later paper, subsequent 3-D simulations of the GCD model we have carried out that include nuclear burning outside the flame detonate, and inclusion of such burning does not significantly alter the time at which the detonation occurs compared to the first moment at which the simulations reported in the present paper reach conditions for detonation (Jordan et al., 2008).
The 3-D simulations of the GCD model show that, as in our previous 2-D simulations (Townsley et al., 2007), it is the kinetic energy originating from the breakout of the bubble of hot ash, imparted to the unburnt surface layers of the star by the inwardly-moving jet generated by collision of the surface flows that causes the unburnt material to achieve the conditions for detonation. This is illustrated in Figure 5, which shows the temperature and density in the collision region in the 18b42o6r simulation just before and just after detonation conditions are reached, and in Figure 3, which is identical to the image in Figure 2(d), except that the star is rotated to show the very hot ( K) region at the head of the inward jet that has reached densities greater than g cm-3.
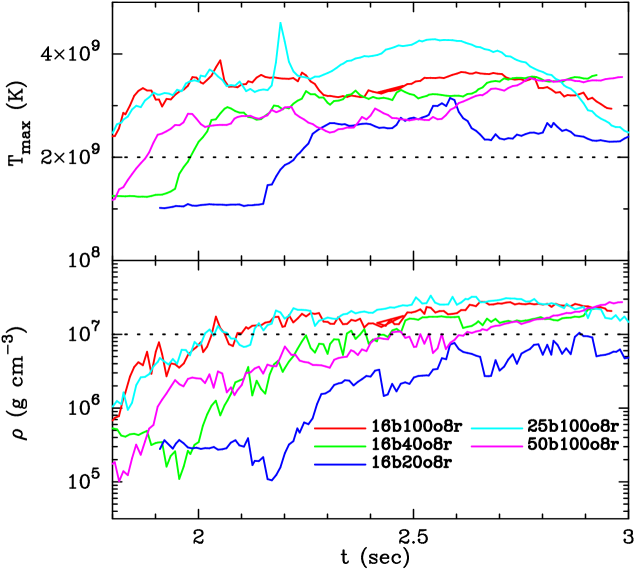
We find that the unburnt material in the surface layers of the star reaches temperatures K and densities g cm-3 in all seven 3-D simulations we performed, as illustrated in Figure 6. The values of and closely match those in our 2-D cylindrical simulations for the same resolution and initial conditions (Townsley et al., 2007). The small difference between the values of and in the 2-D and 3-D simulations for km are within the uncertainties we expect in the calculations. Thus the results of our 2-D cylindrical simulations are a good guide to the results of our 3-D simulations for the range of initial bubble radii and offset distances, and the resolutions, that we have explored so far.
In order to test the robustness of the GCD mechanism, we ran additional simulations in which we coarsened the resolution in the truncated cone encompassing the collision region from 8 km to 16 km, 32 km, and 64 km for offset distances of 40 km and 100 km. In all cases, the simulations reached the above conservative conditions for detonation. We conclude that, for the initial conditions investigated in this paper, the GCD model robustly achieves temperatures and densities necessary for detonation.
4 Discussion
4.1 Observational Properties of the 3-D GCD Model
We have carried out 3-D simulations of the GCD model at a finest resolution of 6 km for initial offset distances of 42 km and 100 km, and a finest resolution of 8 km for initial offset distances of 20 km, 42 km, and 100 km. We find that these simulations robustly reach the conditions necessary for detonation. Vladimirova (2007) and Fisher et al. (2008) have shown that the evolution of the bubble is self-similar – i.e., its evolution is independent of its initial radius – provided that , where is the initial bubble radius and is the minimum wavelength for the unstable Rayleigh-Taylor growth of flame surface perturbations (see §2). We find that the bubbles in the simulations in which and 50 km at an offset distance km do not exhibit self-similar behavior, even at early times; i.e., their size and shape at later times differ from each other and from those in the simulation for which km (see Figure 4). This is expected, since in these two simulations the radius of the initial bubble does not satisfy the condition required for self-similar behavior. These two simulations produced larger values of , but still reached conservative conditions for detonation. Finally, we find that our 3-D simulations exhibit a correlation between and initial offset distance (see Figure 4), confirming the correlation seen in our 2-D cylindrical simulations (Townsley et al., 2007).
Table 1 lists the amount of nuclear energy released up to a fiducial time of 2 s (which is approximately the time at which a detonation would occur) for the seven simulations reported in this paper. Also listed in Table 1 are estimates of the masses of heavy elements (i.e., iron-peak elements) and intermediate mass elements that are expected to be produced by a subsequent detonation, assuming that the mass of iron-peak elements is that at densities above g cm-3 and the mass of intermediate mass elements is the mass at densities below this. Finally, Table 1 lists estimates of the expected total energy of the explosion, , where we estimate from the masses of heavy and intermediate mass elements that are produced in each simulation, and is the binding energy of the initial WD model. These results suggest that all of the simulations can be expected to produce large amounts of 56Ni, and therefore very bright and energetic Type Ia supernova explosions, and small amounts of intermediate mass elements. Thus these simulations can explain only the brightest and most energetic of the Type Ia supernovae that are observed.
Simulation 50b100o8r, in which the initial bubble has a radius km and therefore become immediately subject to a strong Rayleigh-Taylor instability, may crudely mock up what happens if ignition occurs simultaneously at a cluster of points located off-center in the core of the star. The simulation released more than did the other two simulations with the same offset distance but with smaller initial bubble radii, and thus suggests a plausible way in which the GCD mechanism could produce more pre-expansion, and therefore much less nickel, yet detonate – i.e., one way in which the GCD mechanism might account for less luminous Type Ia supernovae. However, this is an open question, which we plan to explore in a future paper.
An essential aspect of the GCD model is that, while the nuclear energy released during the deflagration phase causes the star to expand prior to the detonation, it leaves the majority of the star unburnt and undisturbed, as we have shown in earlier work (Plewa, Calder, & Lamb, 2004; Plewa, 2007; Townsley et al., 2007) and in this work. The subsequent detonation phase can therefore be expected to produce a smooth, stratified compositional structure in the interior of the star similar to that inferred from spectroscopic observations of Type Ia supernovae, and something that 2-D cylindrical and 3-D simulations of both the pure deflagration model [Höflich et al. (2002); Leonard et al. (2005); Badenes et al. (2006); Wang et al. (2006, 2007)], and the deflagration to detonation (DDT) model [see, e.g. Gerardy et al. (2007)] have difficulty in doing. As is evident in Figures 1 and 2, the GCD model also produces turbulence and compositional inhomogeneities in the outermost layers of the star, which appear capable of matching properties inferred from observations of line polarization in the optical (Wang et al., 2006, 2007) and line profiles in the NIR and MIR (Gerardy et al., 2007)111It should be noted that one of the two events discussed in (Gerardy et al., 2007) is a subluminous Type Ia supernova, whereas the GCD simulations reported in this paper produce very bright Type Ia supernovae.. Thus, the pure deflagration and DDT models predict an inhomogeneous, mixed composition in the core and a uniform composition in the outermost layers of the star – a compositional structure that is opposite to that inferred from observations, while the GCD mechanism predicts a smoothly-stratified composition in the core and an inhomogeneous, mixed composition in the outermost layers of the star, which agrees qualitatively with the compositional structure inferred from observations.
4.2 Comparison With Other Work
Röpke, Woosley, & Hillebrandt (2007) have recently conducted an extensive set of 2-D cylindrical simulations and a few 3-D simulations of the deflagration phase of the GCD model. They find that the conditions for detonation are reached for a number of their 2-D cylindrical simulations for a variety of initial conditions. However, the 3-D simulations they performed did not reach conditions for detonation, whereas our 3-D simulations do.
In an effort to understand the origin of this difference, we carried out 6-km and 8-km resolution simulations for exactly the same initial conditions as were used for one of the two Röpke, Woosley, & Hillebrandt (2007) 3-D simulations in which ignition was posited to occur at a single point: an initial spherical bubble of radius 25 km offset a distance of 100 km from the center of the star (see above).222We did not simulate the other initial conditions for which Röpke, Woosley, & Hillebrandt (2007) did a 3-D simulation positing a single ignition point (i.e., an initial bubble radius of 25 km and an offset distance of 200 km) because these initial conditions lie far above the curve, and are therefore not physically self-consistent (Fisher et al., 2008). We also carried out an 8-km resolution simulation with an initial bubble radius km and an offset distance km. In all cases, the simulations reached conservative conditions for detonation, as we have described above. The results provide evidence of the ability of the GCD model to produce the conditions for detonation for a range of initial conditions, but leave unanswered the question of why Röpke, Woosley, & Hillebrandt (2007) find that the criteria for detonation are reached for a range of initial conditions in their 2-D simulations but not in the 3-D simulations that they performed, whereas we find that the criteria for detonation are satisfied for a range of initial conditions in our 2-d simulations (Townsley et al., 2007) and in our 3-D simulations, as reported in this paper.
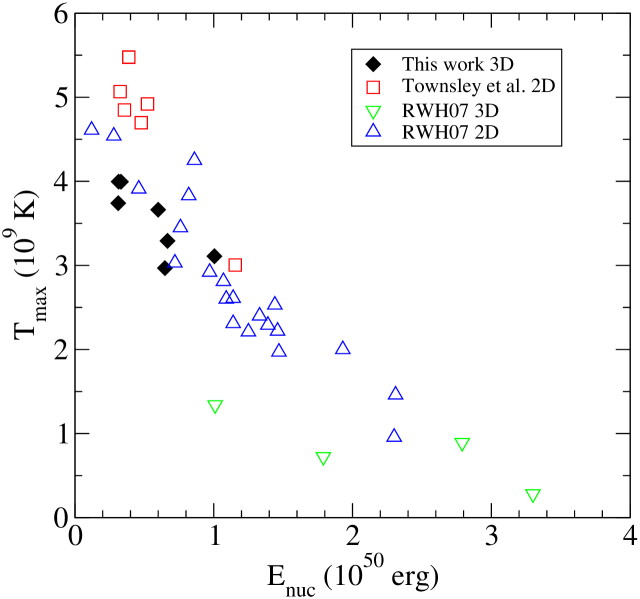
We show the values of and for both the current 3-D models and our previous 2-D models (Townsley et al., 2007), and the 2-D and 3-D models of Röpke, Woosley, & Hillebrandt (2007) in Figure 7. This figure shows that there is a relation between in the collision region and . Such a relation is expected in the GCD model to the degree that larger values of produce more pre-expansion of the WD, and therefore less kinetic energy in the flow of hot bubble material over the stellar surface, leading to lower values of the temperature in the collision region. The amount of pre-expansion of the star can be expected to depend on when the nuclear energy is released, as well as how much is released. The fact that the relation between in the collision region and shown in Figure 7 is relatively narrow suggests that the amount of nuclear energy that is released is the dominant factor in determining .
The results of our 2-D cylindrical and 3-D simulations for initial conditions consisting of a single, small, spherical bubble offset a range of distances from the center of the star agree with each other, as previously noted, and lie on the relation between and . So do the results of Röpke et al.’s 2-D cylindrical simulations for initial conditions consisting of a cluster of bubbles and for two tear-drop-shaped ignition regions located on opposite sides of the center of the star, as well as a single spherical bubble, all offset a range of distances from the center of the star. The results of their 3-D simulations for initial conditions consisting of a single bubble also follow the relation between and , but those for initial conditions consisting of a cluster of bubbles and for two tear-drop-shaped ignition regions located on opposite sides of the center of the star do not. In particular, their 3-D simulations starting with a cluster of bubbles release a low enough that they should reach detonation conditions if the relation between and were followed. Most importantly, Röpke, Woosley, & Hillebrandt (2007) make no mention of the outward-directed jet, and especially the inward-directed jet, which we find plays a crucial role in achieving detonation conditions. Consequently, it is difficult to make direct comparisons between our simulations and theirs.
The main conclusion we draw from Figure 7 is that the amount of released in Röpke et al.’s 2-D simulations is more, and in Röpke et al.’s 3-D simulations is much more, than is released in our 2-D Townsley et al. (2007) and 3-D simulations, which release similar amounts of for the same initial conditions and resolution. Consequently, the kinetic energy of the surface flow in their 3-D simulations – as measured by – is much smaller and the simulations do not achieve detonation conditions.
Without knowledge of the details of their simulations, it is difficult to know why the results of their 3-D simulations differ from those of their 2-D simulations, which – while releasing more – lead to a surface flow similar to what we see in our 2-D and 3-D simulations. A likely reason is the different treatments of buoyancy-driven turbulent nuclear burning in their simulations and in ours. Our treatment assumes that the rate of buoyancy-driven turbulent nuclear burning depends mostly on the behavior of the flow at larger scales. As we have seen, this provides an explanation for why the results of our 2-D and 3-D simulations agree. It may also provide an explanation for why the results of Röpke et al.’s 2-D simulations agree with our 2-D (and therefore also our 3-D) simulations: their treatment of buoyancy-driven turbulent nuclear burning uses the properties of the flow at scales above the grid scale of the simulation to determine the turbulent energy at subgrid scales, and therefore the increase in the nuclear burning rate (which is parameterized as an increase in the value of the flame speed) due to this turbulence. The fact that turbulence in 3-D leads to a cascade of smaller and smaller eddies, while turbulence in 2-D does not, means that their treatment of buoyancy-driven turbulent nuclear burning does not increase the rate of nuclear burning in 2-D, whereas in 3-D it will. The origin of the similarities between our 2-D and 3-D results and Röpke et al.’s 2-D results, and the difference between these results and Röpke et al.’s 3-D results, are thus most likely due to differences in the treatment of buoyancy-driven turbulent nuclear burning. As we have noted above, the appropriate treatment of such burning is an open question, and is – as the above differences emphasize – an important topic for future study.
5 Conclusions
We have conducted a series of 3-D simulations of the GCD mechanism for several offset distances and resolutions. Conservative conditions necessary for detonation are robustly achieved in all cases. The initial conditions explored in this paper lead to conditions at detonation that can be expected to produce large amounts of 56Ni and small amounts of intermediate mass elements. These particular simulations are therefore relevant only to high luminosity Type Ia supernovae. We find a correlation between the central density of the star at detonation and both the offset distance and the radius of the initial bubble. These correlations offer a possible explanation for the observed variation in nickel mass in Type Ia supernovae. Finally, the uniform, homogeneous cores and the turbulent, heterogeneous composition of the outer layers of the stars at the time when the conditions for detonation are reached match the properties inferred from recent polarization, NIR, and MIR observations of Type Ia supernovae.
References
- Asida et al. (2008) Asida, S., et al. 2008, ApJ, to be submitted
- Badenes et al. (2006) Badenes, D. C., et al. 2006, ApJ, 645, 1373
- Bravo et al. (2006) Bravo, E., & Garcia-Senz, D. 2006, ApJ, 642, L157
- Calder et al. (2002) Calder, A. C., et al. 2002, ApJS, 143, 201
- Calder et al. (2004) Calder, A. C., et al. 2004, astro-ph/0405162
- Calder et al. (2007) Calder, A. C., et al. 2007, ApJ, 656, 313
- Fisher et al. (2008) Fisher, R., et al. 2008, ApJ, to be submitted
- Fryxell et al. (2000) Fryxell, B., et al. 2000, APJS, 131, 273
- Gamezo et al. (2003) Gamezo, V. N., et al. 2003, Science, 299, 77
- Gamezo, Khokhlov & Oran (2004) Gamezo, V. N., Khokhlov, A. M., & Oran, E. S. 2004, Phys. Rev. Lett., 92, 211102
- Gamezo et al. (2005) Gamezo, V. N., Khokhlov, A. M., & Oran, E. S. 2005, ApJ, 623, 337
- Gerardy et al. (2007) Gerardy, C., et al. 2007, ApJ, 661, 995
- Höflich et al. (2002) Höflich, P., et al. 2002, ApJ, ApJ, 568, 791
- Jordan et al. (2008) Jordan, G. C., Meakin, C., A., Seitenzahl, I., Townsley, D. M., Fisher, R. T., Graziani, C., Truran, J. W., & Lamb, D. Q. 2008b. in preparation
- Khokhlov (1991) Khokhlov, A. M. 1991, A&A, 245, 114
- Khokhlov (1995) Khokhlov, A. M. 1995, ApJ, 449, 695
- Leonard et al. (2005) Leonard, D C., et al. 2005, ApJ, 632, 450
- Livne et al. (2005) Livne, E., Asida, S . M., & Höflich, P. 2005, ApJ, 632, 443
- Meakin et al. (2008a) Meakin, C., A., Seitenzahl, I., Townsley, D. M., Jordan, G., Truran, J., & Lamb, D. Q. 2008a. ApJ, to be submitted
- Niemeyer (1999) Niemeyer, J. C. 1999, ApJ, 523, L57
- Niemeyer & Woosley (1997) Niemeyer, J. C. & Woosley, S. E. 1997, ApJ, 475, 740
- Nomoto, Thielemann, & Yokoi (1984) Nomoto, K., Thielemann, F.-K., & Yokoi, K. 1984, ApJ, 286, 644
- Perlmutter et al. (1998) Perlmutter, S., et al. 1998, Abstracts of the 19th Texas Symposium on Relativistic Astrophysics and Cosmology, held in Paris, France, Dec. 14-18, 1998. Eds.: J. Paul, T. Montmerle, and E. Aubourg (CEA Saclay)
- Plewa (2007) Plewa, T. 2007, ApJ, 657, 942
- Plewa, Calder, & Lamb (2004) Plewa, T., Calder, A. C., & Lamb, D. Q. 2004, ApJ, 612, L37
- Reinecke et al. (1999) Reinecke, M., et al. 1999, A&A, 347, 724
- Reinecke et al. (2002a) Reinecke, M., et al. 2002a, A&A, 386, 936
- Reinecke et al. (2002b) Reinecke, M., et al. 2002b, A&A, 391, 1167
- Riess et al. (1998) Riess, A., et al. 1998, AJ, 116, 1009
- Röpke, Niemeyer, & Hillebrandt (2006a) Röpke, F., Niemeyer, J.C., & Hillebrandt, W. 2003, ApJ, 588, 952
- Röpke & Hillebrandt (2005) Röpke, F., & Hillebrandt, W. 2005, A&A, 431, 635
- Röpke, Woosley, & Hillebrandt (2007) Röpke, F., Woosley, S. E., & Hillebrandt, W. 2007, 660, 1344
- Schmidt, Niemeyer, & Hillebrandt (2006a) Schmidt, W., Niemeyer, J.C., & Hillebrandt, W. 2006, A&A 450, 265
- Schmidt, Niemeyer, & Hillebrandt (2006b) Schmidt, W., Niemeyer, J.C., & Hillebrandt, W. 2006, A&A 450, 283
- Timmes & Woosley (1992) Timmes, F. X. & Woosley, S. E. 1992, ApJ, 396, 649
- Townsley et al. (2007) Townsley, D., et al. 2007, ApJ, 668, 1118
- Townsley et al. (2008) Townsley, D., et al. 2008, ApJ, to be submitted
- Vladimirova (2007) Vladimirova, N. 2007, Combust. Theory Modeling, 11, 377
- Vladimirova, Weirs, & Ryzhik (2006) Vladimirova, N., Weirs, G., & Ryzhik, L. 2006, Combust. Theory Modeling, 10, 727
- Wang et al. (2006) Wang, L., et al. 2006, ApJ, 653, 490
- Wang et al. (2007) Wang, L., et al. 2007, Science, 315, 212
- Woosley, Wunsch, & Kuhlen (2004) Woosley, S. E., Wunsch, S., & Kuhlen, M. 2004, ApJ, 607, 921
- Wunsch & Woosley (2004) Wunsch, S. & Woosley, S. E. 2004, ApJ, 616, 1102
- Zhang et al. (2007) Zhang, J., et al. 2007, ApJ, 656, 347
- Zingale et al. (2005) Zingale, M., et al. 2005, ApJ, 632, 1021
| Label | Resolution | |||||||
|---|---|---|---|---|---|---|---|---|
| (km) | (km) | (km) | () | () | () | () | (s) | |
| 16b20o8r | 16 | 20 | 8 | 10.5 | 1.00 | 0.36 | 1.50 | 2.89 |
| 18b42o6r | 18 | 42 | 6 | 6.7 | 1.18 | 0.19 | 1.57 | 2.30 |
| 16b40o8r | 16 | 40 | 8 | 6.1 | 1.20 | 0.16 | 1.58 | 2.38 |
| 16b100o8r | 16 | 100 | 8 | 3.2 | 1.26 | 0.10 | 1.60 | 2.02 |
| 25b100o6r | 25 | 100 | 6 | 3.0 | 1.27 | 0.17 | 1.60 | 1.84 |
| 25b100o8r | 25 | 100 | 8 | 3.1 | 1.26 | 0.11 | 1.60 | 2.01 |
| 50b100o8r | 50 | 100 | 8 | 6.5 | 1.11 | 0.25 | 1.55 | 2.45 |
Note. — This table gives the properties of the seven 3-D simulations of GCD models reported in this paper.