The spatially resolved stellar populations of isolated early-type galaxies
Abstract
We present radial stellar population parameters for a subsample of 12 galaxies from the 36 isolated early-type galaxies of Reda et al. Using new long-slit spectra, central values and radial gradients for the stellar age, metallicity [Z/H] and -element abundance [E/Fe] are measured. Similarly, the central stellar population parameters are derived for a further 5 isolated early-type galaxies using their Lick indices from the literature. On average, the seventeen isolated galaxies have mean central [Z/H]o and [E/Fe]o of and respectively and span a wide range of ages from 1.7 to 15 Gyrs. We find that isolated galaxies follow similar scaling relations between central stellar population parameters and galaxy velocity dispersion to their counterparts in high density environments. However, we note a tendency for isolated galaxies to have slightly younger ages, higher metallicities and lower abundance ratios. Such properties are qualitatively consistent with the expectation of an extended star formation history for galaxies in lower density environments. Generally we measure constant age and [E/Fe] radial gradients. However, three galaxies show remarkable positive age gradients and two galaxies have negative age gradients. We find that the age gradients anti-correlate with the central galaxy age. Thus as a young starburst evolves, the age gradient flattens from positive to almost zero. Metallicity gradients range from near zero to strongly negative. For our high mass galaxies ( km/s) metallicity gradients are shallower with increasing mass. Such behaviour is not predicted in dissipational collapse models but might be expected in multiple mergers. The metallicity gradients are also found to be correlated with the central age and metallicity, as well as to the age gradients. In conclusion, our stellar population data for a sample of isolated early-type galaxies are more compatible with an extended merger/accretion history than early dissipative collapse.
keywords:
Galaxies: elliptical and lenticular, cD - galaxies: abundances - galaxies: formation - galaxies: evolution - galaxies: kinematic and dynamics1 Introduction
The stellar population properties of early-type galaxies (e.g. age, metallicity and -element abundance [E/Fe]) provide crucial clues to their evolutionary history. Most work to date has concentrated on galaxy central regions. While useful, such data only sample a small fraction of the galaxy mass and do not provide any radial gradient information.
Radial gradients can help discriminate between different formation models. For example, dissipational collapse models (Larson 1974; Carlberg 1984; Kawata & Gibson 2003) predict strong metallicity gradients that correlate with galaxy mass, whereas mergers tend to result in shallow gradients (White 1980; Bekki & Shioya 1999) with little galaxy mass dependence. As [E/Fe] may be an indicator of star formation timescale, a positive gradient indicates outside-in formation and a negative one the opposite (e.g. Ferreras & Silk 2002). Age gradients indicate whether any young stars are confined to the central regions, and hence an indication of their mass contribution.
Kobayashi & Arimoto (1999) compiled a list of 80 early-type galaxies with radial metallicity gradient measurements; the average value being –0.3 dex per dex. For Coma cluster ellipticals, Mehlert et al. (2003) confirmed significant radial metallicity gradients but, on average, found no radial age or [E/Fe] gradients. In contrast, Sánchez-Blázquez et al. (2006a) found significant age gradients in a sample of cluster, group and field early-type galaxies. A weak correlation between metallicity gradient and galaxy mass was found by Sánchez-Blázquez et al. (2007) and Forbes, Sánchez-Blázquez & Proctor (2005) for cluster ellipticals.
The number of studies that have focused on the stellar populations of early-type galaxies in very low density environments is small. Kuntschner et al. (2002) obtained spectra of three E and six S0 galaxies in low density environments (i.e. they had less than two bright neighbours within 1.3 Mpc and 350 km/s). Five of their nine galaxies revealed emission indicating ongoing star formation. Using Lick absorption lines and Vazdekis (1999) single stellar population (SSP) models they found their galaxies to be on average younger and more metal-rich than cluster galaxies. However, they noted the dominance of S0s in their sample. They also found a similar [E/Fe] vs velocity dispersion relation as for cluster galaxies. Collobert et al. (2006) extended the Kuntschner et al. work with spectra of 22 galaxies, for Hubble types ranging from S0/a to pure E. Half came from the 2dFGRS survey (with no bright companions within 1 Mpc) and half from the low density sample of Colbert et al. (2001) (no RC3 catalogued galaxies within 1 Mpc and 1000 km/s). After applying emission line corrections to 7 of their 22 galaxies, they applied Thomas, Maraston & Bender (2003) models to 7 Lick absorption lines with a fitting technique. They found a spread to younger ages than for cluster ellipticals, but no clear [E/Fe] vs velocity dispersion relation. They speculated that isolated ellipticals assembled quite recently. Both studies only probed the central regions of their sample galaxies.
Here we extend the previous work by examining the radial stellar population properties to around 1 effective radius in a sample of a 12 isolated galaxies. The sample presented here comes from the well-defined and highly isolated sample of early-type galaxies from Reda et al. (2004). Our new data are supplemented by data for 5 isolated galaxies from the literature. We also utilize the latest SSP models and fitting methods.
2 The data
In Reda et al. (2004), we defined a sample of 36 isolated early-type galaxies in the local universe (). Here we present new data on the stellar populations of a subsample for 12 galaxies from that sample. The basic data of these galaxies and their sources are summarised in Table 1. We supplement our data with data from the literature for other isolated galaxies of Reda et al. (2004).
Denicoló et al. (2005a) extracted 21 Lick spectral indices for the central r region for a sample of 86 early-type galaxies. Six of our 36 isolated galaxies were included in their study. Denicoló et al. applied an emission correction to the indices where the galaxy spectra show evidence of emission lines. Comparing their extracted stellar population parameters to the literature, their measurements tend to be younger and more metal-rich (Denicoló et al. 2005b). Using their published indices of the six isolated galaxies, and applying the multi-index minimization technique which we are using for our observations and the same SSP model (see Sec. 2.5), we have extracted the central stellar population parameters for these galaxies which are listed in Table 2.
The spatially resolved stellar population of the isolated galaxy NCG 821 was previously studied by Proctor et al. (2005). Here we used their data to extract the central values of the age, total metallicity [Z/H] and -elements abundance [E/Fe] within r which are also listed in Table 2. These measurements of the central parameters are consistent to our measurements using the indices from Denicoló et al. (2005a). We also measured the radial gradient of these parameters, considering all apertures beyond the seeing limit, to be 0.290.05, 0.03, 0.04 for log(age), [E/Fe] and [Z/H] respectively.
| Table 1. Basic data for the observed isolated galaxies. | |||||||
| Galaxy | Dist. | ||||||
| (Mpc) | (mag) | (mag) | source | (pc) | source | ||
| NGC 682 | 73 | –24.88 | –19.9 | Paper I | 3.73 | 0.10 | PS97 |
| NGC 1045 | 60 | –25.02 | –20.9 | Paper I | 3.66 | 0.10 | Paper I |
| NGC 1162 | 51 | –24.53 | –20.7 | Paper I | 3.63 | 0.10 | 2MASS |
| NGC 2271 | 32 | –23.84 | –20.0 | Paper II | 3.47 | 0.07 | Paper II |
| NGC 2865 | 35 | –24.26 | –20.7 | Paper I | 3.68 | 0.01 | Paper I |
| NGC 4240 | 26 | –22.71 | –18.8 | Paper I | 3.29 | 0.10 | 2MASS |
| ESO 153-G003 | 84 | –25.04 | –20.9 | Paper II | 3.62 | 0.06 | Paper II |
| ESO 218-G002 | 54 | –24.51 | –20.9 | Paper I | 3.76 | 0.11 | Paper I |
| ESO 318-G021 | 62 | –24.43 | –20.7 | Paper II | 3.77 | 0.01 | Paper II |
| MCG-01-27-013 | 121 | –25.08 | –21.4 | Paper I | 3.98 | 0.05 | Paper I |
| MCG-02-13-009 | 73 | –24.58 | –21.3 | Paper I | 3.67 | 0.10 | 2MASS |
| MCG-03-26-030 | 119 | –25.79 | –21.7 | Paper I | 3.92 | 0.02 | Paper I |
Note: Distances are obtained using the Virgo corrected recession velocities (from LEDA) with H0 = 75 km s-1 Mpc-1. and are the absolute magnitudes in the and -bands respectively. are from 2MASS catalogue and from Reda et al. (2004, Paper I) and Reda et al. (2005, Paper II). Effective radius re from the 2MASS catalogue is the isophotal radius in the -band (via LEDA database) converted to effective radius using the correlation in Jarrett et al. (2003, Fig. 11). For NGC 682 the effective radius is derived from the fundamental plane (Prugniel & Simien 1997; PS97)
| Table 2. Central (rr) stellar populations of isolated galaxies from literature. | ||||
|---|---|---|---|---|
| Galaxy | log() (km/s) | ageo (Gyr) | [E/Fe]o | [Z/H]o |
| NGC 821 | 2.33 0.06 | 4.7 1.9 | 0.15 0.02 | 0.48 0.05 |
| NGC 1045 | 2.36 0.06 | 5.3 1.4 | 0.12 0.02 | 0.43 0.03 |
| NGC 1132 | 2.37 0.05 | 11.2 4.7 | 0.36 0.04 | 0.10 0.07 |
| NGC 2128 | 2.25 0.06 | 2.8 1.2 | 0.27 0.03 | 0.48 0.09 |
| NGC 6172 | 2.13 0.05 | 2.5 0.5 | 0.00 0.03 | 0.13 0.04 |
| NGC 6411 | 2.25 0.03 | 10.6 0.8 | 0.18 0.04 | –0.05 0.02 |
| NGC 821 | 2.29 0.01 | 5.6 0.5 | 0.220.01 | 0.41 0.06 |
Notes: Parameters of the first six galaxies are obtained using the published Lick indices of Denicoló et al. (2005a) and refit to a SSP model for this work. For NGC 821, the parameters are the average of all apertures within rr from Proctor et al. (2005).
2.1 Observations
Our spectroscopic observations were carried out using EFOSC2 at the ESO 3.6m telescope on the La Silla Observatory in two observing runs, 2002 Jan. 16-18 and 2004 Dec. 11-12. The observational set up and slit position are described in detail by Hau & Forbes (2006). Lick and spectrophotometric standard stars were observed at the parallactic angle. The observing nights were photometric and the seeing was generally better than .
Observations of the first run (2002) were collected using a slit of length and width which was positioned along the major axis of each galaxy, with exception for the S0 galaxy ESO 153-G003 where the slit was positioned along the minor axis to avoid the disc. Using the ESO grism#8 of 600 line/mm provides a spectral resolution of 9.3 Å FWHM. The accumulated exposure time was 2 1200 seconds for each galaxy. In the 2004 run we used a slit which provides a spectral resolution of 7.8 Å FWHM. The accumulated exposure time was 3 1200 seconds for each galaxy. The multiple observations of each galaxy are combined to increase the S/N ratio.
Additionally, a number of spectrophotometric stars were observed for flux calibration and Lick standard stars (of type between K0 and K5) to be used as templates for velocity dispersion measurements and for calibration of the line-strength indices to the Lick/IDS system. A number of bias, dark current and dome flat were recorded each night. Observations of all galaxies and stars gave a wavelength coverage of 4300-6300 Å.
2.2 Basic data reduction
Data reduction, including bias, dark current and flat field subtraction, is performed using tasks within IRAF. Wavelength calibration is done using Helium-Argon lamp and is good to within 0.5 Å, while the flux standard stars are used to calibrate the spectra. The 2-D spectra are corrected for the S-distortion and sky subtracted. For more details about the data reduction refer to Hau & Forbes (2006).
Finally the 2-D spectra of the galaxies are spatially binned using the STARLINK task EXTRACT to obtain 1-D spectra of S/N ratio greater than 20. We will refer to these 1-D spectra of each galaxy as apertures.
2.3 Velocity Measurements
The heliocentric recession velocity of the standard stars are obtained by comparing their spectra to the solar spectrum. The fxcor task within IRAF is used to fit a Gaussian to the cross-correlation function to determine the maximum peak. The position of the maximum peak centre gives the required heliocentric recession velocity of the stars.
Once the heliocentric recession velocity of the standard stars were measured, the redshifts and velocity dispersions of the galaxies are determined by comparing their spectra to the spectra of the standard stars. The fxcor task of IRAF is used to compute the cross-corelation of the galaxy spectra with the spectra of each template star. Once the correlation is computed, the position of the maximum peak centre gives the recession velocity Vr and the velocity dispersion . The final Vr and are the average of the values estimated from all the template stars. The radial kinematics for the same sample of galaxies are discussed in Hau & Forbes (2006).
2.4 Absorption line-strength measurements
| Table 3. Offset of the Lick indices from the published values. | |||||
|---|---|---|---|---|---|
| 2002 run | 2004 run | ||||
| Index | unit | mean | error of | mean | error of |
| offset | the mean | offset | the mean | ||
| Fe4383 | Å | –0.031 | 0.329 | –0.229 | 0.120 |
| Ca4455 | Å | 0.214 | 0.152 | –0.054 | 0.171 |
| Fe4531 | Å | –0.163 | 0.132 | –0.342 | 0.103 |
| C4668 | Å | –0.828 | 0.097 | –0.598 | 0.187 |
| H | Å | –0.018 | 0.088 | –0.041 | 0.113 |
| Fe5015 | Å | –0.284 | 0.079 | –0.357 | 0.185 |
| Mg1 | mag | 0.013 | 0.002 | 0.019 | 0.007 |
| Mg2 | mag | 0.019 | 0.003 | 0.018 | 0.006 |
| Mgb | Å | –0.083 | 0.071 | 0.039 | 0.195 |
| Fe5270 | Å | –0.135 | 0.053 | –0.412 | 0.147 |
| Fe5335 | Å | –0.214 | 0.093 | –0.274 | 0.215 |
| Fe5406 | Å | –0.121 | 0.035 | –0.302 | 0.059 |
| Fe5709 | Å | –0.006 | 0.128 | 0.031 | 0.065 |
| Fe5782 | Å | 0.084 | 0.026 | 0.027 | 0.067 |
| NaD | Å | 0.058 | 0.132 | –0.239 | 0.138 |
| TiO1 | Å | 0.004 | 0.005 | 0.006 | 0.003 |
We adopted the definition of Lick/IDS absorption line indices from Trager et al. (1998). They defined each index using a pair of pseudocontinua bracketing the line feature and the central passbands of the line itself.
Our observations cover a wavelength range of 4300-6300 Å which includes 16 Lick/IDS index. These are one Balmer index (H), three Magnesium indices (Mg1, Mg2 and Mgb), Calcium (Ca4455), Sodium (NaD), Titanium Oxide (TiO1) indices plus nine Iron indices Fe4383, Fe4531, Fe4668 (referred to as C4668), Fe5015, Fe5270, Fe5335, Fe5406, Fe5709 and Fe5782.
A number of Lick standard stars were observed during each observing run and will be used in the following sections to calibrated the measured indices to the Lick system.
2.4.1 Matching to the Lick resolution
Lick absorption indices are affected by a wavelength dependent instrumental resolution. This resolution ranges from minimum value of Å in the range 4900- 5400 Å and degrade at the blue and red sides reaching above Å (see Fig. 7 in Worthey & Ottaviani 1997). Our observed instrumental resolutions (9.3 Å and 7.8 Å for 2002 and 2004 runs respectively) are different from those of the standard Lick system. The galaxy velocity dispersion will also alter the observed resolution of the absorption lines.
To transform to the standard Lick system, two different methods are used according to the observed total resolution of the spectra (including both instrumental and velocity dispersion effects). For indices with combined resolution higher than that of the Lick system, spectra are degraded to the resolution of the Lick/IDS library by convolving the spectra with a wavelength dependent Gaussian. While for indices with resolution lower than the Lick/IDS system, a correction factor is measured by convolving the spectra of five Lick standard stars with a series of Gaussians widths from 0 to 500 km/s. Comparing the indices from the artificially broadened stellar spectra to the un-broadend indices, we estimate the index corrections for the broadening effect of velocity dispersion in galaxies. This factor is then used to transform the indices measured in the galaxies of low resolution spectra to the Lick resolution (Proctor & Sansom 2002; Proctor et al. 2004).
2.4.2 Zero-point offset due to flux calibration
Furthermore, the original Lick/IDS spectra were not flux calibrated while our spectra are. To compensate for the resulting effect on the shape of the spectral continuum, the differences between the measured and the published indices values are obtained for each observed calibration star. For each index, the values from all stars are averaged and compared to the literature values to give the mean offset. The error of the mean is obtained as: where is the of the scatter about offset and is the number of the standard stars. The adopted offset of each index and its error are given in Table 3.
2.5 Galaxy stellar population parameters

The age, total metallicity [Z/H] and -element abundance [E/Fe] properties of our sample galaxies are estimated by comparing the Lick absorption lines indices to the single stellar population (SSP) model of Thomas, Maraston & Korn (2004, TMK04). The [E/Fe] parameter measures the ratio of the -elements (N, O, Mg, Na, Si, Ti) to the Fe-peak elements (Cr, Mn, Fe, Co, Ni, Cu, Zn).
The multi-index minimization technique (Proctor & Sansom 2002; Proctor et al. 2004) is used to obtain the corresponding SSP model values of the age, [Z/H] and [E/Fe] abundance ratios for the galaxies. In this technique as many indices as possible are fit to the model. Because most indices contain some information regarding each of the stellar parameters (Proctor & Sansom 2002), using this fitting technique has advantages of including all possible information recorded in all absorption line indices to measure these parameters. Another advantage of this fitting technique is that it identifies indices that are highly deviant from model values, permitting their exclusion from the fitting process. In addition, we note that parameters measured in this way are less prone to uncertainties in data reduction such as flux calibration, stray cosmic ray and also less prone to weak emission effects (Proctor, Forbes & Beasley 2004). Therefore we start by fitting all 16 indices. The indices which deviate by more than are clipped and the fit recalculated. After clipping the highly deviated indices (), we notice that, for some apertures within each galaxy, the fitting is still not stable and the estimated values of the age, metallictiy and [E/Fe] are significantly affected by clipping different indices. Also, after this initial fitting process, many spectral indices show a significant range of deviations from the best fitting values. Considering NGC 2271 as a typical galaxy of the sample, the left panel of Fig. 1 shows the average deviation in units of error (i.e. ) of the 16 indices from the best fit values.
Furthermore, we notice that some indices lie outside the model grid which can be due to residual offsets between the measured indices and the standard system, unknown dependencies of the line strength predictions on any abundance ratio or inaccuracies in SSP models. To eliminate the effects of the remaining offsets, we implemented the technique described by Kelson et al. (2006) to shift the zero points of the model to our data. Kelson et al. defined the reference point as a set of previously published stellar population parameters for the central massive early-type galaxy in the cluster of their study. To apply this technique to our galaxy sample we define a local reference point for each galaxy by choosing two central apertures with high S/N ratios that show higher stability during the initial fitting to the model. The initial measured age, [Z/H] and [E/Fe] of these two central apertures are considered as a reference zero point for that galaxy. We measure the offset between each index from the corresponding values in the model, at fixed age and metallicity as estimated by the initial fit. Then we apply similar shifts to the indices of all other apertures. After applying this shift, the number of highly deviant indices from the model is reduced and consequently larger number of indices are used during the fitting process which become much faster. Examining the extracted stellar population parameters before and after shifting the indices, we find that they are similar. That means applying Kelson et al. method only reduces the scatter of the indices around the model. Fig. 1 shows the average deviation of the indices before and after applying Kelson et al. technique. Errors in the derived parameters are estimated using Monte Carlo type realizations of the best-fitting SSP models perturbed by the index error estimates. Hence, the average estimated errors of stellar population parameters based on the observational errors are about dex for the log(age), [Z/H] and [E/Fe] and for log().
The weak [O III] and/or H emission in the two galaxies ESO318-G021 and MCG-02-13-009 (Hau & Forbes 2006) is found to have no significant effect on our measurements of the stellar population parameters, again because of our use of all available indices and the multi-index minimization technique to fit the indices to the SSP model.
3 results
3.1 Central stellar population parameters
The central stellar population parameters of each galaxy are obtained by averaging the values of all apertures within the central . The values are listed in Table 4 with the error on the mean. In the following sections we will investigate these values and their correlations compared to those for galaxies in high density environments (HDEs).
The stellar populations of three isolated galaxies NGC 821, NGC 1045 and NGC 2865 were previously measured in the literature. Comparing our measurements of NGC 2865 to those of Sánchez-Blázquez et al. (2007), we found comparable values of the central age (1.7 vs. 1.0 Gyrs), [Z/H]o (0.48 vs. 0.52) and [E/Fe]o (0.07 vs. 0.13). On the other hand, comparing our measurements for NGC 1045 to those obtained by using the data of Denicoló et al. (2005a), their data indicate a younger age (5 vs. 10 Gyrs), more metal-rich (0.43 vs. 0.31) and less enhanced [E/Fe]o (0.12 vs. 0.36). We note that this galaxy does not show emission lines and Denicoló et al. did not apply any emission corrections to its indices. For NGC 821, both measurements of Proctor et al. (2005) and those we obtained by using the data of Denicoló et al. (2005a) are comparable (see Table 2). Through out this paper we will consider our measurements for NGC 1045 and NGC 2865 and Proctor et al. values for NGC 821.
3.1.1 Central values
| Table 4. Central (rr) stellar population parameters and the error on the mean. | ||||
|---|---|---|---|---|
| Galaxy | log() | ageo (Gyr) | [E/Fe]o | [Z/H]o |
| NGC 682 | 2.30 0.01 | 8.0 0.6 | 0.30 0.01 | 0.33 0.02 |
| NGC 1045 | 2.42 0.01 | 10.4 0.6 | 0.36 0.02 | 0.31 0.02 |
| NGC 1162 | 2.29 0.01 | 6.8 0.4 | 0.31 0.01 | 0.29 0.02 |
| NGC 2271 | 2.37 0.01 | 11.5 0.5 | 0.14 0.01 | 0.44 0.02 |
| NGC 2865 | 2.25 0.02 | 1.7 0.1 | 0.07 0.01 | 0.48 0.05 |
| NGC 4240 | 2.09 0.01 | 7.4 0.5 | –0.07 0.01 | 0.23 0.02 |
| ESO153-G003 | 2.34 0.01 | 11.2 0.4 | 0.28 0.01 | 0.19 0.01 |
| ESO218-G002 | 2.43 0.01 | 14.8 0.1 | 0.26 0.01 | 0.35 0.01 |
| ESO318-G021 | 2.37 0.01 | 8.9 0.9 | 0.08 0.01 | 0.34 0.03 |
| MCG-01-27-013 | 2.39 0.01 | 8.0 1.6 | –0.03 0.01 | 0.34 0.04 |
| MCG-02-13-009 | 2.33 0.02 | 9.6 1.2 | 0.05 0.02 | 0.36 0.02 |
| MCG-03-26-030 | 2.47 0.01 | 14.5 0.2 | 0.15 0.03 | 0.27 0.01 |
Including the additional data from Table 2, the seventeen isolated galaxies show a range of central luminosity-weighted ages. Roughly half (9 out of 17) are older than 9 Gyr, five galaxies are between 5 and 8 Gyrs, and 3 with ages younger than 3 Gyrs. The sample has an average age of Gyrs. This is younger than the average age of about 11 Gyr for galaxies in the Coma cluster found by Mehlert et al. (2003). Younger average luminosity-weighted ages for galaxies in low density environments were also found by Proctor et al. (2004; see also references therein) in comparison of galaxies in high density environments (HDEs) such as clusters and Hickson compact groups to those in loose groups and field. Similar results were also found in the large sample study of Terlevich & Forbes (2002).
On average, our isolated galaxies have central luminosity-weighted total metallicities of [Z/H]. Mehlert et al. (2003) quotes values of and for the Coma cluster galaxies of types E and E/S0 respectively and Collobert et al. (2006) found an average of [Z/H] for their cluster galaxies. Using the published stellar population parameters in Thomas et al. (2005), we find that the early-type galaxies in their HDE subsample have an average of [Z/H], while their galaxies in low density environments are more metal-rich by about 0.05-0.1 dex.
The average central luminosity-weighted [E/Fe]o of our isolated galaxies is . Comparing to the mean value of [E/Fe] reported by Mehlert et al. (2003) for cluster galaxies, our isolated galaxies show lower values by order of 0.1 dex. Although, if we arbitrarily divide our sample in half, then 8 out of 17 of our galaxies are significantly enhanced with [E/Fe]. These eight galaxies are comparable to those measured by Proctor et al. (2004) for galaxies in massive and compact groups ([E/Fe]). The other nine galaxies resemble the solar element abundance with [E/Fe] which is lower than what Proctor et al. obtained for field galaxies ([E/Fe]).
3.1.2 Central parameters correlations
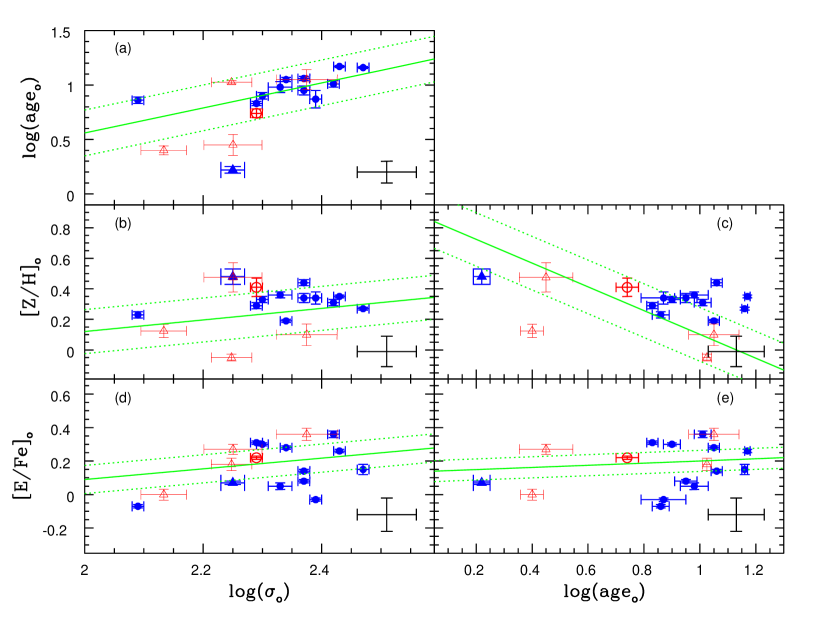
Above we have compared the central stellar population parameters of the isolated galaxies with their counterparts in HDEs. However, such parameters are known to vary with galaxy velocity dispersion (e.g. Kuntschner et al. 2001, 2002; Mehlert et al. 2003; Collobert et al. 2006; Sánchez-Blázquez et al. 2006b; Brough et al. 2006). Next we compare the correlations between central stellar population parameters of our isolated galaxies to those in HDEs.
Bernardi et al. (2006) identified a sample of 490 early-type galaxies in HDEs from the SDSS at redshifts of . They define the HDEs as those galaxy systems of total luminosity more than 10 times the luminosity of a typical early-type galaxy. To obtain a high S/N ratio for their spectra, they co-added similar objects by using narrow bins in luminosity, size, velocity dispersion, and redshift (Bernardi et al. 2003). The 490 galaxies produced 105 composite spectra of S/N. Using their published stellar population parameters and correlations between those parameters, we have measured the scatter of their galaxies about these correlations. In Fig. 2, solid lines are the best fit relation from Bernardi et al., and dotted lines represent the scatter calculated by us. Similar trends to Bernardi et al. were found for galaxies in HDEs by previous studies (e.g. Kuntschner et al. 2002; Mehlert et al. 2003; Collobert et al. 2006; Sánchez-Blázquez et al. 2006b).
For our isolated galaxies, trends between the stellar population parameters in the central regions and the central velocity dispersion (a proxy for mass) are examined in Fig. 2 (a),(b) and (d), while panels (c) and (e) show correlations of [Z/H] and [E/Fe] with age. Isolated galaxies follow similar trends to those in HDEs with more massive galaxies being older, more metal-rich and with higher [E/Fe]o than less massive ones. Isolated galaxies show slightly higher scatter towards younger ages, higher [Z/H]o and lower [E/Fe]o for their velocity dispersion than those in HDEs. In panels (d) and (e), the two galaxies NGC 4240 and MCG-01-27-013 are the most deviant galaxy from the correlations with very low [E/Fe]o for their velocity dispersion and age.
Similarly, comparing galaxies in low density environments with those in Fornax cluster, Kuntschner et al. (2002) found that both samples follow similar log()-metallicity trends, although galaxies in low density environments show higher metallicities by dex.
Panel (c) shows the observed age-metallicity relation for the isolated galaxies. Although the correlated errors of the age and metallicity may be partly responsible for this correlation (e.g. Kuntschner et al. 2001), our isolated galaxies follow a similar correlation to HDE galaxies. While the effect of the correlated errors is expected to reduce the measured metallicity of old galaxies, we note that the oldest three of our galaxies (ESO218-G002, MCG-03-26-030 and NGC 2271) with age Gyrs, tend to be more metal-rich than the average galaxy. On the other hand, the galaxy NGC 6172 tends to be younger and less metal-rich than the general trend of the correlation. The stellar population of this galaxy is extracted from the emission corrected Lick absorption indices from Denicoló et al. (2005a), which perhaps leads to measuring a younger age.
As a function of central age, panel (e) shows that many of the isolated galaxies have low [E/Fe]o for their age compared to their counterparts in HDEs. Low values of [E/Fe]o have been previously reported by Collobert et al. (2006) for their galaxies in low density environments.
In summary, isolated galaxies in our sample span a large range of ages. Scaling relations between central stellar parameters are similar to those for galaxies in higher density environments albeit with a tendency to younger central ages, higher [Z/H] and lower [E/Fe].


3.2 Kinematic and stellar population radial profiles
The radial recession profile of the stellar population parameters are fit with a weighted least squares method to measure the gradient for all apertures beyond the seeing limit of . These fits are listed in Table 5. We note that our measurements of [Z/H] and [E/Fe] gradients of the galaxy NGC 2865 are comparable to those found by Sánchez-Blázquez et al. (2007), although they found a steeper age gradient of . Throughout this paper we use our measurements for this galaxy which is shown in all plots as a solid triangle.
In the following sections we examine the radial profile of each parameter in detail.
| Table 5. The radial gradients of the age, [E/Fe] and [Z/H] parameters. | |||
|---|---|---|---|
| Galaxy | log(age) | [E/Fe] | [Z/H] |
| NGC 682 | –0.03 0.08 | –0.01 0.03 | –0.25 0.03 |
| NGC 1045 | –0.19 0.04 | –0.05 0.03 | –0.24 0.03 |
| NGC 1162 | 0.29 0.07 | –0.02 0.04 | –0.44 0.03 |
| NGC 2271 | 0.03 0.07 | 0.07 0.05 | –0.05 0.04 |
| NGC 2865 | 0.63 0.07 | –0.03 0.03 | –0.47 0.05 |
| NGC 4240 | 0.16 0.12 | –0.01 0.06 | –0.30 0.06 |
| ESO153-G003 | 0.02 0.08 | 0.03 0.07 | –0.22 0.05 |
| ESO218-G002 | –0.04 0.04 | –0.04 0.07 | –0.28 0.04 |
| ESO318-G021 | –0.16 0.11 | 0.06 0.07 | 0.01 0.07 |
| MCG-01-27-013 | 0.07 0.25 | –0.14 0.13 | –0.05 0.14 |
| MCG-02-13-009 | –0.58 0.27 | –0.13 0.10 | –0.15 0.15 |
| MCG-03-26-030 | 0.01 0.04 | 0.05 0.08 | –0.10 0.02 |
3.2.1 Rotation velocity and velocity dispersion profiles
The detailed kinematics of our sample of galaxies including the radial velocity and velocity dispersion profiles of the galaxies have been previously studied by Hau & Forbes (2006). Reproducing the velocity profiles (see Sec 2.3), we confirm their findings of kinematic substructures in some of these galaxies. Rapidly rotating cores are detected in seven galaxies, three reveal fast rotating outer discs, while three galaxies show central peaked velocity dispersion profiles (see Hau & Forbes for details).
3.2.2 Age profiles
Although having a wide range of ages, Figs 3 show that the majority of our sample of isolated early-type galaxies show statistically insignificant age gradients with an average of dex per dex. Four of these galaxies (NGC 2271, ESO153-G003, ESO218-G002 and MCG03-26-030) have uniform ages older than 10 Gyrs indicating a formation epoch at . Two galaxies, ESO318-G021 and MCG01-27-013, show intermediate ages of 8.9 and 8.0 Gyrs which indicate an extended star formation history to .
Although two galaxies, NGC 682 and NGC 4240, show insignificant age gradients, they are composed of both old and relatively younger populations, which suggests a secondary star formation epoch for these two galaxies. NGC 682 shows a global age of Gyrs, with a younger population of about Gyrs in the region around (). The stellar kinematics at the same region and outwards indicates the presence of a rotating disk with a rotational velocity of 150 km/s combined with a low velocity dispersion which declines from about 200 km/s at reaching 130 km/s at the outer regions. For NGC 4240, despite its statistically insignificant age gradient of , it has evidence for younger stars ( Gyr) in the central regions at .
Remarkable positive gradients, with the central regions being younger, are seen in two galaxies. The galaxy NGC 1162 shows a gradient of with the central stellar population having an intermediate age of about Gyr for compared to an age Gyr in the outer regions. NGC 2865 is the youngest member of our sample with a central stellar population as young as 1.7 Gyr for and intermediate age stars of Gyr outwards. This galaxy shows the steepest overall age gradient of . The kinematics of the central (r) regions of these two galaxies suggest rotationally supported cores (Hau & Forbes 2006).
NGC 1045 and MCG-02-13-009 show negative age gradients of and respectively. The former galaxy has a population of intermediate age stars ( Gyr) beyond . This galaxy also shows asymmetrical rotation and a declining velocity dispersion profile outwards indicating velocity substructure (see also Hau & Forbes 2006). While the later galaxy shows a steady age decrease outwards, a peaked central velocity dispersion and a slowly rotating body.
We note that in the HDE of the Coma cluster, Mehlert et al. (2003) measured insignificant age gradients for 91 per cent of their galaxies.
3.2.3 Metallicity profiles
The mean metallicity gradient of the 17 isolated galaxies is . The two youngest galaxies of the sample NGC 1162 and NGC 2865, both have steep positive age gradients, and show steep metallicity gradients of and respectively. NGC 821 also has a young central stellar population and a very steep [Z/H] gradient of (Proctor et al. 2005).
On the other hand, three galaxies (ESO318-G021, MCG -01-27-013 and MCG-02-13-009) which show statistically insignificant age gradients, also show negligible change of the metallicity between the centre and the outer regions with average radial gradients of . The flat metallicity gradient of these three galaxies, can perhaps be due to the short coverage of our spectra, i.e. only to r. While Mehlert et al. (2003) measure on average zero age gradients for galaxies in the Coma cluster, the total metallicity gradient was more pronounced (although with a large scatter) with their galaxies having a mean negative gradient of . Sánchez-Blázquez et al. (2007) measure an average [Z/H] gradient of for a sample of galaxies in mostly HDEs.
3.2.4 -element profiles
Figs 3 show that our sample galaxies have insignificant radial gradients of [E/Fe] with an average of . Despite the measured flat gradient of [E/Fe] for the galaxy NGC 2865, visual inspection reveals fluctuations between [E/Fe]=–0.1 and 0.1 which may be related to the shell structure of this galaxy. Insignificant radial gradients of [E/Fe] were also found by Mehlert et al. (2003) for the early-type galaxies in the Coma cluster with an average of .
3.2.5 Radial gradient correlations
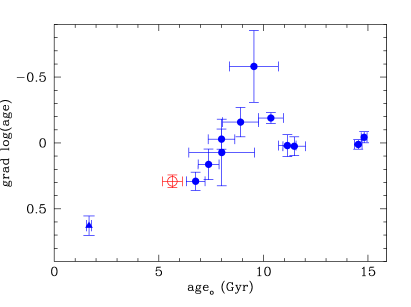
Although most of our galaxies reveal statistically insignificant age gradients, Fig. 6 shows that while galaxies older than 11 Gyrs show no age gradients (i.e. uniformally old stellar populations), the age gradients of young galaxies are strongly anti-correlated with the central age. No significant dependence of the age gradient on the central velocity dispersion, [Z/H]o or [E/Fe]o was found. This suggests that galaxy mass and star formation timescale plays little role in establishing age gradients. Thus as a young starburst evolves, the age gradient flattens from positive to almost zero.
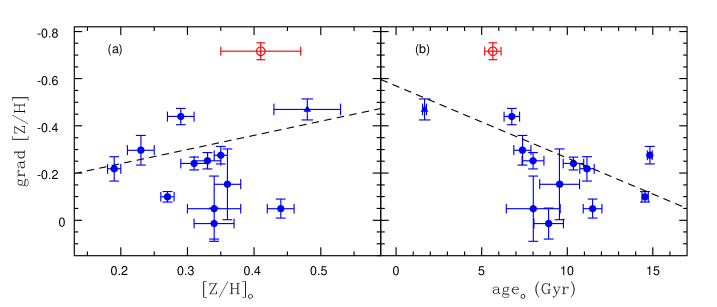
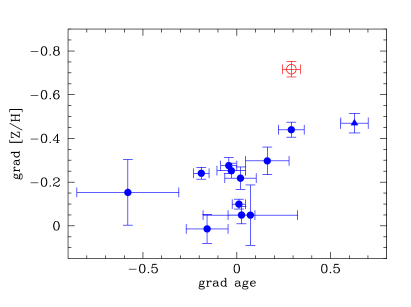
Fig. 7 panel (a) shows the total metallicity gradient as a function of its central value. The dashed line represents the trend found by Sánchez-Blázquez et al. (2007) for galaxies mostly in HDEs of clusters and groups. Excluding galaxies with flat metallicity gradients (see Sec. 3.2.3), our galaxies follow the trend. This trend indicates that galaxies with steeper gradients have more metal-enriched inner regions. The galaxy NGC 2271 is the most deviant from the relation with a very shallow gradient for its central metallicity.
A correlation between the metallicity gradient and central age was detected in many previous studies for galaxies in different environments (e.g. Sánchez-Blázquez, Gorgas & Cardiel 2006a; Sánchez-Blázquez et al. 2007). Excluding the three galaxies with flat metallicity gradients (see Sec. 3.2.3), Fig. 7 (b) shows that our galaxies follow similar trends as those found by Sánchez-Blázquez et al. (2007) for galaxies in higher density environments. Galaxies with young central ages tend to have steep metallicity gradients while galaxies with uniform old stellar populations reveal shallower metallicity gradients. Since the galaxies with young central ages are those with the steepest age gradients (Fig. 6), we expect the gradient of the total metallicity and the age gradient to be strongly correlated. Fig. 8 shows that galaxies of steep positive age gradients also show steep negative metallicity gradients. This implies that the young central stellar populations are also more metal-rich than the old metal-poor stars in the outer regions of the galaxies.
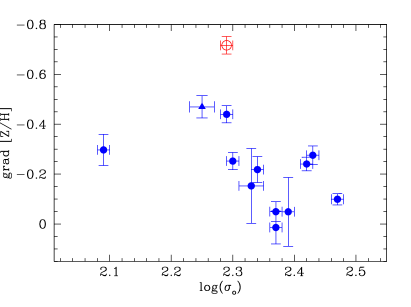
Fig. 9 shows that galaxies of smaller mass (lower log()) tend to reveal steeper metallicity gradients than more massive galaxies (larger log()). A hint of a similar trend was found by Sánchez-Blázquez et al. (2007) for galaxies of log() ( km/s). A change in the trend direction at this velocity dispersion, has been reported in several studies (see Sánchez-Blázquez et al. 2007 and references therein). Thus for galaxies with log() , metallicity gradients appear to get shallower for lower mass (e.g. Forbes et al. 2005). We note that NGC 4240 (log()) is consistent with this suggestion.
Examining the correlation of the metallicity gradient with galaxy dynamical mass log() and the absolute magnitude in the K-band (as other proxies of mass) gives similar trends to that of Fig. 9.
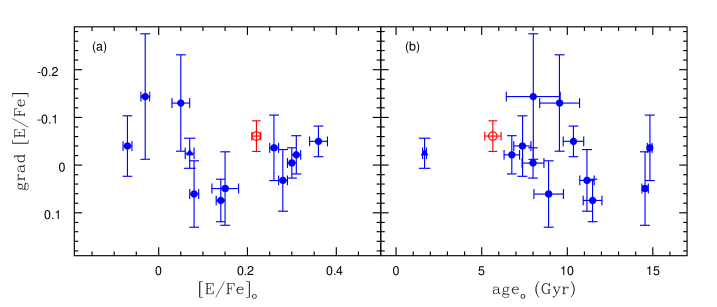
For a sample of early-type galaxies Ferreras & Silk (2002) found a correlation between [E/Fe] gradient and its central value. A steep negative gradient for low [E/Fe] galaxies changes to a steep positive gradient for enhanced [E/Fe] galaxies. Using a simple model of star formation and a standard prescription for the rates of supernovae Type II and Ia, Ferreras & Silk found that negative gradients imply inside-out formation which is suggestive of a dissipative collapse formation. On the other hand, a positive gradient is a sign of outside-in formation which may be a result of a past merger events which induce central star formation in the merger remnant. Our isolated galaxies show statistical insignificant [E/Fe] gradients on average. Furthermore, Fig. 10 shows that there is no obvious correlation between [E/Fe] gradient and its central value or the central age.
4 Discussion
Several galaxies in our isolated sample reveal a number of features such as tidal tails, dust, shells, discy and boxy isophotes and highly rotating central discs (Reda et al. 2004, 2005; Hau & Forbes 2006). These structures indicate recent merger/accretion events during the evolutionary history of these galaxies. Measuring the age of the stellar populations of the isolated galaxies reveals that several galaxies have central young stars which also requires a recent gaseous accretion or merger.
If isolated galaxies formed purely by dissipative collapse we would expect uniformly old stellar ages. We find both young central ages and age gradients in some isolated galaxies. Collapse models (e.g. Carlberg 1984; Chiosi & Carraro 2002; Kawata & Gibson 2003) predict steeper metallicity gradients in more massive galaxies. For the bulk of our sample, with velocity dispersions km/s, we find the opposite behaviour with more massive galaxies have shallower metallicity gradients. A collapse also implies a largely inside-out formation with the inner galaxy regions forming first which predicts a negative [E/Fe] gradient (e.g. Ferreras & Silk 2002). We find isolated galaxies to reveal no overall [E/Fe] gradient. Thus we conclude that pure dissipative collapse can not explain our sample of relatively massive isolated early-type galaxies.
The expectations for stellar population parameters in a hierarchical merger scenario are more varied depending on the gas fraction of the progenitors and their mass ratio (e.g. Kobayashi 2004). Gas-rich mergers are expected to induce central star formation (e.g. Mihos & Hernquist 1996; Springel 2000). The gradients of age and metallicity are predicted to correlate strongly with central young stars that are also metal-rich (Bekki & Shioya 1999). The metallicity gradient is also predicted to be shallower for a merger remnant (e.g. Kobayashi 2004).
The age gradient for the majority of our isolated galaxies (11 out of 13) are found to range from flat to positive. These age gradients are also correlated with the central age which implies that a young burst dominates the luminosity in the central region where it takes place, and thus produces a steep gradient. As these young populations get older and fade, the observed gradient of the luminosity-weighted age becomes shallower. However, two galaxies (NGC 1045 and MCG-02-13-009) show significant negative age gradients. The radial age profile of NGC 1045 reveals a stellar population of intermediate age at and outward, which implies a secondary star formation event induced in the outer regions of the galaxy. That suggests either a late gas accretion or merger with a gas-rich satellite galaxy (Kobayashi 2004). Such accretion may form a star forming ring. Deep imaging of this galaxy reveals strong boxy isophotes and extensive extra tidal light (Reda et al. 2004) which argues in favour of a recent merger. While deep imaging is not available for MCG-02-13-009, its negative age gradient and flat metallicity gradient in the central region is predicted by the simulations of Kobayashi (2004) to be the result of late gas accretion rather than a major merger.
Most of our isolated galaxies (8 out of 13) are found to have negative metallicity gradients, as galaxies with central metal-rich stars tend to have steeper metallicity gradients. The three galaxies NGC 1162, NGC 2865 and NGC 821 have both significant age gradients as well as metallicity gradients, with the young central stellar population also being more metal-rich than the old metal-poor stars in the outer regions.
NGC 1162 has an intermediate central age of 6.8 Gyrs suggesting a secondary star formation event. A major merger of two massive progenitors is expected to produce a more metal-rich stellar population and shallower metallicity gradient than observed. However, a minor merger with a satellite of mass less than 0.2 times that of the primary galaxy is more likely to explain the intermediate central metallicity and the gradient (Kobayashi 2004).
The galaxy NGC 2865 is the youngest (1.7 Gyrs) and most metal-rich ([Z/H]) galaxy of our sample. Its central velocity dispersion of 178 km/s indicates an intermediate mass galaxy. Deep imaging revels a surrounding shell structures (Hau, Carter & Balcells 1999; Reda et al. 2004) and kinematics reveal a kinematically decoupled core in the central 4 arcsec or 6.4 kpc (Hau, Carter & Balcells 1999; Hau & Forbes 2006). The kinematics and stellar population of this galaxy suggest a gas-rich accretion or merger origin for the shell and kinematics structures (Hau et al. 1999). However, the steep metallicity gradient of –0.47 prefers a gas-rich accretion by a metal-rich parent galaxy.
The galaxy NGC 821 has a central stellar population of 5.6 Gyrs old and a high metallicity of [Z/H], which indicates a secondary star burst. Gas accretion or a minor merger would produce a lower central metallicity, while a major merger would have reduced the very steep metallicity gradient of –0.72. In the detailed study of Proctor et al. (2005), NGC 821 is speculated to consume its own gas to fuel a secondary central burst of star formation.
The metallicity gradient of isolated galaxies are found to be steeper for less massive galaxies. This result is consistent with a major merger history for the massive galaxies (e.g. Bekki & Shioya 1999). During the merger process, the high metallicity stars in the centre of the galaxy are transported to the outer regions which dilutes the metallicity gradient (Bekki & Shioya 1999). On the other hand, the induced star formation during the merger at the centre of the merger remnant is expected to maintain the metallicity gradient to some extent. The final metallicity gradient of the merger remnant is shallower than the progenitors and the newly formed central stars will also produce relatively steep age gradients for these galaxies (Kobayashi 2004). The gas-rich merger simulation of Bekki & Shioya (1999) predicts a one-to-one correlation between the age gradient and metallicity gradient. However, our isolated galaxies show a correlation of slope .
Both isolated galaxies, and those in HDEs, show similar age-mass relations as more massive galaxies are older than smaller ones. That suggests either the less massive galaxies have had successive star formation events (bursts induced by mergers) continuing until recent epochs, while more massive galaxies did not suffer such events. Alternatively, all galaxies started forming their stars in a single burst (similar to a dissipative collapse) at the same epoch which stopped earlier in more massive galaxies, while less massive galaxies continue forming new stars for extended epochs. Several mechanisms have been introduced to suppress the star formation processes in more massive galaxies such as a central active galactic nuclei (e.g. Springel, Di Matteo & Hernquist 2005; De Lucia et al. 2006). The dependence of the star formation efficiency on the circular velocity of the galaxy can also delay the star formation in small galaxies relative to more massive galaxies (e.g. De Lucia et al. 2004).
The old galaxies in our sample (NGC 2271, ESO153-G003, ESO218-G002 and MCG-03-26-030) with central age 11 Gyrs show flat age gradients which indicates that all stars are formed at same time at . They also tend to be the most massive galaxies. This can be a result of a single burst of star formation during a rapid collapse of a single cloud (Larson 1974, 1975; Calberg 1984). The observed metallicity gradient of these galaxies () is much less than the predicted gradients of the dissipative collapse models. The major merger scenario can explain the shallow metallicity gradients of these galaxies but not their uniform old populations. Another mechanism such as developing central active galactic nuclei (e.g. Springel, Di Matteo & Hernquist 2005; De Lucia et al. 2006) is necessary to stop any further star formation after the merger. The low metallicity of ESO153-G003 ([Z/H]) suggests progenitors of relatively small size for this galaxy. The galaxy NGC 2271 has the highest metallicity among these galaxies ([Z/H]) with a flat metallicity gradient of. It also shows elongated shape () and a solid body rotation with ( (Hau & Forbes 2006) which may indicate amassive disk progenitor.
The shallow metallicity gradients of the two galaxies NGC 682 and NGC 4240 indicate past major mergers. On the other hand, their uniform luminosity weighted intermediate ages suggest a very small fraction of induced star formation.
The magnitude of the metallicity gradients are found to correlate to the age gradient. The suggested mechanism causing these gradients is that each star formation event will enrich the ISM, followed by radial inflow, causing the subsequent stellar generations at the galaxy centre to be more metal-rich, as well as younger. A natural result of this process is the observed age-metallicity relation. The dynamical effect of supernova feedback is expected to be relatively weaker in more massive galaxies, consequently the star formation rate is more efficient in these galaxies than in less massive ones. The deep potential well of massive galaxies maintains their gas long enough to perform more complete chemical processes to produce higher metallicities (e.g. Arimoto & Yoshii 1987; Edmunds 1990; Matteucci 1994) resulting in the observed mass-metallicity relation.
Independent of the galaxy mass, or the details of the merging process, the observed correlation between the metallicity gradient and its central value can be reproduced by the gas-rich merger simulations of Bekki & Shioya (1999). The results of these models are also consistent with the observed insignificant gradients of [E/Fe] within 1 effective radius of the isolated galaxies.
The parameter [E/Fe]o measures the abundance ratio of the -element to the Fe-peak elements which are predicted to be released to the interstellar medium by supernovae type II and Ia and on different time scales. In that sense, [E/Fe]o is commonly used to quantify the duration of star formation (Worthey, Faber & Gonzalez 1992; Matteucci 1994; Thomas, Greggio & Bender 1999; Thomas et al. 2005). For the isolated galaxies as well as in HDEs, the lower [E/Fe]o of the less massive galaxies points to extended star formation for these galaxies. However, the isolated early-type galaxies tend to have younger ages and lower [E/Fe]o for their central velocity dispersion than their counterparts in HDEs. Furthermore, we also note that isolated galaxies of intermediate ages tend to have lower [E/Fe]o than the galaxies in HDEs. This is expected if the extended star formation is triggered with recent mergers which have stopped in HDEs at higher redshifts but continue to recent epochs for galaxies in low density environments such as our isolated galaxies.
5 Conclusions
Isolated galaxies show a wide range of ages, [Z/H] and [E/Fe] for their central stellar populations. More massive galaxies tend to be older, more metal-rich and more -element enhanced than less massive galaxies in the same sense as galaxies in high density environments. Although isolated galaxies tend to be slightly younger, more metal-rich and lower [E/Fe] for their mass.
The majority of the isolated galaxies in our sample show insignificant gradients of both age and [E/Fe]. Although a correlation between the age gradient and central age indicates the tendency of the newly formed stars to locate closer to the galaxy centre.
The metallicity gradient ranges from very steep to flat. Metallicity gradients are found to correlate with parameters of the central stellar populations such as central metallicity, age and velocity dispersions. Metallicity gradients also show a remarkable correlation with the age gradients.
The formation scenario of a single dissipative collapse cloud can not explain the spatial distribution of the stellar population and kinematic properties found for isolated galaxies. Mergers at different redshifts of progenitors of different mass ratios and gas fractions are needed to reproduce the observed properties of the galaxies.
6 References
Arimoto N., Yoshii Y., 1987, A&A, 173, 23
Bekki K., Shioya Y., 1999, ApJ, 513, 108
Bernardi et al., 2003, AJ, 125, 1882
Bernardi M., Nichol R. C., Sheth R. K., Miller C. J., Brinkmann J.,
2006, AJ, 131, 1288
Brough et al., 2006, supmitted to MNRAS
Carlberg R.G., 1984, Apj, 286, 403
Chiosi C., Carraro G., 2002, MNRAS, 335, 335
Colbert J. W., Mulchaey J. S., Zabludoff A. I., 2001, AJ, 121, 808
Collobert M., Sarzi M., Davies R. L., Kuntschner H., Colless M., 2006,
MNRAS, 370, 1213
De Lucia G., Kauffmann G., White S. D. M., 2004, MNRAS, 349, 1101
De Lucia G., Springel V., White S. D. M., Croton D., Kauffmann G.,
2006, MNRAS, 366, 499
Denicoló G., Terlevich R., Terlevich E., Forbes D. A., Terlevich
A., 2005b, MNRAS, 358, 813
Denicoló G., Terlevich R., Terlevich E., Forbes D. A., Terlevich
A., Carrasco L., 2005a, MNRAS, 356, 1440
Edmunds M. G., 1990, MNRAS, 246, 678
Ferreras I., Silk J., 2002, MNRAS, 336, 1181
Forbes D. A., Sánchez-Blázquez P., Proctor R., 2005, MNRAS,
361, L6
Hau G. K. T., Carter D., Balcells M., 1999, MNRAS, 306, 437
Hau G. K. T., Forbes D. A., 2006, MNRAS, 371, 633
Jarrett T. H., Chester T., Cutri R., Schneider S. E., Huchra J. P.,
2003, AJ, 125, 525
Kawata D., Gibson B. K., 2003, MNRAS, 346, 135
Kelson D. D., Illingworth G. D., Franx M., van Dokkum P.G.,
2006, astro-ph/0606642
Kobayashi C., 2004, MNRAS, 347, 740
Kobayashi C., Arimoto N., 1999, ApJ, 527, 573
Kuntschner H., Lucey J. R., Smith R. J., Hudson M. J., Davies R. L.,
2001, MNRAS, 323, 615
Kuntschner H., Smith R. J., Colless M., Davies R. L., Kaldare R.,
Vazdekis A., 2002, MNRAS, 337, 172
Larson R. B., 1974, MNRAS, 166, 585
Matteucci F, 1994, A&A, 288, 57
Mehlert D., Thomas D., Saglia R. P., Bender R., Wegner G., 2003, A&A,
407, 423
Mihos J. C., Hernquist L., 1996, ApJ, 464, 641
Proctor R. N., Forbes D. A., Beasley M. A., 2004, MNRAS, 355, 1327
Proctor R. N., Forbes D. A., Forestell A., Gebhardt K., 2005,
MNRAS, 362, 857
Proctor R. N., Forbes D. A., Hau G. K. T., Beasley M. A., De
Silva G. M., Contreras R., Terlevich A. I., 2004, MNRAS, 349,
1381
Proctor R. N., Sansom A. E., 2002, MNRAS, 333, 517
Prugniel P., Simien F., 1997, A&A, 321, 111
Reda F. M., Forbes D. A., Beasley M. A., O’Sullivan E. J., Goudfrooij P.,
2004, MNRAS, 354, 851
Reda F. M., Forbes D. A., Hau G. K. T., 2005, MNRAS, 360, 693
Sánchez-Blázquez P., Forbes D. A., Strader J., Brodie J., Proctor R.,
2007, submitted to MNRAS
Sánchez-Blázquez P. Gorgas J., Cardiel N., 2006a, A&A, 457, 823
Sánchez-Blázquez P., Gorgas J., Cardiel N., Gonzalez J. J., 2006b,
A&A, 457, 809
Springel V., 2000, MNRAS, 312, 859
Springel V., Di Matteo T, Hernquist L., 2005, ApJ, 620, L79
Terlevich A. I., Forbes D. A., 2002, MNRAS, 330, 547
Thomas D., Greggio L., Bender R., 1999, MNRAS, 302, 537
Thomas D., Maraston C, Bender R., 2003, MNRAS, 339, 897
Thomas D., Maraston C, Bender R., de Oliveira C. M., 2005, ApJ, 621,
673
Thomas D., Maraston C., Korn A., 2004, MNRAS, 351, L19 (TMK04)
Trager S. C., Worthey G., Faber S. M., Burstein D., Gonzalez J. J., 1998,
ApJS, 116, 1
Vazdekis A., 1999, ApJ, 513, 224
White S. D. M., 1980, MNRAS, 191,1
Worthey G., Faber S. M., Gonzalez J. J., 1992, ApJ, 398, 69
Worthey G., Ottaviani D. L., 1997, ApJS, 111, 377