Chandra and HST observations of gamma-ray blazars: comparing jet emission at small and large scales
Abstract
We present new Chandra and HST data for four gamma-ray blazars selected on the basis of radio morphology with the aim of revealing X-ray and optical emission from their jets at large scales. All the sources have been detected. Spectral Energy Distributions of the large scale jets are obtained as well as new X-ray spectra for the blazar cores. Modeling for each object the core (sub-pc scale) and large-scale (100 kpc) jet SEDs, we derive the properties of the same jet at the two scales. The comparison of speeds and powers at different scales supports a simple scenario for the dynamics and propagation of high power relativistic jets.
1 Introduction
In a unified scenario, relativistic jets originating from the accreting black hole and propagating outwards to kiloparsec scales and beyond must be present in all radio-loud active galactic nuclei (AGN). How these jets form and evolve is not yet known; even intrinsic jet power and composition are only poorly known. Thus jets remain one of the key puzzles of AGN astrophysics (see e.g. Blandford 2001, De Young 2002).
The discovery of X-ray emission from kiloparsec-scale jets – a major
success of Chandra (see Harris & Krawczynski 2006 for a review)
– has provided us with a new tool to probe jet physics. Dozens of
new X-ray jets have now been found (see the updated list at http://hea-www.harvard.edu/XJET/ and references therein), and
associated Hubble Space Telescope (HST) observations have
led to a near doubling of the number of known optical jets (a list can
be found at http://home.fnal.gov/ jester/optjets/}).
The origin of this large-scale emission is probably complex. Extended
X-ray emission from low power (FRI) jets is likely synchrotron
radiation from very high energy electrons connecting smoothly in a
single emission component to the electrons responsible for the radio
emission (e.g., Worrall et al. 2001, Kataoka \& Stawarz 2005). On the
other hand, the spectral energy distributions (SEDs) of the
multifrequency emission from high power jets in quasars generally
require two spectral components, as was the case for the first
discovered extended X-ray jet (PKS 0637-752; Schwartz et
al. 2000). For instance, in the X-ray survey of selected radio jets
by Sambruna et al. (2004) which discovered 34 emission regions in
11/17 jets, only 3 are consistent with a single (power law, or
convex) synchrotron component while for the other emission regions
the SED has a concave shape (see also Schwartz et al 2006). The
‘‘rising’’ X-ray spectral component has been successfully interpreted
in a number of cases as inverse Compton (IC) scattering of boosted
CMB photons by low energy electrons in the jet, implying highly
relativistic bulk motion up to very large scales (Tavecchio et al.
2000, Celotti et al. 2001, Siemiginowska et al. 2002, Sambruna et
al. 2004, 2006a, Cheung 2004, Tavecchio et al. 2004, Schwartz et
al. 2006). At this point, other models cannot be discarded, and it
is also the case that some problems in applying the IC/CMB model to
specific sources have been pointed out (see Stawarz et al. 2004,
Atoyan \& Dermer 2004, Kataoka \& Stawarz 2005, Uchiyama et al. 2006,
Jester et al. 2006, Harris \& Krawczynski 2006 for criticisms and
alternatives). At the same time, the one-zone IC/CMB model, if
correct, has the advantage of involving few physical parameters which
can be constrained by the radio, optical and X-ray emission of
kiloparsec-scale jets, yielding interesting consequences on the
physical state of the plasma in the jet and on their dynamics at
large scales (e.g. Sambruna et al. 2004, 2006a, Marshall et al. 2005,
Schwartz et al. 2006).
At the opposite extreme of spatial scales, the innermost region of
jets is fruitfully investigated through the study of blazars, whose
emission is interpreted as the relativistically amplified non-thermal
continuum produced close to the central engine ($d\sim 0.1$
pc) by a
jet closely aligned to the line of sight (Urry & Padovani
1995). Spectral modeling of the full infrared through -ray
SED (with synchrotron + IC components) yields the electron density
and energy distribution, magnetic field intensity and bulk Lorentz
factor of the flow (with some confidence, as shown by the agreement
between results of different groups; e.g., Ghisellini et al. 1998,
Tavecchio et al. 2002, Kubo et al. 1998, Sikora & Madejski 2001),
allowing us to infer basic global quantities characterizing the jets
quite close to their origin, in particular the kinetic power and the
matter content (e.g., Maraschi & Tavecchio 2003).
Coupling information derived at subparsec- and kiloparsec-scale for the same jet could have great potential to construct a global understanding of powerful extragalactic jets. This approach was first applied to two well known blazars (1510-089 and 1641+399) serendipitously belonging to the sample surveyed with Chandra by Sambruna et al. (2004). The sample had been selected on the basis of radio morphology and brightness in order to search for extended X-ray emission. For both blazars X-ray emission outside the nucleus was detected. The results (Tavecchio et al. 2004, hereafter Paper I) were consistent with a constant bulk Lorentz factor and constant power along the jet and a simple scaling of the electron density and magnetic field intensity, suggesting free expansion of the jet between the subpc (blazar) scale and the (100 kpc) scale of the resolved X-ray knots. Therefore, these results imply that powerful jets are only weakly affected by the environment up to these scales. Note, however, that these findings do not exclude that the terminal portions of the jets can interact more strongly with the environment, dissipating part of their power and decelerating. Indeed, there is evidence (e.g. Georganopoulos & Kazanas 2004; Sambruna et al. 2006a) suggesting that, in some cases, the terminal regions of the jet can be affected by deceleration (possibly due to the cumulative effects of entrainment of external gas; Tavecchio et al. 2006), accompanied by an increase of magnetic field intensity and particle density.
Unfortunately, only very few jets can be studied on both scales. Indeed the best-studied inner jets do not tend to have well studied large-scale jets, precisely because the former are the most closely aligned with the line of sight, which means projected jet lengths are small and the large scale jets must be seen in contrast to the bright, beamed cores. This is why the number of blazars well observed on pc and kpc scales is very small. It is also worth noting that in the case of sources displaying large scale jets but with a weak blazar core, the determination of the parameters characterizing the small scale jet is less robust, due to the presence of a mix of jet and disk emission in the core, especially in the crucial X-ray band (e.g. Sambruna et al. 2006b). With the aim of increasing the number of blazars with multifrequency observations of the jet at large-scales, we proposed Chandra and HST observations of four ray blazars (0208-512, 0954+556, 1229-021 and 2251+158; see Tab.1), showing a radio jet suitable for X-ray imaging. The detection of the blazar in -rays indicates the presence of a strong jet component in the core, generally leading to a more reliable estimate of the small scale jet parameters due to the extended sampling of the SED.
In this paper we report the analysis of Chandra and HST111Based on observations with the NASA/ESA Hubble Space Telescope obtained at the Space Telescope Science Institute, which is operated by the Association of Universities for Research in Astronomy, Incorporated, under NASA contract NAS5-26555. data (Sect. 2), the modeling of the SEDs of the blazar cores and knots in the large scale jet (Sect. 3), the determination of speeds and powers (Sect. 4) and the discussion of the results (Sect. 5). Throughout this work we use the following cosmological parameters: , , .
2 Observations and data analysis
Basic characteristics of the blazars analyzed in this work are reported in Table 1. In the following we report the details of the procedure used to analyze the data. For the quasar 0208-512 we did not obtain the requested Chandra pointing, since it was assigned to the jet survey of Marshall et al (2005). X-ray and radio data for the core for this source are directly taken from Marshall et al. (2005) and Schwartz et al. (2006), while we report only the analysis of our HST pointings.
2.1 Chandra
The sources were observed with Chandra (Weisskopf et al. 2000) with ACIS-S in imaging mode. The journal of observations is reported in Tab.2. The data were collected with the back-illuminated ACIS-S S3 chip in 1/8 sub-array mode to avoid/minimize the pileup of the central AGN source, with a frame time of 0.4 s. Telemetry was in faint mode.
The data were reduced with the standard Chandra pipeline with
the CIAO software (version 3.3) and the most recent available
calibration products (CALDB 2.26), as described in
http://cxc.harvard.edu/. The corrections applied are those
appropriate for the ACIS-S instrument. No high background periods due
to particle-induced flares were present in the datasets.
Events were selected in the 0.3-10 keV interval for both imaging and spectral analyses. The radio and X-ray images were registered assuming that the cores are coincident. Applied shifts are 0.42′′, 0.22′′, 0.32′′ for 0954+556, 1229-021 and 2251+158, respectively, below Chandra aspect uncertainties. The core spectra were extracted in a 1.5′′ region centered on the centroid of the emission. The jet spectra were extracted in circles centered on bright radio features (see below). The background was evaluated in nearby regions devoid of sources. Response matrices are created in the usual fashion; spectra are binned so that each resulting bin has a S/N 3.
2.1.1 Cores
Due to the short frame time the pile-up is negligible in both 0954+556
and 1229-021. Fitting the spectra with a power-law model and free
gives a value consistent with the Galactic column density
(from Dickey & Lockman 1990). We therefore fit the spectra with
fixed galactic and a simple power law. Results are given
in Table 2. 2251+158 is at least a factor of 10 brighter than the
other two targets, and the effects of pile-up cannot be ignored
(pile-up fraction=29%). We use the pileup model in XSPEC
(Davis 2001) to account for the distortion in the spectrum. In this
case we find an slightly in excess of the Galactic value.
These sources have been observed several times in the past in X-rays (Fossati et al. 1998, Wilkes et al. 1994, Siebert et al. 1998, Prieto 1996, Tavecchio et al. 2002, Marshall et al. 2005) with fluxes and spectral parameters consistent with our results.
2.1.2 Jets
Jet knots are quite fainter than the cores and the poor statistics do not allow to measure the X-ray spectral slope. Fluxes listed in Table 3 are derived assuming a power-law spectrum of slope (typical for jet knots, e.g. Sambruna et al. 2006a) and Galactic .
2.2 HST
We observed three of the four blazars with the Advanced Camera for Surveys (ACS) aboard the Hubble Space Telescope in two bands. The remaining source, PKS 1229--021, has existing multi-filter WFPC2 data available from the archive from which Le Brun et al. (1997) already detected optical emission in the jet. For our ACS observations, we observed each target with the F475W and F814W filters (SDSS g and Broad I, respectively, with effective frequencies of Hz and Hz) for one orbit per filter. The Le Brun et al. (1997) data were taken in the F450W and F702W filters, close to standard B and R bands, respectively, with effective frequencies of Hz and Hz.
In 2251+158, Cheung et al. (2005) discovered optical emission from the jet and hot spot from an archival WFPC2 image. The new ACS images (characterized by a better resolution) confirm the detections of knots B and C in the jet (nomenclature from Cheung et al. 2005) and resolve the hot spot into 2 pieces -- this perhaps means that there is a previously unresolved portion of the jet in the ‘‘hot spot’’ as reported in Cheung et al. (2005). Knots A and B are not easily distinguishable from the wings of the badly saturated optical nucleus and we could not obtain any useful photometry of them from the ACS images. Our measurements of the optical jet fluxes in PKS 1229--021 are consistent with those published in Le Brun et al. (1997).
Upper limits of 0.03 Jy (3 , in both the F814W and F475W images) were measured for radio jet knots undetected in the ACS images (0208--512 and 0954+556). In the archival WFPC2 images of PKS 1229--021, the corresponding point sources limits are 0.2 and 0.3 Jy (3 ) in the F702W and F450W images, respectively.
2.3 Radio
For 3 of the 4 targets, we obtained and analyzed radio data from the NRAO222The National Radio Astronomy Observatory is operated by Associated Universities, Inc. under a cooperative agreement with the National Science Foundation. Very Large Array (VLA) archive using standard procedures in AIPS (Bridle & Greisen 1994) and DIFMAP (Shepherd, Pearson & Taylor, 1994). We use published ATCA measurements of PKS 0208--512 from Schwartz et al. (2006).
A single 4.9 GHz image of 0954+556 was analyzed (3.5 min. from program AH170) to set the normalization for its extended radio emission; Reid et al. (1995) measured a radio spectral index for the western jet/lobe complex of =0.9 using data from 0.4--5 GHz and we adopt this value. For PKS 1229--021, matched resolution 4.8 and 15 GHz data originally published by Kronberg et al. (1992) were reanalyzed. We use published measurements and data for the jet of 2251+158 from Cheung et al. (2005). For the latter two targets, we created spectral index maps which show values of 0.7 (PKS 1229-021) and 0.8 (2251+158) for the jet.
2.4 Results: imaging and photometry
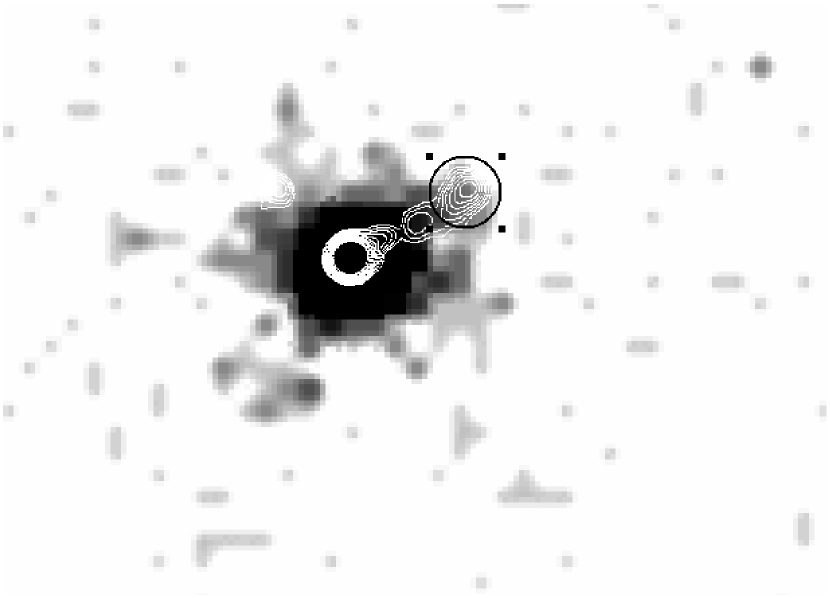
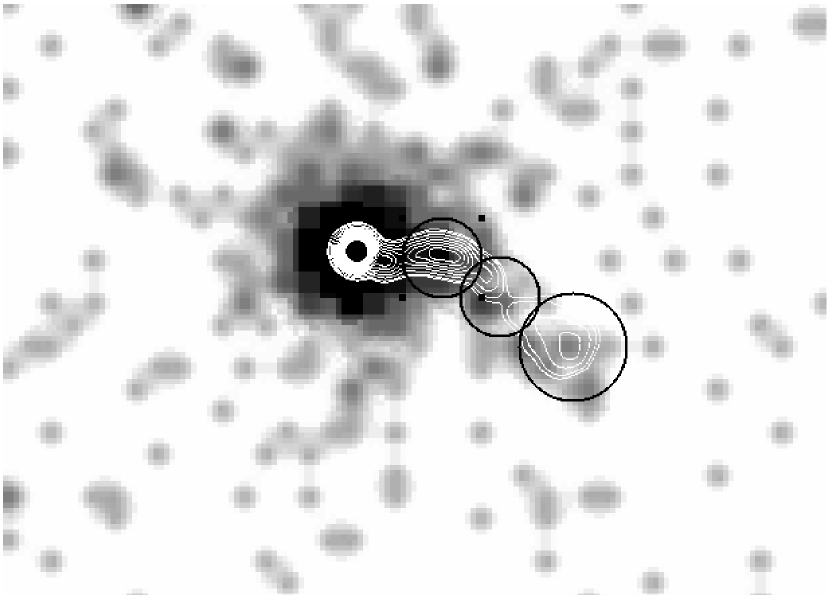
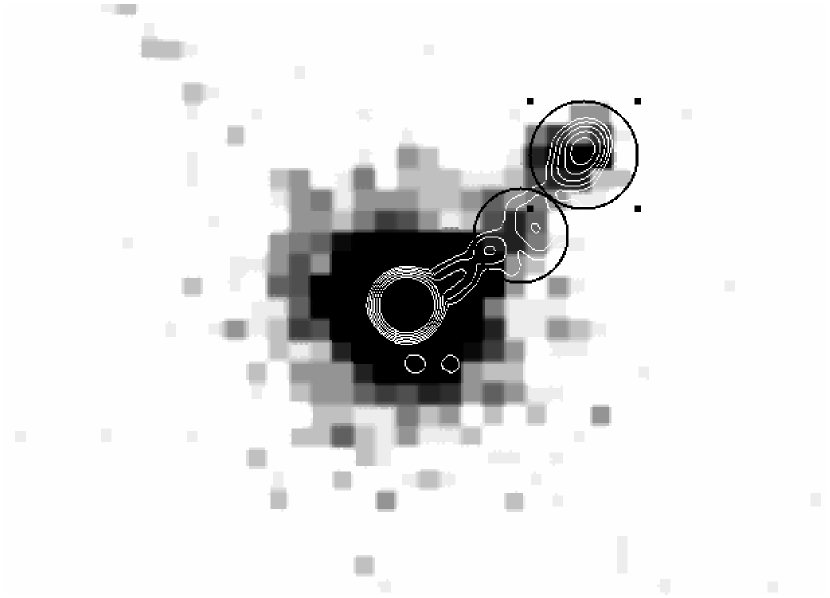
In Figs. 1 (a-c) we show the smoothed X-ray images together with radio
contour overlays. The Chandra images (plotted in logarithmic
scale) have been smoothed with the ftools tool fadapt
using a threshold of 10 counts for 0954+556 and 1229-021 and 20 counts
for 2251+158. Radio contours are plotted logarithmically in steps of
a factor 1.5.
X-ray emission associated to bright radio knots is clearly detected in all the three sources. In 0954+556, due to the limited length of the jet, only the emission associated to the terminal region can be clearly evaluated. In the jet of 1229-021, X-ray emission tracking the radio is clearly visible. The brightness of the X-ray emission decreases and is only barely detected at the terminus. One knot and the hotspot are detected in 2251+158. In Figs we report the circular region used to extract the fluxes. Table 3 summarizes the values of the fluxes measured in the extraction regions centered on bright X-ray features (for which we use an alphabetical nomenclature, starting with the region closest to the core)
3 Modeling the Spectral Energy Distributions
In Fig. 2 (a-d) we report the SEDs, for the cores (upper panels) and emission regions in the large scale jet (lower panels), constructed using data from the historical records and the Chandra and HST data presented in this work. Historical data used to construct the blazar SEDs are taken from the references reported in Tavecchio et al. (2002) for 2251+158 and 0208-512, while those for 0954+556 and 1229-021 are reported in the figure caption. It is worth noting that the blazar nature of 0954+556 and its identification with the EGRET source 3EG J0952+5501 has been recently questioned on the basis of new VLBA images revealing a Medium Symmetric Object morphology (Rossetti et al. 2005; see also Marscher et al. 2002). This is contrary to the typical morphology of blazars, characterized by the presence of strong, compact features. It is therefore more likely that the counterpart to 3EG J0952+5501 is J0957+5522 (Sowards-Emmerd et al. 2003), not 0954+556 as originally suggested by Mattox et al. (2001).
All these blazars are well studied, with several observations in the X-ray band. For clarity we only report the new Chandra data. We stress that all these data are not simultaneous and that the sources can undergo large variations. In this respect, the best example of a variable source among those considered here is 2251+158, which in the spring 2005 displayed a strong outburst, with a large (at least a factor of 3) increase of the optical and the hard X-ray luminosities with respect to quiescent levels (Pian et al. 2006)
3.1 The Blazar region
We modelled the SEDs of the inner jet with the emission model fully described in Maraschi & Tavecchio (2003), considering synchrotron and IC (both Synchrotron Self-Compton and External Compton) radiation.
To reproduce the observed shape of the two humps in the SED we assume that the electron energy distribution is described (between and ) by a smoothed broken power law with indices and below and above the break located at . This purely phenomenological description accounts for the observed shape of the synchrotron and IC components. In the widely assumed diffusive shock acceleration model (e.g. Kirk et al. 1998) or in cases of severe cooling one would expect . However, there are several objects for which this limit seems to be violated, with values as extreme as (e.g., Piconcelli & Guainazzi 2005, Yuan et al. 2005). It is conceivable that, at least in these cases, the electron distribution derives from a (continuously operating) different acceleration mechanism (for possibilities, see e.g, Sikora et al. 2002; Katarzyński et al. 2006).
Relativistic electrons and tangled magnetic field with intensity fill the source, assumed to be a sphere with radius . Relativistic effects are described by the relativistic Doppler factor , given by , where , is the bulk Lorentz factor and is the viewing angle with respect to the blob velocity.
In the SED we also include a black body with luminosity and temperature K, intended to provide a crude representation of the blue bump originating in the accretion disk. A fraction of this radiation is thought to be reprocessed by the Broad Line Region clouds, located at a distance from the central BH, providing the source of the external photons for the EC process.
Estimates of for 0954+556, 1229-021 and 2251+158 are given by Cao & Jiang (1999). For 0208-512 we estimate using the methods of Celotti et al. (1997) and the flux of the MgII line provided by Scarpa & Falomo (1997). Given , we fix assuming the parameter fixed to 0.1, a value consistent with the ratio between and inferred for the (few) radio-loud sources for which a measure of both quantities is simultaneously available (e.g. Sambruna et al. 2006b).
In Fig. 2 (top panels) we report the total emission (solid line) and the separate contributions from the different spectral components (synchrotron: dotted; SSC: short dashed; EC: long dashed; disk: dot-line). In all cases the measured slope of the X-ray continuum appears to be hard but not as extreme as in other powerful blazars (where , e.g. Tavecchio et al. 2002), suggesting an important contribution of the (soft) SSC component which, typically, peaks close to the X-ray band.
The parameters used to calculate the model (reported in Tab. 4) are similar to those usually found for this type of sources (e.g. Maraschi & Tavecchio 2003). In all cases we fix the value of the minimum Lorentz factor of the emitting electrons at , as derived in the case of other powerful blazars (e.g. Maraschi & Tavecchio 2003). However, this was not possible in the case of 0954+556, because of the relatively steep X-ray continuum (), which favors a dominant contribution of the SSC emission and a minor contribution from the (flatter) EC component. In this case we use . However, we recall that the association with the EGRET emission is questionable, and therefore the results for the latter source should be considered with caution. For all the sources we used a value of consistent with the the correlation between and found by Kaspi et al. (2005) and Bentz et al. (2006).
Although the sampling of the SEDs is good only in the case of 2251+158, the data constrain the model parameters sufficiently for the present purpose. In fact the lack of data for some of the objects in the Hz region leaves rather unconstrained a portion of the synchrotron continuum which does not influence the derivation of the most important parameters. In particular, the power critically depends on the number of particles carried by the flow (see Sect. 4), which, due to the steep electron distribution, is constrained by the well defined X-ray emission, dominated by EC radiation from low-energy electrons. Note also that the intensity of the -ray emission determines the radiative output (i.e. the radiative efficency) of the jet but has a limited influence on the derivation of the kinetic power, since -ray emitting electrons do not contribute significantly to the total number of particles.
3.2 The Large-scale jet emission
We model the emission using the IC/CMB model, already used in Paper I. The emitting region is modeled as a sphere with radius , filled by relativistic electrons and tangled magnetic field with intensity , in motion with Lorentz factor . Electrons follow a power-law law in energy with index , , between the extremes and and emit through synchrotron and Inverse Compton emission. For the latter it is assumed that the dominant soft radiation field is the CMB. To uniquely determine the parameters we assume equipartition between the relativistic electrons and the magnetic field (see Sambruna et al. 2006b for a discussion).
The radius assumed in the models corresponds to the angular size of the circular regions used to extract the fluxes. As suggested by the radio images, with this choice we are probably overestimating the actual emitting volume. However, it is easy to show that the derived parameters depends rather weakly on the assumed volume (see e.g. the Appendix of Tavecchio et al. 2006). For instance, with a the volume equal to 1/10 of the value assumed here, both the magnetic field and the Doppler factor would be larger by a factor . Similarly, the impact of the assumed size on the derive power is rather minor. In the case of 0208-512, for which Schwartz et al. (2006) use a rectangular extraction region (and therefore model the emission region as a cylinder), we derive an effective radius, such that the volume of the sphere is equal that of the cylindrical region. Apart for the case of 0208-512 we fix the slope of the electron energy distribution using the radio spectral index derived above (Sect. 2.3). The 0208-512 radio jet spectral index of 0.8 is assumed, as the actual measurements over the short frequency baseline (4.8-8.6 GHz) gave unreliable values (Schwartz et al. 2006). The value of the minimum Lorentz factor of the electrons has been chosen so that the break in the IC continuum is located between the optical and the soft X-ray band. Of course the choice of this value is not unique, since values of in the range 5--30 are usually allowed by the data. A deeper discussion of this point is reported in the next paragraph.
In Fig. 2 (lower panels) we show the synchrotron-IC/CMB spectral models derived assuming the input parameters reported in Tab.5.
For 0954+556 the X-ray flux could only be extracted for the region corresponding to the terminal portion of the jet. As discussed in Tavecchio et al. (2005), also in this case a beamed IC/CMB model appears necessary, however with a Doppler factor lower than typically found for knots in the jet.
For 1229-021 we can model the emission at three different locations along the jet. Interestingly, we can reproduce the SEDs of the three regions decreasing only the value of the Doppler factor (from to ), and maintaining all the other quantities (almost) constant. As well, the clear bending of the jet between regions A and B suggests a change in the (projected) direction of the jet speed. It is tempting to associate this change with an increase of the jet angle, which could simultaneously explain the decrease of the observed beaming (while a ‘‘true’’ deceleration would imply also the increase of both the magnetic field intensity and the particle density).
4 Speed and power
The parameters derived by reproducing the SEDs can be used to infer the bulk Lorentz factor and the total power characterizing the jet. In the case of large scale jets with more than one emission region, we calculate the power and the speed at the region closest to the core. With this choice we avoid the portion of the jet near the terminal region which could be affected by deceleration. For the same reason we do not include 0954+556 in this analysis, since we do not have multi frequency information on emitting regions before the jet terminus.
For both the inner, unresolved region and the (still relativistic) resolved jet, the transported power can be estimated using the expression:333As pointed out in Schwartz et al. (2006), this expression, neglecting the contribution of the pressure, is not completely correct. However, it provides values differing only by a small factor from the correct expression and we can therefore safely use it in this work in which we consider order of magnitude estimates.
| (1) |
(Celotti & Fabian 1993), where is the radius of a cross section of the jet, , , and are the rest frame energy densities of relativistic electrons, protons, and magnetic field, respectively. In the following we assume a plasma composition of one proton per electron (see e.g. Paper I for a discussion of this choice). With this choice the total power is largely dominated by the kinetic power associated to the protons.
As already discussed in Paper I, in order to derive from the Doppler factor, directly provided by the emission models, the bulk Lorentz factor of the flow, an observing angle has to be assumed. For the blazar jet, as in Paper I, we assume that the value of the angle falls in the range to 0, where is the maximum angle allowed by a given value of the Doppler factor. The corresponding range covered by the bulk Lorentz factor will be . In the case of the large scale jet, instead, due to the larger uncertainty in the derived Doppler factor (see below) for simplicity we decided to assume in all the cases the maximum angle .
A meaningful comparison between between jet speeds and powers at different locations in the same jet requires an estimate of the uncertainties affecting the physical quantities derived by the spectral fitting. In the case of the blazar cores, the uncertainties in the extended multiwavelength coverage of the SEDs generally constrains the parameters of the model adequately. We therefore compute speeds and powers fixing the parameters derived from the spectral modeling (Tab.4) and consider only the uncertainty in the Lorentz factor due to the unknown viewing angle, giving for the range . For the large scale jets, the poor spectral coverage allows relatively large uncertainties in all the derived quantities. In particular, the data do not strongly constrain the value of . However, it is relatively easy to assess these uncertainties since the IC/CMB model allows a simple analytical formulation (Schwartz et al. 2006, Tavecchio et al. 2006). Using the analytical relations reported in Tavecchio et al. (2006) we calculate the parameters , and , varying and within the range allowed by the data and taking also into account the error on the measured fluxes, dominated by the X-ray one (for 0208-512, for which uncertainties on the fluxes are not provided in Schwartz et al. 2006, we assume a typical error of 25% on the X-ray flux). For 1229-021 and 2251+158 is varied from to while for 0208-512 the (conservative) range 0.5--0.8 is considered. The value of is free to vary in the range 1-100444Note that not all the combinations of the parameters are acceptable, since constraints on the position of the low-energy break of the IC component translates into limits for and . In fact, the break of the IC component, approximately given by , must be located between the optical-UV band and the soft X-ray band, i.e. we keep only the combination of the parameters satisfying .. We characterize the uncertainty on and taking the range spanned by the two parameters in all the possible realizations.
The results are reported in Table 6. We also report the results for the two blazars already studied in Paper I (1510-089 and 1641+399), for which we recalculate the uncertainties accordingly to the procedure discussed above. A comparison between Lorentz factors and powers determined for the the blazar core (inner) and the large jet knots (outer) is reported in Fig.3, in which the rectangles include all the values of (left) and (right) allowed by the data. In this plot we also report the limits derived for the two sources analyzed in Paper I, 1510-089 and 1641+399, in which the uncertainties have been recalculated using the same procedure above.
The plots show that, on average, the Lorentz factor and the power derived at the two scales are in agreement, confirming and extending the results of Paper I. However, the large uncertainty, affecting in particular the derived power (in particular the values of , spanning in some cases a range larger than a decade), prevent to draw a stronger conclusion.
5 Discussion
The possibility to simultaneously probe the inner and outer part of a jet offers the unique opportunity to follow its structure over many orders of magnitude in distance from the central engine. The analysis presented here confirms and extends the previous findings of Paper I, obtained for a smaller sample of two sources, indicating the consistency of speeds and powers independently estimated at the two scales. Similar results, showing the consistency of the speeds independently inferred at VLBI scale and at large scale, have been reported by Jorstad & Marscher (2004, 2006).
Admittedly, the present results are based on specific assumptions regarding the origin of the large scale jet emission and the conditions in the jet (i.e. equipartition). In particular, the estimate of the power critically relies on the determination of the number of protons in the jet which is estimated from the low energy end of the relativistic electron distribution i.e. from the minimum Lorentz factor,. In fact is well constrained in the framework of the IC/CMB model through the discontinuity between the optical and X-ray emission.
If the X-ray emission of the large scale jet is interpreted as synchrotron radiation from a second population of relativistic electrons (e.g. Stawarz et al. 2004, Uchiyama et al. 2006) cannot be constrained since the low-energy electrons emit well below the observed radio frequencies. In this case, lower jet powers can be derived simply through a choice of a large value for . The lower requirement for the power is sometimes used as an argument supporting the synchrotron interpretation against the IC/CMB model, (see e.g. Atoyan & Dermer 2004): in this case one should assume that most of the jet power is dissipated in the propagation of the jet from the small to the large scale
Also within the IC/CMB interpretation, in some cases, there is complementary evidence suggesting that before its termination the jet suffers important deceleration, marked by a decreasing Doppler factor and the increase of magnetic field intensity and particle density (Georganopoulos & Kazanas 2004, Sambruna et al. 2006a). The deceleration can be plausibly induced by entrainment of external gas (Tavecchio et al. 2006), whose effects become important only when the cumulative amount of entrained gas reaches some appreciable level. Moreover, the mixing layer thought to permit the entrainment of the gas into the jet is believed to grow along the jet (e.g. De Young 2006). Therefore, entrainment can coexist with the evidence of the conservation of power and speed, since the deceleration is expected to become important only after some distance along the jet. Therefore all these elements can be unified in a simple scenario, in which very powerful jets evolve freely, almost unperturbed, up to large (100 kpc) scale, conserving the original power and speed. In some cases (depending on external conditions and jet power), the entrained mass becomes dynamically important before the jet end, leading to the inferred deceleration (e.g. the case of 1136-135, Tavecchio et al. 2006).
The detection of resolved X-ray emission from the jets associated with the -loud blazars studied in this work adds to previous evidence that resolved X-ray emission from radio-loud quasars with bright radio jets is common. It is interesting to note that large-scale X-ray emission has been detected in all the -ray blazars with a radio jet long enough to be resolvable and observed by Chandra. The present list comprises 11 objects (10 if we exclude the possible misidentified 0954+556): besides the 2 blazars discussed earlier and the 4 studied here, it includes 3C273 (Sambruna et al. 2001, Marshall et al. 2001), 3C279 (Marshall et al. 2003), 0827+243 (Jorstad & Marscher 2004), 1127-145 (Siemiginowska et al. 2002) and 1222+216 (Jorstad & Marscher 2006). All show conspicuous X-ray emission, with a detection rate of 100%, even larger than that for sample containing other kinds of quasars (Sambruna et al. 2004, Marshall et al. 2005). This fact is consistent with the idea that beaming plays an important role in determining the observed X-ray emission (i.e. large scale jets associated to blazars are likely aligned with the observer), although the small numbers involved prevent a firm statistical conclusion. GLAST (scheduled to be operative at the end of 2007) is expected to greatly enlarge the number of known -ray radio-loud AGNs. Likely, most of the sources associated to large scale jets with known X-ray emission will be detected in the -ray band, allowing to better characterize the SED of the core and therefore increasing the number of object suitable for the study.
References
- Atoyan & Dermer (2004) Atoyan, A., & Dermer, C. D. 2004, ApJ, 613, 151
- Bentz et al. (2006) Bentz, M. C., Peterson, B. M., Pogge, R. W., Vestergaard, M., & Onken, C. A. 2006, ApJ, 644, 133
- Blandford (2001) Blandford, R. D. 2001, ASP Conf. Ser. 250: Particles and Fields in Radio Galaxies Conference, 250, eds. Laing, R.A & Blundell, K.M., 487
- Bloom et al. (1994) Bloom, S. D., Marscher, A. P., Gear, W. K., Terasranta, H., Valtaoja, E., Aller, H. D., & Aller, M. F. 1994, AJ, 108, 398
- Bridle & Greisen (1994) Bridle, A. H. & Greisen, E. W. 1994, The NRAO AIPS Project -- a Summary (AIPS Memo 87; Charlottesville: NRAO)
- Cao & Jiang (1999) Cao, X., & Jiang, D. R. 1999, MNRAS, 307, 802
- Celotti & Fabian (1993) Celotti, A., & Fabian, A. C. 1993, MNRAS, 264, 228
- Celotti et al. (1997) Celotti, A., Padovani, P., & Ghisellini, G. 1997, MNRAS, 286, 415
- Celotti, Ghisellini, & Chiaberge (2001) Celotti, A., Ghisellini, G., & Chiaberge, M. 2001, MNRAS, 321, L1
- Cheung (2004) Cheung, C. C. 2004, ApJ, 600, L23
- Cheung et al. (2005) Cheung, C. C., Wardle, J. F. C., & Chen, T. 2005, ApJ, 628, 104
- Davis (2001) Davis, J. E. 2001, ApJ, 562, 575
- de Young (2002) De Young, D. S. 2002, The physics of extragalactic radio sources (Chicago: University of Chicago Press)
- De Young (2006) De Young, D. 2006, Astronomische Nachrichten, 327, 231
- Dickey & Lockman (1990) Dickey, J. M., & Lockman, F. J. 1990, ARA&A, 28, 215
- Fossati et al. (1998) Fossati, G., Maraschi, L., Celotti, A., Comastri, A., & Ghisellini, G. 1998, MNRAS, 299, 433
- Gear et al. (1994) Gear, W. K., et al. 1994, MNRAS, 267, 167
- Georganopoulos & Kazanas (2004) Georganopoulos, M., & Kazanas, D. 2004, ApJ, 604, L81
- Ghisellini et al. (1998) Ghisellini, G., Celotti, A., Fossati, G., Maraschi, L., & Comastri, A. 1998, MNRAS, 301, 451
- Harris & Krawczynski (2006) Harris, D. E., & Krawczynski, H. 2006, ARA&A, 44, 463
- Jester et al. (2006) Jester, S., Harris, D. E., Marshall, H. L., & Meisenheimer, K. 2006, ApJ, 648, 900
- Jorstad & Marscher (2004) Jorstad, S. G., & Marscher, A. P. 2004, ApJ, 614, 615
- Jorstad & Marscher (2006) Jorstad, S. G., & Marscher, A. P. 2006, Astronomische Nachrichten, 327, 227
- Kaspi et al. (2005) Kaspi, S., Maoz, D., Netzer, H., Peterson, B. M., Vestergaard, M., & Jannuzi, B. T. 2005, ApJ, 629, 61
- Kataoka & Stawarz (2005) Kataoka, J., & Stawarz, Ł. 2005, ApJ, 622, 797
- Katarzyński et al. (2006) Katarzyński, K., Ghisellini, G., Mastichiadis, A., Tavecchio, F., & Maraschi, L. 2006, A&A, 453, 47
- Kirk et al. (1998) Kirk, J. G., Rieger, F. M., & Mastichiadis, A. 1998, A&A, 333, 452
- Kronberg et al. (1992) Kronberg, P. P., Perry, J. J., & Zukowski, E. L. H. 1992, ApJ, 387, 528
- Kubo et al. (1998) Kubo, H., Takahashi, T., Madejski, G., Tashiro, M., Makino, F., Inoue, S., & Takahara, F. 1998, ApJ, 504, 693
- Kühr et al. (1981) Kühr, H., Witzel, A., Pauliny-Toth, I. I. K., & Nauber, U. 1981, A&AS, 45, 367
- Le Brun et al. (1997) Le Brun, V., Bergeron, J., Boisse, P., & Deharveng, J. M. 1997, A&A, 321, 733
- Maraschi & Tavecchio (2003) Maraschi, L., & Tavecchio, F. 2003, ApJ, 593, 667
- Marscher et al. (2002) Marscher, A. P., Jorstad, S. G., Mattox, J. R., & Wehrle, A. E. 2002, ApJ, 577, 85
- Marshall et al. (2005) Marshall, H. L., et al. 2005, ApJS, 156, 13
- Marshall et al. (2003) Marshall, H. L., Cheung, T., Canizares, C. R., & Fang, T. 2003, Bulletin of the American Astronomical Society, 35, 760
- Marshall et al. (2001) Marshall, H. L., et al. 2001, ApJ, 549, L167
- Mattox et al. (2001) Mattox, J. R., Hartman, R. C., & Reimer, O. 2001, ApJS, 135, 155
- Pian et al. (2005) Pian, E., Falomo, R., & Treves, A. 2005, MNRAS, 361, 919
- Pian et al. (2006) Pian, E., et al. 2006, A&A, 449, L21
- Pica et al. (1988) Pica, A. J., Smith, A. G., Webb, J. R., Leacock, R. J., Clements, S., & Gombola, P. P. 1988, AJ, 96, 1215
- Piconcelli & Guainazzi (2005) Piconcelli, E., & Guainazzi, M. 2005, A&A, 442, L53
- Prieto (1996) Prieto, M. A. 1996, MNRAS, 282, 421
- Reid et al. (1995) Reid, A., Shone, D. L., Akujor, C. E., Browne, I. W. A., Murphy, D. W., Pedelty, J., Rudnick, L., & Walsh, D. 1995, A&AS, 110, 213
- Rossetti et al. (2005) Rossetti, A., Mantovani, F., Dallacasa, D., Fanti, C., & Fanti, R. 2005, A&A, 434, 449
- Sambruna et al. (2006) Sambruna, R. M., Gliozzi, M., Donato, D., Maraschi, L., Tavecchio, F., Cheung, C. C., Urry, C. M., & Wardle, J. F. C. 2006a, ApJ, 641, 717
- Sambruna et al. (2006) Sambruna, R. M., Gliozzi, M., Tavecchio, F., Maraschi, L., & Foschini, L. 2006b, ApJ, 652, 146
- Sambruna et al. (2004) Sambruna, R. M., Gambill, J. K., Maraschi, L., Tavecchio, F., Cerutti, R., Cheung, C. C., Urry, C. M., & Chartas, G. 2004, ApJ, 608, 698
- Sambruna et al. (2001) Sambruna, R. M., Urry, C. M., Tavecchio, F., Maraschi, L., Scarpa, R., Chartas, G., & Muxlow, T. 2001, ApJ, 549, L161
- Scarpa & Falomo (1997) Scarpa, R., & Falomo, R. 1997, A&A, 325, 109
- Schwartz et al. (2006) Schwartz, D. A., et al. 2006, ApJ, 640, 592
- Schwartz et al. (2000) Schwartz, D. A., et al. 2000, ApJ, 540, L69
- Shepherd, Pearson, & Taylor (1994) Shepherd, M. C., Pearson, T. J., & Taylor, G. B. 1994, BAAS, 26, 987
- Siebert et al. (1998) Siebert, J., Brinkmann, W., Drinkwater, M. J., Yuan, W., Francis, P. J., Peterson, B. A., & Webster, R. L. 1998, MNRAS, 301, 261
- Siemiginowska et al. (2002) Siemiginowska, A., Bechtold, J., Aldcroft, T. L., Elvis, M., Harris, D. E., & Dobrzycki, A. 2002, ApJ, 570, 543
- Sikora et al. (2002) Sikora, M., Błażejowski, M., Moderski, R., & Madejski, G. M. 2002, ApJ, 577, 78
- Sikora & Madejski (2001) Sikora, M., & Madejski, G. 2001, American Institute of Physics Conference Series, 558, 275
- Sowards-Emmerd et al. (2003) Sowards-Emmerd, D., Romani, R. W., & Michelson, P. F. 2003, ApJ, 590, 109
- Stawarz et al. (2004) Stawarz, Ł., Sikora, M., Ostrowski, M., & Begelman, M. C. 2004, ApJ, 608, 95
- Stickel et al. (1994) Stickel, M., Meisenheimer, K., & Kühr, H. 1994, A&AS, 105, 211
- Tavecchio et al. (2000) Tavecchio, F., Maraschi, L., Sambruna, R. M., & Urry, C. M. 2000, ApJ, 544, L23
- Tavecchio et al. (2002) Tavecchio, F., et al. 2002, ApJ, 575, 137
- Tavecchio et al. (2004) Tavecchio, F., Maraschi, L., Sambruna, R. M., Urry, C. M., Cheung, C. C., Gambill, J. K., & Scarpa, R. 2004, ApJ, 614, 64 (Paper I)
- Tavecchio et al. (2005) Tavecchio, F., Cerutti, R., Maraschi, L., Sambruna, R. M., Gambill, J. K., Cheung, C. C., & Urry, C. M. 2005, ApJ, 630, 721
- Tavecchio et al. (2006) Tavecchio, F., Maraschi, L., Sambruna, R. M., Gliozzi, M., Cheung, C. C., Wardle, J. F. C., & Urry, C. M. 2006, ApJ, 641, 732
- Tornikoski et al. (1996) Tornikoski, M., et al. 1996, A&AS, 116, 157
- Urry & Padovani (1995) Urry, C. M., & Padovani, P. 1995, PASP, 107, 803
- Uchiyama et al. (2006) Uchiyama, Y., et al. 2006, ApJ, 648, 910
- Weisskopf et al. (2000) Weisskopf, M. C., Tananbaum, H. D., Van Speybroeck, L. P., & O’Dell, S. L. 2000, Proc. SPIE, 4012, 2
- Wilkes et al. (1994) Wilkes, B. J., Tananbaum, H., Worrall, D. M., Avni, Y., Oey, M. S., & Flanagan, J. 1994, ApJS, 92, 53
- Worrall et al. (2001) Worrall, D. M., Birkinshaw, M., & Hardcastle, M. J. 2001, MNRAS, 326, L7
- Yuan et al. (2005) Yuan, W., Fabian, A. C., Celotti, A., McMahon, R. G., & Matsuoka, M. 2005, MNRAS, 358, 432
Figure Captions
X-ray and radio images of 0954+556, 1229-021 and 2251+158. Clearly, X-rays and radio knots in the jets roughly coincide.
Spectral Energy Distributions for cores (upper panel, non-simultaneous data) and jet features (lower panel) of the sources discussed in the text. Historical data are taken from: Kühr et al. (1981), Bloom et al. (1994), Gear et al. (1994), Pian, Falomo & Treves (2005) and NED for 0954+556; Kühr et al. (1981), Tornikoski et al. (1996), Stickel et al. (1994), Pica et al. (1988), Pian, Falomo & Treves (2005) and NED for 1229-021. References for the SED of 2251+158 and 0208-512 are reported in Tavecchio et al. (2002). SEDs of jet knots show the typical two component structure, well explained by the IC/CMB model. Note that HST data, although mostly non-detections, provide very important limits that prevent a single-component interpretation of the SED.
Comparison between the jet Lorentz factor (left) and the jet power (right) independently evaluated for the core and the kpc-scale jet. Together with the sources discussed in the paper we also report the results for 1510-089 and 1641+399 adapted from Paper I. The jet speed appears roughly constant, while the jet power could be constant, although the large uncertainties prevent a firm conclusion.
| Source | ||||
|---|---|---|---|---|
| Jy | mJy | cm-2 | ||
| 0208-512 (PKS 0208-512) | 1.003 | 2.1 | 384 | 2.94 |
| 0954+556 (4C+55.17) | 0.901 | 1.6 | 91 | 0.90 |
| 1229-021 (4C-02.55) | 1.045 | 0.6 | 218 | 2.28 |
| 2251+158 (3C454.3) | 0.86 | 10.9 | 276 | 6.50 |
| Source | Date | Seq. | Exp. time | d.o.f. | |||
|---|---|---|---|---|---|---|---|
| ksec | 1020 cm-2 | erg cm-2 s-1 | |||||
| 0954+556 | 6/16/2004 | 700924 | 34.4 | 1.92 | fix | 0.380.02 | 1.17/301 |
| 1229-021 | 4/18/2004 | 700923 | 18.3 | 1.61 | fix | 1.050.03 | 1.09/151 |
| 2251+158 | 8/4/2004 | 700925 | 16.4 | 1.63 | 9.4 | 12.9 | 0.97/412 |
| Source | knot | ||||
|---|---|---|---|---|---|
| mJy | Jy | Jy | nJy | ||
| 0208-512 | R1 | 12.8a | 3.3 | ||
| R2 | 25.5a | 4.7 | |||
| 0954+556 | A (HS) | 798 | 0.3 | ||
| 1229-021 | A | 10711 | 8.5 | ||
| B | 19 2 | 1.1 | |||
| C (HS?) | 394 | 1.3 | |||
| 2251+158 | A | 444 | 0.230.04 | 0.080.03 | 6.01.4 |
| B (HS) | 21622 | 0.620.04 | 0.430.06 | 6.01.4 |
| Source | ||||||||||
|---|---|---|---|---|---|---|---|---|---|---|
| cm | G | cm-3 | erg s-1 | cm | ||||||
| 0208-512 | 1.5 | 2.5 | 18 | 150 | 1 | 1.6 | 3.8 | 2.7 | 4.8 | |
| 0954+556 | 1.5 | 2.5 | 12 | 100 | 1.5 | 2 | 3.5 | 0.9 | 3.3 | |
| 1229-021 | 2 | 3.2 | 10 | 200 | 1 | 1.4 | 3.5 | 4.5 | 7.5 | |
| 2251+158 | 4 | 1.8 | 12 | 115 | 2 | 2 | 3.4 | 4 | 9.5 |
| Source | Knot | n | B | K | ||||
|---|---|---|---|---|---|---|---|---|
| G | cm-3 | cm | ||||||
| 0208-512 | R1a | 2.6 | 8 | 8 | 11.8 | 10 | 3 | 1.8 |
| R2a | 2.6 | 9 | 15 | 11 | 10 | 3 | 1.8 | |
| 0954+556 | A | 2.8 | 38 | 450 | 3.8 | 20 | 1 | 1.9 |
| 1229-021 | A | 2.4 | 10 | 10 | 8.6 | 25 | 4 | 2.2 |
| B | 2.4 | 10 | 8 | 6 | 25 | 4 | 2.2 | |
| C | 2.4 | 10 | 8.5 | 5.4 | 20 | 4 | 2.9 | |
| 2251+158 | A | 2.5 | 7 | 5 | 10 | 14 | 5 | 2.3 |
| B | 2.6 | 14.5 | 20 | 8 | 7 | 3 | 2.83 |
| Source | ||||
|---|---|---|---|---|
| erg/s | ||||
| 0208-512 | inner | 18 | 18--9 | 2.2--0.55 |
| outer | 11.8--5.5 | 11.8--5.5 | 7.9--0.16 | |
| 1229-021 | inner | 10 | 10--5 | 4.8--1.2 |
| outer | 7.9--4.7 | 7.9--4.7 | 16--1 | |
| 1510-089a | inner | 19 | 19--9.5 | 5--1.25 |
| outer | 16.7--10 | 16.7--10 | 2.8--0.1 | |
| 1641+399a | inner | 9.7 | 9.7--5 | 1.2--0.3 |
| outer | 7.1--4.5 | 7.1--4.5 | 0.5--0.1 | |
| 2251+158 | inner | 12 | 12--6 | 25--6.2 |
| outer | 7.7--5.3 | 7.7--5.3 | 12--0.75 |