Spectral Energy Distributions of Hard X-ray selected AGNs in the XMDS Survey
Abstract
We present the spectral energy distributions (SEDs) of a hard X-ray selected sample. The sample contains 136 sources with F2-10keV10-14 and 132 are AGNs. The sources are detected in a 1 deg2 area of the XMM-Newton-Medium Deep Survey where optical data from the VVDS, CFHTLS surveys, and infrared data from the SWIRE survey are available. Based on a SED fitting technique we derive photometric redshifts with (1+)=0.11 and 6% of outliers and identify AGN signatures in 83% of the objects. This fraction is higher than derived when a spectroscopic classification is available. The remaining 17% of AGNs shows star-forming galaxy SEDs (SF class). The sources with AGN signatures are divided in two classes, AGN1 (33%) and AGN2 (50%). The AGN1 and AGN2 classes include sources whose SEDs are fitted by type 1 and type 2 AGN templates, respectively. On average, AGN1s show soft X-ray spectra, consistent with being unabsorbed, while AGN2s and SFs show hard X-ray spectra, consistent with being absorbed. The analysis of the average SEDs as a function of X-ray luminosity shows a reddening of the IR SEDs, consistent with a decreasing contribution from the host galaxy at higher luminosities. The AGNs in the SF classes are likely obscured in the mid-infrared, as suggested by their low ratios. We confirm the previously found correlation for AGNs between the radio luminosity and the X-ray and the mid-infrared luminosities. The X-ray-radio correlation can be used to identify heavily absorbed AGNs. However, the estimated radio fluxes for the missing AGN population responsible for the bulk of the background at 10 keV are too faint to be detected even in the deepest current radio surveys.
1 Introduction
AGNs are mostly found in X-ray surveys where they represent the majority of the detected population. However, some AGNs are missed even in the deepest X-ray observations, e.g. the Chandra Deep Surveys, CDFN (Brandt et al., 2001; Barger et al., 2002) and CDFS (Giacconi et al., 2002; Rosati et al., 2002). The existence of a large population of AGNs that is still undetected, even in the deepest X-ray surveys, is suggested by the unresolved X-ray background (Worsley et al., 2005) and by the discovery of AGNs not detected at X-ray energies, but identified at radio and infrared wavelengths (Polletta et al., 2006; Higdon et al., 2005; Donley et al., 2005). Multi-wavelength observations of AGNs are necessary to make a census of AGNs and to fully characterize them.
Current facilities and projects permit to study large AGN samples throughout the entire wavelength spectrum, from radio wavelengths to X-ray energies. Several wide and deep multi-wavelength surveys are currently being performed providing enough area, coverage and sensitivity to sample the multi-wavelength properties of AGNs. A difficult task that multi-wavelength surveys need to face is the identification of AGN. AGNs usually represent only a small fraction of sources compared to the population detected at optical and IR wavelengths and their properties can be elusive. Obscured AGNs can be elusive because their optical emission resembles that of normal galaxies and therefore they cannot be identified by the color-selection techniques used for QSOs (e.g. Schmidt & Green 1983), or because their spectra do not show any AGN signature. Their IR emission can be dominated by PAH features, typical of star-forming galaxies, instead of continuum emission from hot dust. Radio observations reveal the radio-loud population of obscured AGNs (e.g. radio galaxies), but this comprises only a small fraction, 10%, of the total AGN population. A hard X-ray selection fails to detect the luminous narrow-line AGNs in the numbers predicted by some models of the CXRB.
In order to obtain a complete picture of the AGN population, selection biases need to be taken into account. The fraction of AGNs missed in observations in narrow energy windows, e.g. X-rays, infrared, or optical, is not well known. Moreover, the dispersion in the spectral energy distributions (SEDs) of all kind of AGNs needs to be well characterized to evaluate which and what fraction of AGNs are missed in a wavelength window and detected in another because of the unmatched depths of the observations at different wavelengths. The SEDs are also important for evolutionary models (Treister et al., 2004; Silva et al., 2004; Xu et al., 2003; Ballantyne et al., 2006), and to estimate the contribution of accretion to the cosmic backgrounds.
In this work, we characterize the SEDs of a sample of AGNs selected in the hard X-rays and investigate how they vary as a function of X-ray absorption, luminosity, redshift, and host galaxy contribution. A selection in the hard X-rays minimizes the bias against absorbed AGNs compared to samples selected at soft or broad-band X-ray energies. Our analysis is based on the sources detected by XMM-Newton in a 1 region of the XMM-Newton Medium Deep Survey (XMDS; Chiappetti et al., 2005, , hereinafter Paper I) in the XMM-Large Scale Survey field (XMM-LSS; Pierre et al., 2004, 2007). This region has also been observed as part of the Spitzer Wide-Area Infrared Extragalactic Survey (SWIRE) (Lonsdale et al., 2003) legacy program, of the VIMOS VLT Deep Survey (VVDS; McCracken et al., 2003; Le Fèvre et al., 2004), and of the Canada-France Hawaii Telescope Legacy “Deep” (D1) Survey. The available multi-wavelength data set, the source catalog, and the X-ray observations and data are summarized in Section 2 and described in detail in a companion paper (Tajer et al., 2007, hereinafter Paper II). Here, we present the technique used to classify the SEDs and to estimate photometric redshifts (Section 3). We divide the sample in three main AGN classes based on their SEDs: AGN1, AGN2, and star-forming (SF) like AGNs. The average properties of the SEDs of the three AGN classes are described in Section 4. Luminosities and absorption are estimated and their role in shaping the observed SEDs are discussed in Section 5. The relationship between the X-ray and the mid-IR luminosities is investigated in Section 6, and the variations of the mid-IR over X-ray luminosity ratio as a function of X-ray luminosity and AGN class are discussed in Section 6. The average SEDs of the three classes regrouped by X-ray luminosity are discussed in Section 7. The analysis of the AGN IR colors compared with their luminosity, redshift and SED classification is presented in Section 8. For a sub-set of sources, radio data are also available. The known radio-IR and radio-X-ray correlations for AGNs and normal galaxies are compared with our data in Section 9. Our results are discussed in Section 10, and summarized in Section 11.
Throughout the paper, we adopt a flat cosmology with H0 = 71 , =0.27 and =0.73 (Spergel et al., 2003). For brevity, we refer to the sources in the sample by their XMDS sequence number (XMDS seq). The names of the sources, complying the IAU standard, along with the associated identifiers, are reported in Table 1. We use the terms red and blue to describe the broad-band SED shape, where red and blue mean, respectively, increasing and decreasing fluxes, in , at longer wavelengths. Fluxes refer to observed, not absorption or k-corrected values, unless specified otherwise. The term absorbed refers to X-ray sources with effective column densities 1022, and obscured to sources with red optical and IR spectra implying dust extinction. The X-ray luminosity refers to the rest-frame broad band (0.5–10 keV) luminosity corrected for intrinsic absorption, unless specified otherwise. We use the terms type 1 and type 2 AGNs for AGNs with broad and narrow optical emission lines, respectively, in their optical spectra. We introduce a new nomenclature for the broad-band SED classification: AGN1, AGN2, and SF. The term AGN1 refers to an SED that is fitted by a type 1 AGN template, the term AGN2 refers to an SED that is fitted by a type 2 AGNs or composite template, and the term SF, which stands for star-forming, refers to an SED that is fitted by a star-forming galaxy template, like spirals and starburst galaxies. Although the templates are classified on the basis of their optical spectral properties, we do not expect a perfect match between the SED classification and the properties of the optical spectra. The SED classification is more indicative of the main emitting components dominating at optical and IR wavelengths rather than of their optical spectra. Moreover, optical spectra can be affected by host galaxy dilution (Moran et al., 2002), obscuration (Barger et al., 2001; Rigby et al., 2006), instrumental and observational limitations, e.g. the lack of emission lines for sources in certain redshift ranges.
2 Sample and multi-wavelength data set
The sample studied in this work includes 136 sources detected at 3 in the 2–10 keV X-ray band, corresponding to 10-14 , in a 1 deg2 region of the XMDS. The XMDS consists of 19 XMM-Newton pointings of 20 ksec nominal exposure covering a contiguous area of about 2.6 deg2. The XMDS survey is complete to a 2–10 keV flux of 910-14 (Paper I). The 1 deg2 area chosen for this study is centered at , and (see Paper II for the layout of the selected field on the entire XMDS area) and benefits from a wealth of observations from various surveys: XMM-Newton data from the XMM-LSS Survey (Pierre et al., 2004, 2007); optical multi-band broad photometric data from the VIMOS VLT Deep Survey (VVDS; McCracken et al., 2003; Le Fèvre et al., 2004), and from the Canada-France Hawaii Telescope Legacy “Wide” (W1) and “Deep” (D1) Surveys (CFHTLS111http://www.cfht.hawaii.edu/Science/CFHTLS/); near-infrared broad band photometric data from the UKIRT Infrared Deep Sky Survey (UKIDSS; Dye et al., 2006; Lawrence et al., 2006); infrared data from the Spitzer Wide-Area Infrared Extragalactic Survey (SWIRE; Lonsdale et al., 2003); and radio data from the VLA VIMOS Survey (Bondi et al., 2003; Ciliegi et al., 2005). Optical spectroscopic data are also available from the VVDS survey for a small sub-sample (Le Fèvre et al., 2005; Gavignaud et al., 2006), from observations of a selected sample of IR-selected AGNs (Lacy et al., 2006), and from the 2dF survey (Garcet et al., in prep.).
The X-ray observations and data are described in Paper I, and the multi-wavelength catalog and data set are presented in Paper II. The X-ray data cover the energy range from 0.3 to 10 keV, and fluxes are measured in 5 different bands, 0.3–0.5, 0.5–2, 2–4.5, 4.5–10, and 2–10 keV. Column densities are estimated from the hardness ratio HR derived from the soft (0.5–2 keV) and hard (2–10 keV) counts. For 55 sources with more than 50 net counts, the column density is estimated through spectral modeling with XSPEC (Arnaud, 1996) (for more details see Paper II).
The VVDS data set includes broad-band photometric data in the B, V, R, and I filters, to an AB limiting magnitude (50% completeness for point sources) of 26.5, 26.2, 25.9, and 25.0, respectively (McCracken et al., 2003). Imaging data in the U band to an AB limiting magnitude of 25.4 are also available. The CFHTLS data set includes broad-band photometric data in the , , , , and filters, to an AB limiting magnitude (50% completeness) of =24.5 in the wide survey and =26.1 in the deep survey.
Near-infrared data in the J and K bands are available for a small fraction (4%) of the area down to an AB limiting magnitude (50% completeness) of 24.2 and 23.9. Additional near-infrared data from the UKIDSS project are also available. The UKIDSS observations cover about 54% of the XMDS area and include J and K band data to a limiting magnitude of 22.3 and 20.8, respectively.
The Spitzer infrared data include broad-band photometric data from the four IRAC bands at 3.6, 4.5, 5.8, and 8.0 m to a 5 limit of 4.3, 8.3, 58.5, and 65.7 Jy, respectively, and MIPS data at 24 m to a 5 limit of 241 Jy. The SWIRE observations cover about 90% of the area and are available for 122 sources, 91% of the entire sample.
The radio data are from the VLA VIMOS Survey which reaches a 5 depth of 80 Jy at 1.4 GHz (Bondi et al., 2003; Ciliegi et al., 2005).
The associations between the X-ray source list and the multi-wavelength catalogs are described in detail in Papers I and II. The selected multi-wavelength catalog contains 136 sources. Two sources are galaxy clusters (see Paper II) and are not included in the following analysis. Of the remaining 134 sources, 130 have optical counterparts, unique for 121 and multiple candidates for the other remaining 9 sources. Out of four sources without optical counterpart, one is close to a bright star and the photometry could not be extracted and the remaining 3 sources are optically blank fields. All of the 122 sources that fall into the SWIRE area are detected in at least two Spitzer bands, and 87 are also detected at 24 m. UKIDSS data are available for 66 sources, of which 55 are also SWIRE sources and 64 have an optical counterpart. Radio data are available for 32 sources, of which 30 are also SWIRE sources and 30 have an optical counterpart.
3 Template fitting & photometric redshift technique
In order to classify the spectral energy distributions (SEDs) and estimate photometric redshifts of the sources in the sample, optical and IR data are combined and fitted with a library of galaxy and AGN templates.

The SEDs are fitted using the Hyper-z code (Bolzonella et al., 2000). Hyper-z has been already successfully applied to various data sets and offers the possibility of using any template library and filters set. Hyper-z finds the best-fit by minimizing the derived from the comparison of the observed SED and expected SEDs, at various redshifts, derived from the templates using the same photometric system. The effects of dust extinction are taken into account by reddening the reference templates according to a selected reddening law. We use the prescription for extinction derived from high-redshift starbursts by Calzetti et al. (2000). In order to limit degeneracies in the best-fit solutions we limit the extinction to be less than 0.55 mag and include templates of highly extincted objects to fit heavily obscured sources.
The library contains 20 templates including 1 elliptical, 7 spirals, 3 starbursts, 6 AGNs, and 3 composite (starburst+AGN) templates covering the wavelength range between 1000Å and 1000m. The elliptical, spiral and starburst templates were generated with the GRASIL code (Silva et al., 1998). The 7 spirals range from early to late types (S0-Sd), the starburst templates correspond to the SEDs of NGC 6090, M 82 and Arp 220. In all of the spirals and starburst templates the spectral region between 5 and 12 m, where many broad emission and absorption features are observed, was replaced using observed IR spectra from the PHT-S spectrometer on the Infrared space Observatory and from IRS on Spitzer.
Templates of moderately luminous AGN, representing Seyfert 1.8 and Seyfert 2 galaxies, were obtained by combining models, broad-band photometric data (NED), and ISO-PHT-S spectra (Schulz, private communication) of a random sample of 28 Seyfert galaxies. The other four AGN templates include three templates representing optically-selected QSOs with different values of infrared/optical flux ratios (QSO1, TQSO1, and BQSO1) and one type 2 QSO (QSO2). The QSO1 templates are derived by combining the SDSS quasar composite spectrum and rest-frame infrared data of a sample of 35 SDSS/SWIRE quasars (Hatziminaoglou et al., 2005). After normalizing each SED in the optical, we derived three templates with the same optical spectrum but three different IR SEDs. The QSO1 IR template was obtained from the average fluxes of all the measurements regrouped in wavelength bins, the TQSO1 IR template was obtained from the highest 25% measurements per bin, and the BQSO1 IR template was obtained from the lowest 25% measurements per bin. The type 2 QSO template (QSO2) was obtained by combining the observed optical/near-IR spectrum of the red quasar FIRST J013435.7093102 (Gregg et al., 2002) and the rest-frame IR data from the quasars in the Palomar-Green sample with consistent optical SEDs (Polletta et al., 2006).
The composite (AGN+SB) templates are empirical templates created to fit the SEDs of the following objects: the heavily obscured BAL QSO Mrk 231 (Berta, 2005), the Seyfert 2 galaxy IRAS 192547245 South (I19254; Berta et al., 2003), and the Seyfert 2 galaxy IRAS 224911808 (I22491; Berta, 2005). All these objects contain a powerful starburst component, mainly responsible for their large infrared luminosities (1012L⊙), and an AGN component that contributes to the mid-IR luminosities.
The full library of galaxy and AGN templates is shown in Figure 1. With respect to existing template libraries derived from empirical SEDs (Coleman et al., 1980) or from models (Bruzual & Charlot, 2003; Fioc & Rocca-Volmerange, 1997; Silva et al., 1998; Devriendt et al., 1999), this library has a broader wavelength coverage and variety of spectral types. Examples of application of this library to various types of SWIRE sources can be found in Lonsdale et al. (2004); Franceschini et al. (2005); Hatziminaoglou et al. (2005); Jarrett et al. (2006); Polletta et al. (2006); Weedman et al. (2006).
Photometric redshift techniques have been applied to optical or optical and near-infrared data sets providing reliable photometric redshifts (Rowan-Robinson et al., 2005; Ilbert et al., 2006; Brodwin et al., 2006). However, with a limited wavelength coverage, some spectral types can be degenerate, e.g., obscured starbursts and ellipticals. In those cases, the inclusion of mid-IR data can break the degeneracy. However, the inclusion of mid-IR data in photometric redshift techniques can degrade the photometric redshift estimates because the templates represent only a limited range of optical/IR ratios. We compared both approaches, fitting optical+near-IR and optical+near-IR+mid-IR data, and concluded that the latter method gives significantly better results both in the photometric redshift estimates and in spectral type classification.
We fit the SEDs using the data from the optical to 24 m. Mid-IR (5.8–24 m) data are available for 107 out of the 134 sources in the sample. The best solution corresponds to the solution with minimum among all of the solutions with =0–4 and B-band absolute magnitude within a pre-defined range. The allowed range of B-band absolute magnitude, MB, varies with redshift and is different for normal galaxies and for AGN templates. MB must be greater than MLog(dL), where dL is the luminosity distance in Mpc, and lower than MLog(dL), but always within the range 23.7, 17 for normal galaxy templates and greater than MLog(dL) and lower than MLog(dL), but always within the range 28.8, 19 for AGN templates. The best-fit solution is the one with the lowest among all of the solutions that satisfy the absolute-magnitude criterion. If there are no solutions in the defined absolute magnitude range, the criterion is modified by extending the limits M and M by steps of 0.5 magnitudes, but always within the maximum allowed range, 23.7, 17 for normal galaxy solutions and 28.8, 19 for AGN solutions. The criterion was relaxed in 7 cases (see M flag in Table 1).
In addition to the best solution, we consider up to two secondary solutions within the defined absolute magnitude limits. In most of the cases there are three solutions per source (the best and two secondary solutions), but in some cases, only one solution (or one minimum in the distribution), is found within the defined absolute magnitude limits, thus for each source there might be from one to three solutions. We will refer to these as the acceptable solutions. The comparison between the spectroscopic and final photometric redshifts is shown in Figure 2.

The reliability and accuracy of the photometric redshifts are measured via the fractional error , the systematic mean error , the 1 dispersion , and the rate of catastrophic outliers, defined as the fraction of sources with 0.2. is defined as:
| (1) |
and
| (2) |
with N being the number of sources with spectroscopic redshifts. Since there are only 33 sources in the selected sample with a spectroscopic redshift measurement (see Table 1), we also included in the analysis of the photometric redshifts, all of the sources in the XMDS 4 VVDS sample (Paper I) with a spectroscopic redshift measurement, for a total of 49 sources. The systematic mean error, , is 0.001 (0.008), the , , is 0.12 (0.11), and the outlier fraction is 10% (6%) for the 49 sources with spectroscopic redshifts. The values in parenthesis correspond to the results obtained using only the 33 sources with spectroscopic redshifts in the hard X-ray selected sample. Although these results are not as satisfactory as those achieved for galaxy populations, even when few broad-band photometric data are available (Babbedge et al., 2004), they are better than what has been previously obtained for AGN samples. The fraction of outliers for AGNs is indeed usually higher than 25% (Kitsionas et al., 2005; Babbedge et al., 2004). The achieved accuracy does not allow us to perform detailed analysis on single sources. However, it is adequate for a statistical analysis of the population as presented in this work. Four (XMDS seq: 48, 89, 439, and 820) of the 5 outliers have 0.28 and two of them (XMDS seq: 439, and 820) are in the hard X-ray sample. The only outlier with 0.28 is source XMDS seq 1259, which is not included in the selected sample.
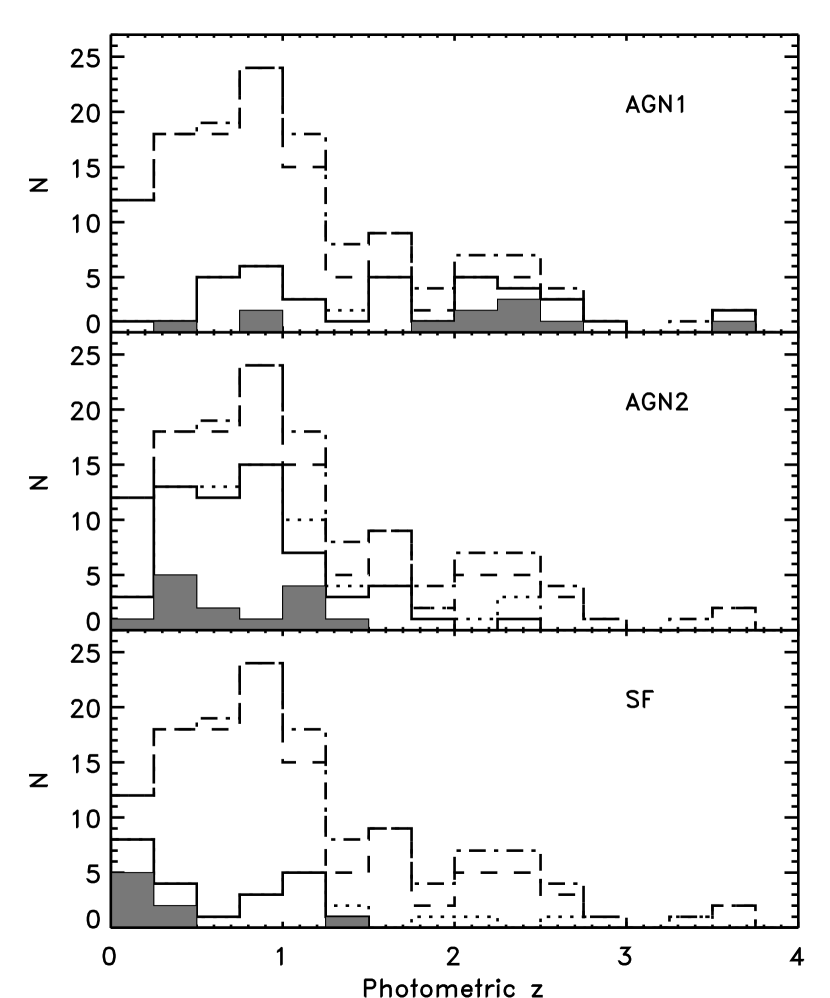
The redshift distributions of the whole sample, based on the photometric redshifts is shown with a dot-dashed line in Figure 3. The distribution peaks at 0.9, consistent with the redshift distribution of other X-ray selected samples (Hasinger, 2002; Barger et al., 2002; Szokoly et al., 2004; Eckart et al., 2006). About 54% (73 out of 134) of the sources are at redshift below 1 and 90% are at redshift below 2.3. In the Figure, the redshift distribution of the total sample is compared with that of AGN1, AGN2, and SF sources (see Section 3.1).
3.1 Spectral energy distributions
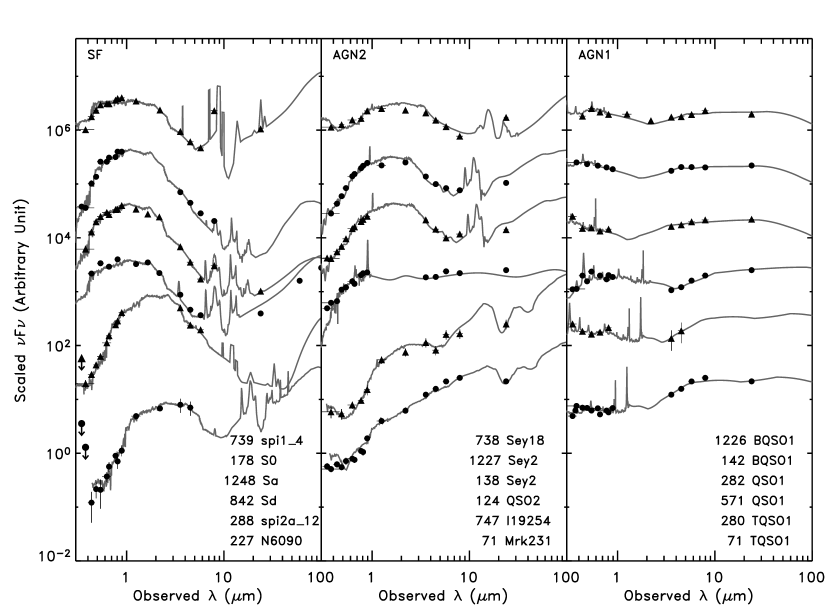
According to the template corresponding to the best-fit solution selected by the procedure described above, each source is classified as one of the following broad classes, AGN1, AGN2, or SF. Examples of fits for the three classes are shown in Figure 4. The AGN1 class includes all of the sources best-fitted with a QSO1 template (bottom three on the right panel of Figure 1, see also right panel of Figure 4). They are characterized by blue optical SEDs () and red IR SEDs (). The change in slope, from blue to red, occurs at about 1 m. Emission from the accretion disk dominates at shorter wavelengths and from AGN-heated dust at longer wavelength. The AGN2 class includes sources best-fitted with the Seyfert templates, the three composite AGN+SB templates, or the QSO2 template (top six on the right panel of Figure 1, and see also middle panel of Figure 4). The AGN2 templates include a wide variety of SED shapes. They are mostly red at optical and near-IR wavelengths, but in some cases an upturn (blue) at short wavelengths (far-ultraviolet) is present. Their IR SEDs range from red power-law like SEDs, similar to the AGN1 or redder, to composite SEDs where emission features associated with star-formation are present in addition to continuum emission in the near-IR. The SF class includes sources fitted with a spiral or a starburst template (left panel of Figures 1 and 4). SF templates are all red in the optical and blue in the near-IR, consistent with emission from stellar populations. At mid-IR wavelengths, the SED is dominated by emission features and a warm dust continuum associated with star-forming regions. Photometric and spectroscopic redshifts, best-fit template and classification are reported in Table 1.
Although a best-fit template, and thus an SED classification, is available for all sources in the sample, in the following analysis we will discuss the results only for sources with a reliable fit and simply report the derived values for the rest of the sample for completeness. We define a fit reliable if at least six data points could be fitted. Six sources (XMDS seq: 139, 199, 233, 403, 840, 1219) have been observed only in the optical or in the IR and have less than six data points in total. Because of the limited wavelength coverage, they are not included in the following analysis. Nine sources with ambiguous counterpart (XMDS seq: 91, 111, 120, 227, 255, 449, 470, 747, 844) are also excluded in the following analysis. We will refer to the 15 sources as sample B. In Table 1 we report all best-fit solutions for the sources with ambiguous counterpart in order of increasing distance of the optical counterpart, but in the following figures we will show only the best-fit solution corresponding to the closest counterpart. The sample that will be analyzed in the following sections contains the remaining 119 sources (the total 134 minus the 15 in sample B; hereinafter sample A), of which 38 are classified as AGN1s (32% of the sample), 59 (50%) as AGN2s and the remaining 22 (18%) as SFs.
The reliability of this classification depends on the number of available optical and IR data points and on the ability of identifying the signatures that make the SEDs of the various classes unique. In the case of AGN1s, the blue optical SED and red IR SED provide two clear signatures that make their classification highly reliable (see right panel in Figure 4). The distinction between AGN2s and SFs is less obvious than the identification of AGN1 since the only difference between their SEDs is in the shape of the near- and mid-IR SED (see left and middle panels in Figure 4). When only few IR data points are available or the data do not sample the region where the AGN signature is visible (i.g. 3–5 m rest-frame), the separation between the two classes is more uncertain. In order to estimate the uncertainty of our classification we counted all sources with an acceptable solution in a different class (see Section 3 for a description of the acceptable solutions). For each class, we counted the number of sources with solutions in other classes, and the number of sources in other classes with a secondary solution in the specific class. For the AGN1 class, we estimate that 2 sources might belong to a different class, AGN2 or SF, 4 AGN2s have an AGN1 secondary solution, and 2 SFs have an AGN1 secondary solution. Thus, there are 36 sources with a secure AGN1 fit, and 44 sources with a possible AGN1 fit, which implies an AGN1 fraction of 32%. Analogously, for the AGN2 class, we estimate that 13 sources might belong to a different class, AGN1 or SF, 1 AGN1 has an AGN2 solution, and 5 SFs have an AGN2 solution. Thus, there are 46 sources with a secure AGN2 fit, and 65 sources with a possible AGN2 fit, which implies an AGN2 fraction of 50%. For the SF class, we estimate that 7 sources might belong to a different class, AGN1 or AGN2, 1 AGN1 has an SF solution, and 9 AGN2s have an SF solution. Thus, there are 13 sources with a secure SF fit, and 30 sources with a possible SF fit, which implies an SF fraction of 18%. Note that, by definition, the given uncertainties on the class fractions correspond to lower and upper limits to the fraction of sources in each class.
The reliability and completeness of our classification can be estimated using the spectroscopic classification, however we do not expect an exact correspondence between our SED-based classes and the spectroscopic classes. A spectroscopic classification is available for 49 sources, including sources that are not in the hard X-ray samples. Of these, 26 are spectroscopically classified as type 1 AGNs, 12 are spectroscopically classified as type 2 AGNs, and 11 as star-forming galaxies. Among the 26 type 1 AGNs, 16 are classified AGN1s, 9 AGN2s, and 1 SF, and all the AGN1s with a spectroscopic classification (16) are type 1 AGNs. Thus, the SED classification is 62% complete (16 AGN1s out of 26 type 1 AGNs), and 100% reliable (all AGN1s are type 1 AGNs). Among the 12 sources spectroscopically classified as type 2 AGNs, 7 are classified as AGN2s, and the remainings as SFs. The AGN2 class (24 sources) includes 9 type 1 AGNs, 7 type 2 AGNs, and 8 SFs. Thus, the completeness of the AGN2 sample is 58% (7 AGN2 out of 12 type 2 AGNs), and the reliability is 29% (7 out of 24 AGN2s are type 2 AGNs). There are 11 sources with a spectroscopic classification consistent with being normal galaxies. Eight of them are classified as AGN2s, and 5 as SF. Among the 9 sources classified as SF, 1 is a type 1 AGN, 5 are type 2 AGNs, and 3 are star-forming galaxies according to the spectroscopic classification. The completeness of the SF sample is thus 27% (3 out of 11 star-forming galaxies are classified SF), and the reliability is 33% (3 out of 9 SF sources are star-forming galaxies). In summary, the SED and the spectroscopic classification agree in 26 of the 49 sources with spectroscopic classification (53%).
We can also compare the fraction of AGNs that are identified as AGNs by the SED classification (AGN1 or AGN2) and by the spectroscopic classification (type 1 and type 2 AGNs). Note that all sources are AGNs as probed by their X-ray properties. Out of the 49 AGNs with spectroscopic classification, 38 (78%) are spectroscopically identified as AGNs (26 type 1 and 12 type 2), and 40 (82%) are classified AGNs by the SED fitting technique (25 AGN1 and 7 AGN2). The latter fraction is consistent with the 83% derived from the entire X-ray sample.
3.2 Redshift-dependent derived quantities: luminosities and absorption
Using the available redshifts, spectroscopic if available, photometric otherwise, and the best-fit templates, we derive the luminosities in the broad and hard X-ray energy bands (0.5–10 keV and 2–10 keV rest-frame), in the mid-IR (3–20 m rest-frame), and in the radio at 1.4 GHz rest-frame. The X-ray luminosities, hereinafter and , are derived assuming a power-law spectrum (F(E)) with photon index =2.0. Effective column densities are derived from the observed column densities after applying the redshift correction (see Paper II for details). In case the observed column density is consistent with the Galactic value, we derive an upper limit to the effective column by assuming the Galactic value and the redshift of the source (see also Section 5). The observed column densities are used to correct the X-ray luminosity for absorption, hereinafter . The uncertainty on the X-ray luminosities are estimated by propagation of the uncertainty on the flux and on the column density.
The mid-IR luminosities, , are estimated by integrating the best-fit template in the rest-frame 3–20 m wavelength range. To estimate the uncertainty on the mid-IR luminosities we first fit the IR data (m) of each source with all of the templates, derive the and then use the range of luminosities obtained from all acceptable solutions.
The radio luminosities, , are derived assuming a power-law spectrum (F) with spectral index =0.8 (Condon & Broderick, 1988). The uncertainty on the radio luminosity is derived from the radio flux uncertainty.
The X-ray, mid-IR and radio luminosities are listed in Table 1.
3.3 Star-forming galaxies
In the following analysis, we will include only sources that contain an AGN. In order to identify sources whose X-ray emission is consistent with emission from a star-forming galaxy, e.g., from X-ray binaries, we require a broad X-ray luminosity below 1042, and a soft X-ray spectrum. Star-forming galaxies are typically characterized by luminosities below 1042and show steep X-ray spectral slopes (Kim et al., 1992a, b; Colbert et al., 2004; Persic et al., 2004). This criterion might misidentify some normal star-forming galaxies with a large population of high-mass X-ray binaries (HMXBs) that produces a flat X-ray spectrum (Colbert et al., 2004), (see also Figure 2 in Alexander et al., 2005a), and might also misidentify low-luminosity AGNs whose X-ray luminosity can be lower than 1042.
There are 3 sources with an absorption-corrected luminosity below 1042, sources XMDS seq 178, 842 (aka Arp 54), and 1248. Sources XMDS seq 178 and 1248 are characterized by low column densities, 221020 and 2.61020 (consistent with the Galactic value), and hardness ratios, 0.43, and 0.54, respectively. However, source XMDS seq 842 (=0.043) has a hardness ratio of 0.16 which implies a column density of 1.781022 . Because of its hard X-ray spectrum, source XMDS seq 842 is included in the AGN sample that will be investigated in the following sections. The classification of source 178 is also dubious because its optical to X-ray flux ratio () is consistent with those typical of unobscured AGNs (1; Akiyama et al., 2003). Indeed in Paper II, where star-forming galaxies are identified based on the optical to X-ray flux ratio, XMDS seq 178 is considered an AGN and XMDS seq 842 is considered a star-forming galaxy. Here, we prefer to adopt a criterion which is based only on intrinsic X-ray properties (luminosity and ) rather than flux ratios that are redshift-dependent. Thus, we consider XMDS seq 178 and 1248 normal star-forming galaxies, and XMDS ID 842 an AGN. Sources XMDS seq 178 and 1248 will not be taken into account in the following analysis which will focus only on the AGN population (132 sources in total, and 117 in sample A).
The fractions of AGNs in the three SED classes thus become 33% AGN1s, 50% AGN2s, and 17% SFs.
4 Average SEDs of the three AGN SED classes
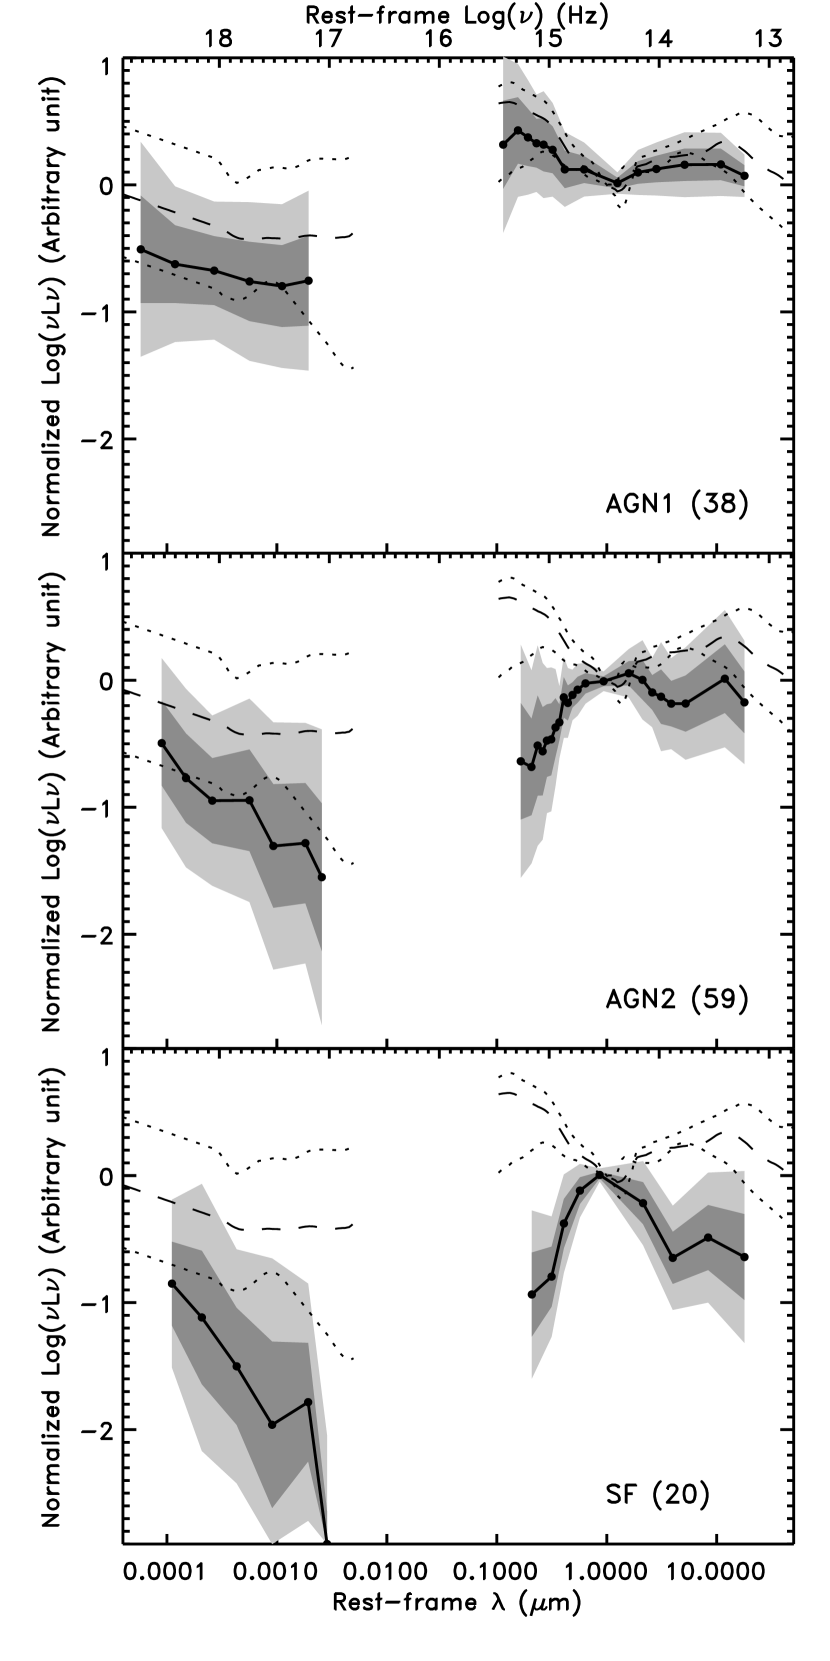
After deriving the luminosity SEDs in L for each source assuming the source photometric redshift, or spectroscopic redshift if available, average normalized rest-frame SEDs, from the X-ray to the mid-IR, were obtained from all AGNs in the A sample (117 sources) divided by class (SF, AGN2 and AGN1). The average SEDs are shown in Figure 5. Similarly to the median QSO template in Elvis et al. (1994), we normalize the SEDs at 1 m rest-frame assuming the best-fit template for each source. This choice of wavelength is well suited to investigate separately the SED dispersion of the main emitting components in AGNs, the accretion disk and the stars in the optical and the dust in the infrared. The average SEDs are derived from the normalized rest-frame SEDs by taking the mean of the logarithm of the wavelength and the weighed mean of the luminosity in Log(L) in 0.3 wide bins. Smaller bins were chosen if more than 40 data points were available or wider bins to include at least 10 points. The weights are based on the luminosity uncertainties. Upper limits in the optical and infrared are taken into account by assuming the upper limit to the luminosity and a logarithmic uncertainty equal to twice the maximum logarithmic uncertainty of each source. Upper limits to the X-ray luminosities are taken into account by assuming as luminosity the 1 luminosity value and a logarithmic uncertainty equal to twice the maximum logarithmic uncertainty observed in the X-rays for that source. The average SF, AGN2, and AGN1 SEDs contain respectively 15, 29, and 20 bins, and are obtained by averaging the rest-frame SEDs of 20 SFs, 59 AGN2s, and 38 AGN1s. The average SEDs are shown in Figure 5 as thick black curves, 1 and 2 dispersion are shown as grey shaded areas. Since the redshift distribution of the sample is broad, up to 3.5, and the majority of the sample has 1, the observed X-ray data sample rest-frame energies up to 45 keV for the highest- sources, and up to 20 keV for the majority of the sample. Thus, the average SEDs sample rest-frame energies up to 20 keV.
The global SEDs, from X-ray to infrared, show a wide dispersion in each class. Since they are normalized at 1 m, this dispersion is more pronounced at X-ray wavelengths. The average SEDs of the three classes show some clear differences. The average SEDs become increasingly blue in the optical-NIR (m), red in the IR (m), and soft in the X-rays in the sequence SFAGN2AGN1 (from bottom to top in Figure 5). The average SEDs are compared with the median QSO template of optically-selected quasars (Elvis et al., 1994) in Figure 5. The average AGN1 SED is redder in the optical than Elvis’s template, with only the bluest sources being consistent with Elvis’s template. The redder optical SED of the AGN1s compared to Elvis’s template suggests that these sources might include some reddened type 1 AGNs (Wilkes et al., 2002; Gregg et al., 2002; Glikman et al., 2004; Urrutia et al., 2005; Wilkes et al., 2005). Indeed, the observed range of extinction for AGN1s in V-band is 0.0–0.55, and the median value is 0.40 (see Table 1). The SF and AGN2 optical SEDs are almost identical and significantly redder than the AGN1 optical SEDs. The observed different shape suggests that the origin of the optical emission is different in AGN1 and in AGN2, and SF sources, rather than the effect of reddening on an AGN spectrum. The AGN2 and SF optical emission is likely dominated by the host galaxy emission in most of the cases.
The near- and mid-IR (1–20 m) average SEDs of AGN1s and AGN2s are consistent with each other at 1 level, and both are redder than the SF average SED. The mid-IR SED of AGN1 and AGN2 are consistent with being dominated by AGN-heated hot dust emission, while, in SFs, the host galaxy dominates. The mid-IR SED of Elvis’s template is consistent with the average AGN1 mid-IR SED, and redder than the average AGN2 mid-IR SED.
In the X-rays, we show X-ray luminosities with no correction for intrinsic or Galactic absorption. AGN1s show on average softer X-ray spectra than SFs and AGN2s, although there is a significant dispersion. The observed average spectra are consistent with increasing absorption in AGN2 compared to AGN1, and in SF compared to AGN2.
Compared to Elvis’s template, the normalized X-ray luminosity (LX/L(1m)) of AGN1s is more than two times lower. This difference might be due to a well known bias in Elvis’s QSO sample which favors sources with strong X-ray-to-optical luminosity ratios and detections in the soft X-rays (Wilkes & Elvis, 1987; Elvis et al., 1994).
The observed differences in the optical and IR SEDs of the three classes are mainly a consequence of the spectral classification. However, the SED classification is independent of the X-ray properties, therefore the differences in the X-ray average spectra indicate that harder X-ray spectra are observed in more obscured AGNs.
5 Luminosities and X-ray absorption AGN SED class
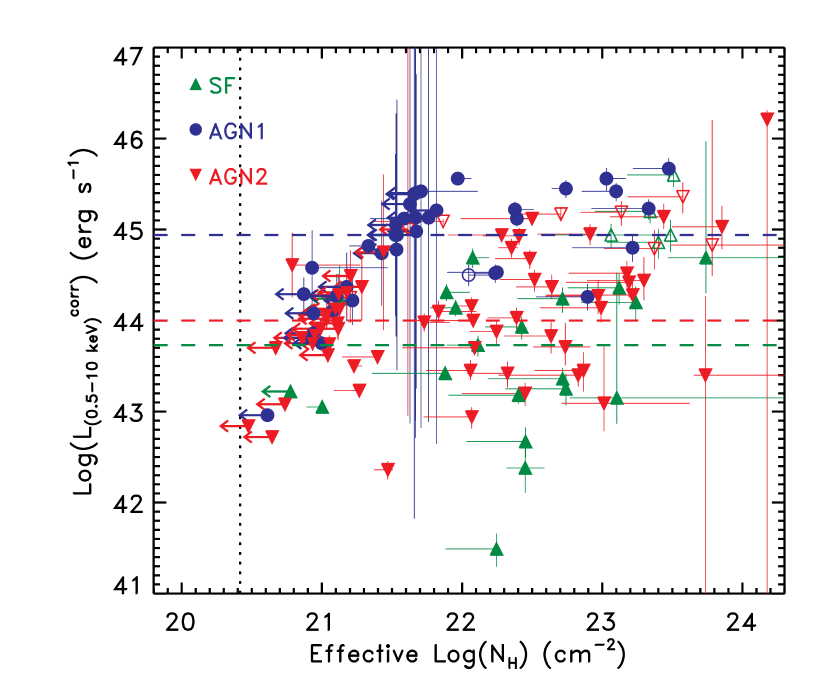
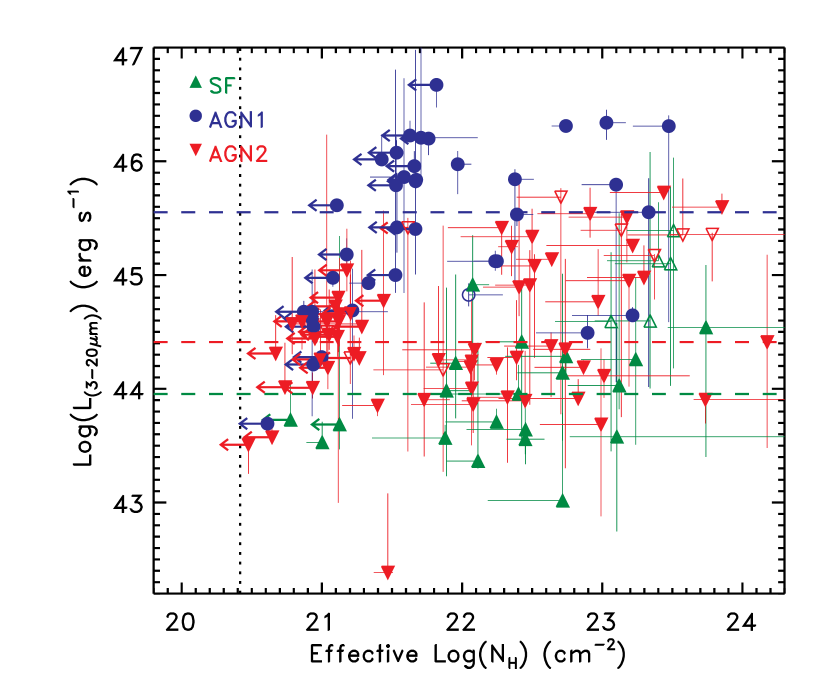
The absorption-corrected rest-frame broad-band X-ray luminosities are compared to the intrinsic column densities in Figure 6 for the entire AGN sample (132 sources). Full symbols represent sources in sample A (117 sources), and open symbols represent sources in sample B (15 sources). Upper limits to the column density are adopted for sources with an observed column density lower or consistent with the Galactic value. The upper limit to the column density is derived from the Galactic value after applying the correction for redshift (). Median luminosity values, derived from the A sample, for each class are shown with dashed lines. The absorption-corrected rest-frame X-ray luminosities of AGN1 are on average more than ten times those of SF, while AGN2 show intermediate values. No correlation with the intrinsic absorption measured in the X-rays is observed. The paucity of heavily absorbed () sources at luminosities below 1044 , it is due to a selection effect because they would be too faint in the X-rays to be detected above our selection threshold.
Note that the area (1) of this survey provides a large sample of highly luminous (L ) AGNs (21 sources). As commonly found in X-ray selected samples where unabsorbed type 1 AGNs dominate the most luminous population (Ueda et al., 2003; Akylas et al., 2006), we also find a larger fraction of AGN1s at higher X-ray luminosities. The fraction of AGN1s increases from 22% at to 81% at . A detailed discussion on the fraction of unobscured (AGN1s) and obscured (AGN2s+SFs) AGNs as a function of X-ray luminosity and a comparison with previous results is reported in Paper II. Paper II also discusses the uncertainty of these estimates due to the large corrections in luminosity and column density for sources at high-redshifts and the properties of absorbed QSOs (1022 and ). It is interesting to note the lack of SF sources in sample A at high X-ray luminosities, 1045 . This indicates that powerful AGNs always dominate in the IR and are, therefore, identifiable as AGNs at those wavelengths. Thus, IR surveys can potentially be used to identify and study the most luminous AGNs. There are however two sources in sample B (XMDS seq: 403, 449) classified as SF at high luminosities ( ). Since they belong to the B sample, they are not included in the analysis (open triangles in Figure 6). Deeper multi-wavelength observations are necessary to better characterize these sources (classification and redshift) and verify their high X-ray luminosities.
The mid-IR luminosity is compared with the column density measured in the X-rays in Figure 7. Similarly to the distribution of the X-ray luminosities, the majority of AGN1s show predominantly high mid-IR luminosities (1045), while SFs show mostly low mid-IR luminosities (), and AGN2s show intermediate values (1044-45.5) overlapping with those of the other two classes. As for the X-ray luminosities, the mid-IR luminosities of the objects in each class do not show any obvious correlation with the intrinsic absorption measured in the X-rays.
In the next sections, we will investigate whether the observed multi-wavelength properties of the three classes can be simply explained by different luminosities, dust extinction or orientation effects. These parameters will be investigated separately for each AGN class by analyzing the mid-IR and X-ray luminosity ratio, the dependency of the SEDs on the X-ray luminosity, and of the IR colors on the luminosity and dust extinction.
6 The range of mid-IR over X-ray luminosity ratios
The nuclear mid-IR continuum in AGNs is due to reprocessing of the AGN emission by circumnuclear dust, e.g. the putative torus, and is thus function of both the AGN luminosity and the distribution of the obscuring matter. The dust covering factor in AGNs can be investigated by comparing the ratio between the mid-IR continuum (re-radiation) and the intrinsic X-ray emission. A lower mid-IR/X-ray luminosity ratio is expected in highly luminous AGNs if the dust inner radius recedes (Lawrence, 1991) and the torus height is constant, and in type 2 sources where the torus is seen edge-on because of mid-IR absorption (Granato et al., 1997). However, studies on Seyfert 1, Seyfert 2 galaxies (Lutz et al., 2004; Horst et al., 2006), and type 2 QSOs (Sturm et al., 2006) where the dust covering factor is estimated from the luminosity ratio, where is the monochromatic luminosity at 6 or 12 m, have not found any dependency on AGN type, absorption or X-ray luminosity.
In Figure 8, we compare the mid-IR/X-ray luminosity ratio with the absorption-corrected X-ray luminosity for the three AGN classes. In order to investigate whether there is a trend with the X-ray luminosity or the AGN class, we regrouped the data for each class in five bins with the same number of sources per bin for each class, and derived the average ratio. The average values are derived only for sample A (full symbols) and are shown as diamonds connected by solid lines. For clarity, we show the data of the single sources without uncertainties. Analogously to previous studies (Lutz et al., 2004; Horst et al., 2006; Sturm et al., 2006), we find that the mid-IR/X-ray luminosity ratio is characterized by a wide dispersion and does not depend on the AGN class or the X-ray luminosity. The only exception is in an trend observed for the SF class to have a decreasing mid-IR/X-ray luminosity ratio at increasing X-ray luminosities. Some models predict smaller dust covering factors, or lower mid-IR over X-ray luminosity ratios, in more luminous sources. However, according to these models, this effect should be observed in all AGN classes and at extreme X-ray luminosities, but the mid-IR/X-ray luminosity ratio in AGN1s and AGN2s is constant and low ratios are also observed in SFs at moderate X-ray luminosities () as shown in Figure 8.
In order to further investigate whether there is a dependency with luminosity, and whether previous studies did not cover a broad enough range of parameters (X-ray luminosities, spectral types) to observe such a trend, we produce a similar diagram using data from the literature. Instead of the integrated mid-IR luminosity we use the monochromatic 6 m luminosity and the absorption-corrected hard (2–10 keV) X-ray luminosity because available for all sources in the literature. The mid-IR over X-ray ratios as a function of X-ray luminosities from various AGN samples (Borys et al., 2005; Sturm et al., 2006; Lutz et al., 2004; Weedman et al., 2006) are shown in Figure 9. In addition to the literature data, we report the average trend for the three AGN classes studied here. In this case, the average values were derived using the monochromatic 6 m luminosity and the absorption-corrected hard (2–10 keV) X-ray luminosity as for the literature sample. The resulting trends for our sample are consistent with the results shown in Figure 8. The literature data show a large dispersion, in agreement with our results, but no dependency on AGN type or X-ray luminosity is observed. There is a group of sources from Borys et al. (2005) with unusual low ratios and moderate X-ray luminosities. These sources are sub-millimetre detected AGNs whose optical-IR emission is mainly dominated by the host-galaxy, similarly to the SF class. The X-ray emission of these sources is faint, L1042.5-44.2, and they are characterized by low or moderate accretion rates, 0.01–0.80 (Alexander et al., 2005a).

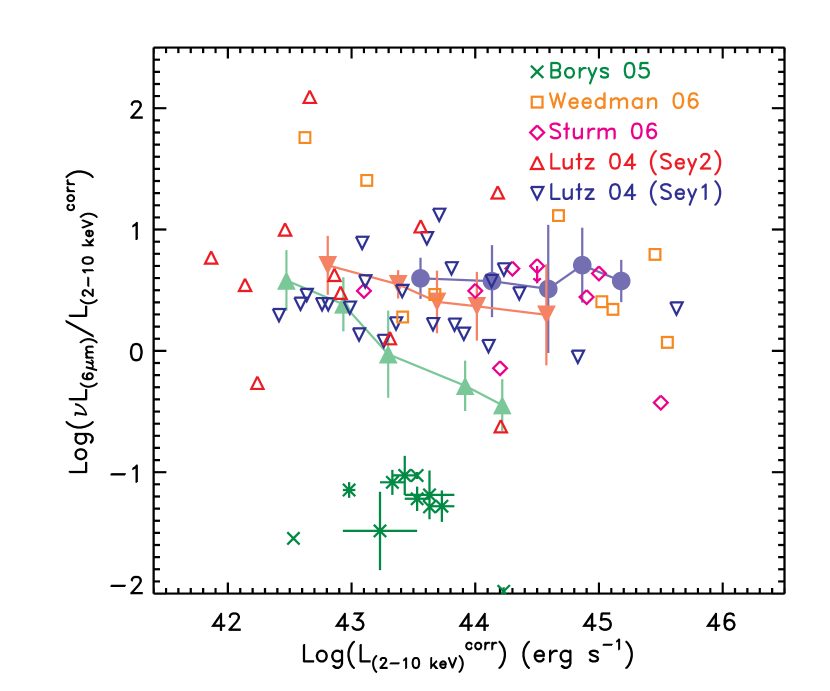
The comparison with the ratios from the literature samples confirms that the mid-IR/X-ray luminosity ratio in AGNs is characterized by a broad dispersion and there is no dependency with the X-ray luminosity. At low and moderate X-ray luminosities some AGNs are characterized by large mid-IR/X-ray ratios because of contribution from the host galaxy to the mid-IR luminosity. In SFs, the AGN mid-IR emission is generally fainter relative to the absorption-corrected X-ray luminosity compared to AGN1s and AGN2s. The host galaxy emission into the mid-IR can increase the mid-IR/X-ray ratios in SFs and make them consistent or even larger than those observed in AGN1s and AGN2s, but in some cases, the mid-IR/X-ray ratios can be 100 times lower, as observed in Borys et al. (2005) sample. However, it is still not clear whether the observed low ratios are due to absorption of the mid-IR AGN emission or are intrinsic. Lower intrinsic ratios might imply different dust properties (geometry, distribution, optical depth). For example, a low mid-IR/X-ray ratio could be indicative of lack of hot dust, as in the case the dust were located at a relatively large distance from the central heating source, e.g. 10 pc (Ballantyne et al., 2006). In this case, a dependency of mid-IR/X-ray ratio with the X-ray luminosity would not be expected.
7 SEDs as a function of luminosity
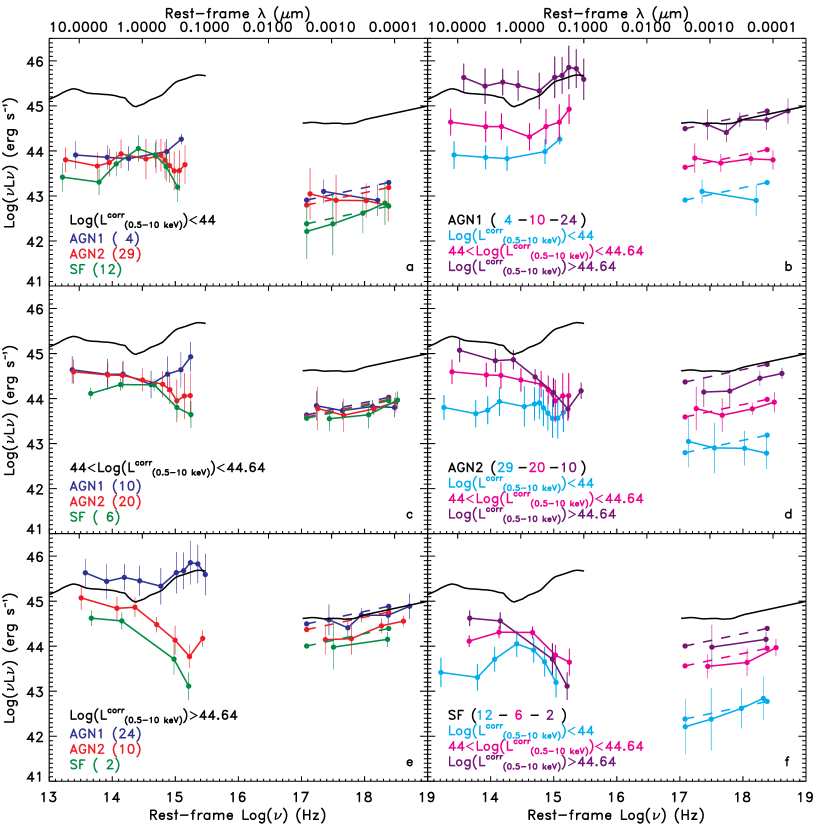
In Section 4, we compared the normalized SEDs of the three classes. Here, we investigate whether the average SEDs vary with the AGN luminosity. We use the absorption-corrected broad band X-ray luminosity, , to separate each class (SF, AGN2, and AGN1) in three groups, sources with 1) 1044, 2) = 1044-44.64 , and 3) 1044.64 . The luminosity values that define the three groups correspond to the value that separates Seyferts and quasars, , and corresponds to the median luminosity of all sources with 1044 . In group (1), 4 AGN1s, 29 AGN2s, and 12 SFs are included; 10 AGN1s, 20 AGN2s, and 8 SFs in group (2), and 24 AGN1s, 10 AGN2s, and 2 SFs in group (3). The average SEDs of each class and group are shown in Figure 10. On the left side we show the SEDs regrouped by X-ray luminosity and on the right side by class. Note that the average absorption-corrected X-ray luminosities of each class within a group can differ by up to a factor of 2. The Elvis’s median QSO template is shown for comparison. The average absorption-corrected X-ray luminosities are shown as dashed lines at 0.5–10 keV in the rest-frame.
The optical-near-IR (0.4–2m) luminosities of the three classes in the lowest X-ray luminosity group (1) are all consistent within the 1 dispersion (panel a of Figure 10). However, the SEDs are characterized by different shapes, flat for the AGN1s consistent with AGN emission at all wavelengths, and optically red and flat in the IR for the AGN2s, consistent with being dominated by emission from the host-galaxy or by a reddened AGN in the optical and from the AGN in the IR, and optically red and blue in the IR for the SFs, consistent with being dominated by emission from the host-galaxy at all wavelengths. In the X-rays, AGN1s and AGN2s show soft spectra, consistent with no absorption, while SFs show a hard spectrum. The sources in this class are more than 10 times less luminous than Elvis’s QSO median template at all wavelengths.
In group (2) (panel c), the optical-IR luminosities of the three classes show similar properties to those in group (1). However, the difference in luminosity at short (0.4m) and long (2m) wavelengths in the three classes increases. The X-ray spectra are all similar and consistent with the canonical slope (=0.7). The difference in luminosity with Elvis’s QSO median template is lower than in group (1), but they are still from three to ten times less luminous.
In group (3) (panel e), the trend observed in the two previous groups is confirmed, the optical-IR luminosities of the three classes separate further, with the AGN1s being from ten to hundred times more luminous than the SFs. In the X-rays, a large difference is observed between the absorption-corrected luminosities and the observed values in AGN2s and SFs, indicating large absorption, while no indication of X-ray absorption is seen in AGN1s. The AGN1 luminosities are now consistent with Elvis’s QSO median template in the optical and X-ray, and higher in the IR.
The average SEDs in each class show also a change in the overall shape as a function of X-ray luminosity (see right panels in Figure 10).
AGN1s (panel b) have overall similar infrared, optical and X-ray SEDs at all luminosities, with only a slightly redder SED at m and less soft X-ray spectra at higher X-ray luminosities. The optical-IR luminosities scale with the X-ray luminosities, both uncorrected and corrected for absorption.
The AGN2s (panel d) show a clear change in the optical-IR SED as the X-ray luminosity increases, with the overall SED becoming redder. The most plausible explanation for this change is an increasingly contribution from hot dust continuum emission associated with the AGN, e.g the putative torus, or less contribution from the host galaxy. In the lowest luminosity group, the host galaxy still dominates, but at large luminosities its emission is significantly lower than that of the AGN. It is difficult to characterize the host galaxy emission in the mid-IR because it can change dramatically for an elliptical or a late spiral or a starburst galaxy. In all cases the host galaxy light peaks in the near-IR, 1-2 m, where the AGN light has a minimum (Sanders et al., 1989). At longer wavelengths the host galaxy emission can decrease or increase, according to the galaxy type, and the AGN contribution increases. Thus, the total spectrum goes from blue if the host dominates to flat if the two contributions are similar to red when the AGN dominates. We can expect to see this trend for AGNs of increasing luminosity if the host galaxy luminosity is fixed or does not scale with the AGN luminosity. The X-ray spectra of the AGN2s change from being soft to hard as the luminosity increases. It is interesting to note that the AGN mid-IR luminosity does not scale with the absorption-corrected luminosity. Indeed the mid-IR luminosity of the most X-ray luminous AGN2s is less than twice that of those with intermediate X-ray luminosity, while the X-ray luminosity is almost 10 times higher. This suggests mid-IR absorption in more luminous sources or a lower dust covering factor.
The SF-like AGNs (panel f) show a similar change in SED shapes as the AGN2s. In this class, the near-IR (1 m) luminosity remains approximately the same in the three groups, however the absorption-corrected X-ray luminosity is about 40 times larger in the most X-ray luminous SFs than in the less X-ray luminous ones. The decrease in mid-IR luminosity relative to the absorption-corrected X-ray luminosity with increasing X-ray luminosities discussed in Section 6 is also visible here. This result is even more remarkable considering that the host galaxy contributes to the mid-IR luminosity.
The decreasing mid-IR luminosity compared to the absorption corrected X-ray luminosity observed in the most luminous AGN2s and in the SFs is equivalent to the low mid-IR over X-ray ratios found at high X-ray energies in SFs discussed in Section 6 and shown in Figures 8 and 9. From the analysis in the previous section, we concluded that the deficiency of mid-IR light is not dependent on the AGN X-ray luminosity. However, when the AGN X-ray luminosity is low the host galaxy might be luminous enough to compensate the mid-IR deficiency, preventing low mid-IR over X-ray ratios to be observable in less luminous AGNs. Assuming that a molecular torus surrounds the nuclear source, the deficiency of mid-IR light relative to the X-ray luminosity observed in SFs and some AGN2s can be explained by lack of hot dust, larger optical depths, or large angles of the line of sight from the torus axis (Granato & Danese, 1994; Granato et al., 1997).
8 The origin of AGN IR colors


Lacy et al. (2004) identified a region in IRAC color-space (3.6–8.0 m) where most of the AGNs detected in all four IRAC bands are distributed (see also Barmby et al., 2006; Stern et al., 2004; Hatziminaoglou et al., 2005). AGNs occupy preferentially this region because of their red and almost featureless IR SED. Only five out of 87 sources in sample A with detections in all four IRAC bands are not within the ‘AGN wedge’ as defined by Lacy et al. (2004). For fifteen additional objects, only an upper limit in one or more IRAC bands is available. We can therefore conclude that Lacy’s criterion is satisfied by 80% of our X-ray sources in sample A observed with IRAC (this fraction is obtained with the pessimistic assumption that all the sources with IRAC limits would fall outside Lacy’s wedge) or by a fraction close to 95% (97/102, if we assume that all the sources with upper limits lie within the wedge). Thus, this criterion appears to be fairly complete for a relatively bright X-ray sample as the XMDS sample. Using the properties (SED class, luminosity, and absorption) derived for the AGNs in the XMDS, we investigate how these affect the IRAC colors and make them so distinctive for AGNs.
In the hypothesis that different AGN types and column densities correspond to tori seen at different angles with respect to the line of sight and that the mid-IR radiation is dominated by the torus emission, a dependence of the IR colors on the AGN class (type 1 type 2) and on the absorption in the X-rays is expected. In Figure 11, we reproduce Lacy’s color diagram plotting separately sources in different intervals of absorption-corrected X-ray luminosity (panel a), mid-IR (3–20 m) luminosity (panel b), SED classification (panel c), and column density (panel d). IRAC colors are constrained for 107 out of the 117 sources in sample A, and 102 satisfy Lacy’s color criteria: all AGN1s, and most AGN2s (96%) and SFs (82%). We divided the area defined by Lacy et al. (2004) in three sub-regions, R1, R2, and R3, that contain sources with increasing flux ratios or redness and, approximately, the same number of sources (34). The equation of the line that divides regions R1 and R2 is , and the equation of the line that divides regions R2 and R3 is . In order to investigate whether any AGN property (class, X-ray luminosity, mid-IR luminosity, and X-ray absorption) is correlated with the mid-IR redness, we derived the fraction of sources with a specific property in each region. The number of sources per region, including upper limits or detections only, are reported in Table 2.
The position of the sources in the diagram is strongly correlated with the SED class. The fraction of AGN1s increases from R1 to R3, while most of the SFs are in R1 and most of the AGN2s in R2. The observed dependency is the opposite of what expected by AGN tori models where redder SEDs are predicted in more obscured sources. A likely explanation for this correlation is the increasing host-galaxy contribution from AGN1s to SFs. A correlation with the IRAC colors is also observed as a function of X-ray and mid-IR luminosities, with the fraction of the most luminous sources increasing and that of the less luminous decreasing going from R1 and R3. This correlation is consistent with less host contribution in the IR in more luminous AGNs. The least correlated parameter with the IRAC colors is the column density measured in the X-rays. However, all sources in the A sample outside Lacy et al. (2004) region are X-ray absorbed.
9 Radio luminosity X-ray and mid-IR luminosities
In star-forming galaxies, the radio and far-infrared (FIR; 42.5–122.5 m) emission are strongly correlated (Dickey & Salpeter, 1984; de Jong et al., 1985). The majority of AGNs (radio-quiet AGNs), about 90%, depending on the sample selection, follow the same correlation as star-forming galaxies, and a minority, i.e. radio galaxies and radio-loud quasars, shows an excess of radio emission compared to radio-quiet objects with similar FIR emission (Sopp & Alexander, 1991; Roy et al., 1998). The FIR over radio flux ratio is thus a good diagnostic tool to identify AGN activity. In recent studies, this correlation has been used by replacing the FIR emission with the 24 m emission because more easily available for faint high- sources thanks to Spitzer (Appleton et al., 2004; Higdon et al., 2005; Donley et al., 2006), although the correlation between the 24 m and the FIR emission is characterized by a large dispersion (Brandl et al., 2006; Barger et al., 2007). The radio continuum is also correlated with the X-ray emission in AGNs (e.g.; Brinkmann et al., 2000; Simpson et al., 2006). A correlation between the radio and the X-ray emission is also observed in star-forming galaxies, however the X-ray luminosity is on average 400 times lower than in AGNs of similar radio luminosity (Ranalli et al., 2003). Here, we investigate whether our data are consistent with the well known FIR-radio and X-ray-radio correlations and whether radio data can help identifying heavily obscured AGNs.
There are 32 sources in our sample detected at 1.4 GHz, six belong to the B sample (three with dubious optical counterparts and three with poorly sampled SEDs). Upper limits to the radio flux are available for 68 sources (2 are in the B sample). Thus, there are 26 radio-detected and 66 non-detected sources in sample A. Radio data can be used to identify the presence of an AGN by looking for an excess of radio emission compared to the optical and/or the IR flux. According to Stocke et al. (1992), radio-loud AGNs are characterized by a radio over optical ratio, , greater than 100222The definition of radio-loud based on the parameter =F5GHz/F2500Å depends on whether the parameter is k-corrected and on what spectral indexes are assumed in the optical and in the radio. Typical values are Log0.5 for radio-quiet and Log2 for radio-loud objects (Stocke et al., 1992).. We derive the radio flux at 5 GHz assuming a spectral index =0.8 (F), and the optical flux by interpolating the observed data at the wavelength corresponding to 2500Å rest-frame. Seven sources have 100 (XMDS seq: 18, 58, 111, 120, 403, 747, and 1219) of which two (XMDS seq: 403, and 1219) are optically blank and five are in sample B (XMDS ID: 111, 120, 403, 747, and 1219). We also calculated the parameter defined as /F, and identified a radio excess in all sources with 0.0 (Donley et al., 2005). Five sources satisfy this criterion, XMDS seq: 403, 738, 747, 1219, and 1246. Three sources are selected by both criteria (XMDS seq 403, 747, and 1219), for two (XMDS seq 111, and 120) the parameter can not be derived because there is no IR coverage. In summary, the presence of an excess of radio emission remains uncertain in six sources for which only one of the two criteria is satisfied or can be applied, XMDS seq: 18, 58, 111, 120, 738, and 1246, and it is confirmed by both criteria in 3 sources, XMDS seq: 403, 747, and 1219.
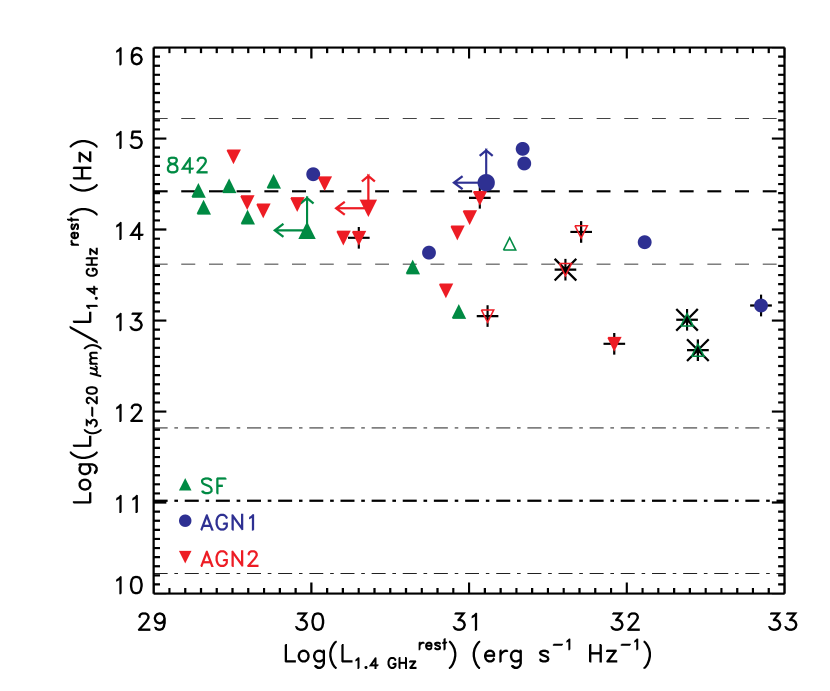
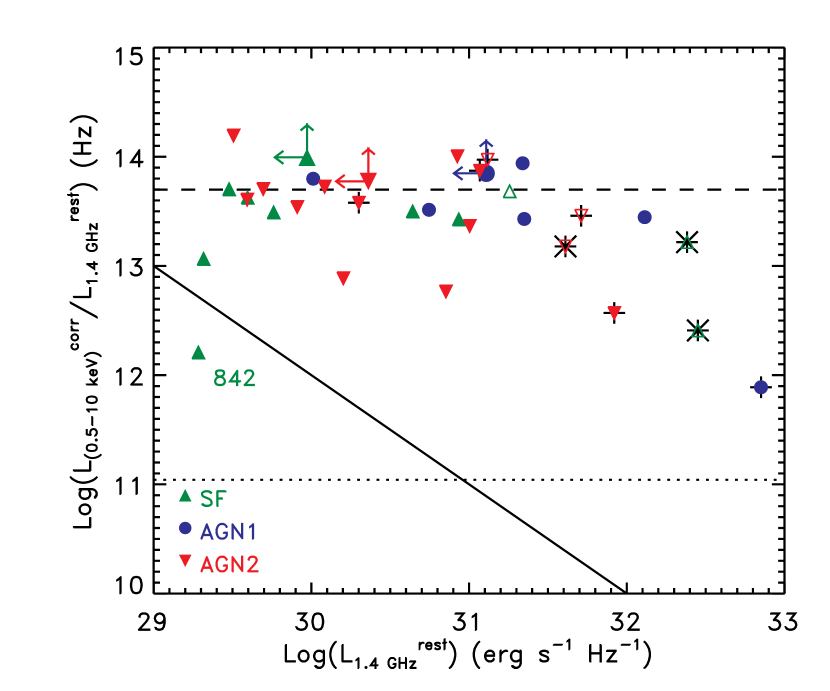
In Figures 12 and 13, we investigate the correlation between the radio luminosity and the mid-IR and X-ray luminosity by comparing the ratio between the rest-frame integrated mid-IR (3–20 m) and absorption-corrected rest-frame broad-band (0.5–10 keV) X-ray luminosities and the rest-frame radio luminosity at 1.4 GHz with the rest-frame radio luminosity at 1.4 GHz for the 32 X-ray sources that are detected at radio wavelengths. We show the luminosity ratio to remove the redshift effect. The 9 radio-loud objects are shown as black plus signs, and crosses are over-plotted on the 3 more secure radio-loud AGNs. The 6 sources in sample B are shown as open symbols. Although these sources are classified as radio-loud by the criteria described above, based on their radio-to-MIR and radio-to-X-ray luminosity ratios, it would be more appropriate to consider them as radio-intermediate AGNs. For clarity we do not report sources that are not radio-detected, but for each class we show the median upper limit to the radio luminosity and to the luminosity ratio obtained from the non-detected sources.
In Figure 12, we test whether our sample shows the same correlation between the far-IR (60 m) luminosity and the radio luminosity at 5 GHz as observed in local radio-quiet and radio-loud AGNs (Sopp & Alexander, 1991). We converted the monochromatic luminosity at 5 GHz to that at 1.4 GHz assuming a radio spectral index =0.5 () as in Sopp & Alexander (1991) and the monochromatic luminosity at 60 m to the mid-IR luminosity using the following equation, , derived from the templates that fit the SEDs of our sample. The expected relationships are: for the radio-loud sources and for the radio-quiet ones, where is in erg s-1 Hz-1 and in . The two relationships are shown in Figure 12 as thick dashed (radio-quiet) and dot-dashed (radio-loud) lines. The thin lines represent the dispersion associated with the conversion from to . Most of the radio-quiet sources in our sample follow the expected correlation. The Spearman correlation rank between the radio and the mid-IR luminosities is =0.84 and the probability is 1. The lowest luminosity ratios are observed for the sources considered radio-loud based on the optical/radio or the IR/radio flux ratios, however they all show higher ratios than expected for radio-loud sources (dot-dashed line in Figure 12).
We find a similarly strong correlation between the rest-frame radio luminosity at 1.4 GHz and the absorption-corrected rest-frame broad-band (0.5–10 keV) X-ray luminosity (Spearman rank correlation coefficient =0.91 and probability of its deviation from zero 1.910-10). We compared the measured relationship with that found for radio-quiet AGNs (Simpson et al., 2006; Brinkmann et al., 2000) (dashed line). The expected relationship has been derived from the correlation observed between the monochromatic luminosities at 5 GHz and at 2 keV of a sample of radio-quiet () sources from the ROSAT-FIRST sample (Brinkmann et al., 2000). The radio luminosity has been converted to assuming a radio spectral index of 0.7 and the X-ray luminosity at 2 keV has been converted to assuming a spectral index =0.8 as assumed in Brinkmann et al. (2000). The final relationship is (see also Simpson et al., 2006) and is shown as a dashed line in Figure 13. The source in our sample show luminosity ratios consistent with those expected based on this relationship.
The agreement with correlations derived from samples selected in different energy bands, and at different flux limits, reinforces the validity of these correlations. Since the radio luminosity can be considered an isotropic indicator of the nuclear unabsorbed X-ray luminosity for radio-quiet AGNs, these correlations can be used to probe the unabsorbed X-ray luminosity of radio-quiet AGNs and to identify absorption effects in X-ray observed AGNs, similarly to the analysis based on the [O III] 5007 luminosity (see e.g. Mulchaey et al., 1994; Alonso-Herrero et al., 1997; Turner et al., 1997; Maiolino et al., 1998; Risaliti et al., 1999; Bassani et al., 1999).
The XMDS sample offers an opportunity for such an application. Source XMDS ID 842 does not follow any of the correlations between the X-ray and the radio luminosities expected for AGNs or star-forming galaxies. Because of its low X-ray luminosity, lower than 1042 , the evidence for AGN activity from the X-rays in this sources it is only based on the hardness of its X-ray spectrum. However, its radio over X-ray luminosity ratio is 10 times larger than what expected for normal star-forming galaxies (Ranalli et al., 2003), supporting the assumption that this source is an AGN. This behaviour suggests that the X-ray luminosity might be underestimated by a factor of 40, a hypothesis that would indicate that the source is Compton-thick and the observed X-ray emission is only scattered light. This source will be observed with the -ray observatory, INTEGRAL, as part of a 2 Msec survey of the XMM-LSS field (Virani et al., 2005). We estimate the luminosity and expected flux in the energy range 20-100 keV, where INTEGRAL is sensitive, to determine whether INTEGRAL will be able to detect it. Assuming that the absorption-corrected rest-frame 0.5–10 keV luminosity is 40 times higher, the derived luminosity is =2.91043 , which corresponds to an absorption corrected flux , and an observed flux assuming a column density of 1024 . So far, INTEGRAL has not detected AGNs at these flux levels (Beckmann et al., 2006; Bassani et al., 2006), however the long XMM-LSS exposure might be able to reveal the heavily obscured AGNs in source XMDS seq 842 (aka Arp 54).
10 Discussion
10.1 AGN identification through SED fitting
In this work, we have characterized the SEDs of a hard X-ray selected sample of AGNs. As previously found (see e.g. Alexander et al., 2001b, a, 2002; Fadda et al., 2002; Perola et al., 2004; Szokoly et al., 2004; Franceschini et al., 2005; Polletta et al., 2006), the multi-wavelength SEDs of X-ray selected AGNs show a wide variety of properties. We divide the SEDs in three broad classes, AGN1, AGN2, and SF. The fraction of AGNs that fall into the various SED classes likely depends on the sample selection, i.e. spectral window and flux limit. For example, an optically selected sample will have a larger fraction of AGN1s and an IR-selected sample will be biased against AGNs in the SF class. A different X-ray flux limit or a selection in a different X-ray band can also alter the fraction of sources in the various classes. For example, Franceschini et al. (2005) finds 39% AGN1s, 23% AGN2s and 38% SFs in a sample of AGNs with broad X-ray fluxes . If the classification of the sources fitted with a Mrk 231 template in Franceschini et al. (2005) is modified from AGN1 to AGN2 as assumed here, the fractions become 15% of AGN1s, 42% of AGN2s, and 36% of SFs. The AGN1 fraction is lower than ours (15 33%), the fraction of AGN2s is slightly lower than ours (42 50%) and the fraction of SFs is twice ours (36 17%). These differences are likely due to our higher X-ray flux limit and requirement of detection in the hard X-ray band (2-10 keV). There is indeed an indication for the fraction of AGN1s to decrease and the fraction of SFs to increase at fainter X-ray fluxes (see Paper II for a more detailed analysis). The trend of having less AGN1s and more SFs at lower X-ray flux levels has to be confirmed and better quantified using similarly selected samples with analogous classification covering a broad range of fluxes.
Although hard X-ray samples, as the one used here, provide the least biased AGN samples, some AGN, e.g. Compton-thick AGNs are still missed. However, we do not expect the SEDs of Compton-thick AGNs to fall in a separate class. Known Compton-thick AGNs, both in the local universe and at high redshifts, show SEDs that are consistent with the AGN2 (e.g. Mrk 231, NGC 1068) and SF classes (e.g. NGC 4945, NGC 6240). From the SED analysis of a sample of X-ray selected Compton-thick AGNs, Polletta et al. (2006) estimates that 60% of Compton-thick AGNs fall in the SF class, and 40% in the AGN2 class. Thus, through SED fitting we can identify a large fraction of AGNs, even Compton-thick AGNs. The SED fitting technique provides an efficient AGN identification tool. The main advantage is that it is based on data that can be more easily obtained than X-ray data and spectroscopic data. Moreover, this technique identifies the same or an even higher fraction of AGNs than the spectroscopic classification. Based on the sample of 49 spectroscopically identified XMDS sources, we estimate that the SED fitting technique is able to identify AGN activity in 8 out of 11 (73%) AGNs that are spectroscopically classified as star-forming galaxies, in 7 out of 12 (58%) AGNs that are spectroscopically classified as type 2 AGNs, and in 25 out of 26 (96%) AGNs that are spectroscopically classified as type 1 AGNs. Overall, we identify AGN activity in 40 out of 49 (82%) hard X-ray selected AGNs with available spectroscopic data and in 83% (50% of AGN2s and 33% of AGN1s) in the entire X-ray sample, while optical spectroscopy reveals an AGN in 38 sources (78%). The SED fitting technique can be applied to sources that are too faint at optical wavelengths for optical spectroscopic observations, or with emission lines that are diluted by the host galaxy light or affected by obscuration (Moran et al., 2002; Barger et al., 2001; Rigby et al., 2006), and to sources in the redshift desert. There is evidence that these source might represent a significant fraction of AGN samples. Thus, SED fitting represents a powerful and efficient tool to identify AGN activity in samples for which optical spectroscopic observations are unavailable or impossible to perform.
However, this technique has also some limitations. Almost half of type 2 AGNs and a third of star-forming galaxy-like AGNs might still be missed and not identified as AGNs. Moreover, the SED classification can be misled by the more dominant host-galaxy light at optical-near-infrared wavelengths as in many Seyfert 1 galaxies and thus classify a type 1 AGN as AGN2 or SF. These limitations might be overcome if well sampled multi-wavelength SEDs of large AGN samples in various classes with spectroscopic data become available. With such data the AGN templates can be improved and expanded and the SED fitting technique can be refined.
In the next section we discuss the nature of the AGN that are not identified by the SED technique and by optical spectroscopy.
10.2 The nature of elusive AGNs
There are several examples of AGNs in the literature whose optical spectra or broad-band SEDs resemble those of normal galaxies and are, therefore, not identified as AGNs unless probed by X-ray or radio data. We refer to these sources as elusive AGNs (Maiolino et al., 2003). These sources belong to the SF class and might have many properties in common with known categories of elusive AGNs found in the literature, e.g the optically dull discovered in optical samples (Maiolino et al., 2003; Elvis et al., 1981; Rigby et al., 2005), the X-ray Bright Optically Normal Galaxies discovered in X-ray samples (XBONGs; Comastri et al., 2002), the type 3 QSOs found in IR-selected samples (Martínez-Sansigre et al., 2006; Leipski et al., 2007). The rich taxonomy of these categories reflects mostly the wavelengths at which they were discovered, while the scenarios proposed to explain their nature are similar.
The properties of these elusive AGNs are usually explained by two scenarios: 1) heavy obscuration by dust with a large covering factor (Marconi et al., 2000; Fabian, 2004; Dudley & Wynn-Williams, 1997), and/or 2) a radiatively inefficient accretion flow (RIAF) (Yuan & Narayan, 2004). Large dust covering factors obscure the optical emission from the inner regions, thus no narrow emission lines are observed. The inefficient accretion explains the lack of optical and ultraviolet radiation from the accretion disk and of emission lines from the broad and narrow line regions. The existence of unabsorbed XBONGs (Severgnini et al., 2003; Page et al., 2003) in the X-rays disfavors the former hypothesis, although it is likely that both scenarios might be valid. Based on IR and sub-millimetre observations of some of these elusive AGNs (Borys et al., 2005; Alexander et al., 2005a, b; Martínez-Sansigre et al., 2006), it has been proposed that the obscuring dust is associated with a starburst and that these AGNs might be in an early phase of their growth. These objects might have already formed the bulk of their stellar mass, but the central BH has not fully grown and they are accreting at a low rate (Alexander et al., 2005b; Borys et al., 2005). This last scenario combines the two described above. In summary, all these classes of AGNs are either explained by heavy absorption associated with dust with a large covering factor and/or by an inefficiently accreting black hole.
We examine in more detail the properties of 3 SFs for which spectroscopic data are also available and fail in identifying the AGN, XMDS seq 439, 487, and 842. Our goal is to find out what they have in common that might explain their elusiveness and whether we can identify their AGN activity by other means in absence of X-ray data. All three sources are fitted with spiral templates, however XMDS seq 487 shows a small excess of emission in the near-IR with respect to the template. Such an excess is likely due to AGN-heated hot dust. Indeed, a fit with an AGN1 template is one of its secondary solutions. All three sources are absorbed in the X-rays (21022 ) and their X-ray luminosities cover a broad range, from 1041.5 to 1044.4. The MIR-to-radio luminosity ratios of two sources are consistent with those observed in radio-quiet AGNs and normal galaxies, however XMDS seq 439 shows a lower than expected ratio (13.1, compared to the expected 14.4; see Figure 12). This low ratio indicates radio emission in excess, and thus strongly suggests AGN activity. In summary, by using the MIR-to-radio luminosity ratio and the secondary solutions of the SED fits, we can identify AGN activity in 2 of these 3 sources. The AGN nature of the third source, XMDS seq 842, is actually not confirmed (see Sections 3.3 and 9).
Overall, we do not find any evidence for inefficient accretion in SFs. Indeed they can be intrinsically powerful X-ray sources and their X-ray/radio luminosity ratios satisfy the same correlations observed for AGN1s and AGN2s. The results from this study on these sources favor obscuration as the cause of the observed low mid-IR/X-ray luminosity ratios and elusive SEDs. However, an analysis of a larger sample with a broad range of luminosities and a rich multi-wavelength data set and, especially, more discriminating model predictions for various dust distributions and orientations, linked with the X-ray properties, are necessary to investigate whether our results are simply consistent with an orientation effect, or indicate higher dust covering factors or larger dust inner radii.
10.3 The missing AGN population
The cosmic X-ray background is still unresolved at high energies (10 keV). The most recent background synthesis models predict that the missing population is made of sources at intermediate redshifts (1), with hard X-ray spectra (1.4), and moderate luminosities (1043) (Worsley et al., 2005; Gilli et al., 2006). Simpson et al. (2006) suggest that the missing AGN population would be detected at radio wavelengths with fluxes of a few tens of Jy. The expected radio luminosity of an AGN with an X-ray luminosity of 1043 derived using the correlation shown in Figure 13 is about 1029 Hz-1. The observed radio flux, assuming a redshift of 1 as predicted for the bulk of this missing AGN population, would be 2.2 Jy and the observed 0.5–10 keV X-ray flux would be 2.3510-15 if unobscured and reduced by 20%, 50%, or 80% if obscured by a column density of 1022, 1023, or 1024, respectively. The predicted radio fluxes are lower than the limits reached by the deepest radio surveys. Indeed, the r.m.s. of the deepest VLA surveys is 2.7 Jy in the 0.4 SWIRE/Chandra field (Polletta et al., 2006, ; Owen et al., in prep.), and 5.3 Jy in the 0.04 GOODS-North field (Morrison et al., 2006). Thus, the faint radio population is not a good candidate for the missing AGN population. Similar conclusions have been recently derived from stacking the X-ray data of faint radio-selected sources in HDFN (Barger et al., 2007).
11 Summary
Using the large data set from the XMM-LSS, SWIRE, CFHTLS, and VVDS surveys in the XMDS field (Paper I), the properties (SEDs, luminosity and absorption) of a hard X-ray selected sample of 136 X-ray sources are investigated. Photometric redshifts are estimated and spectral types are determined using the Hyper-z code and a library of galaxy and AGN templates using optical and infrared data (Section 3). In this work, we investigate the role of the main parameters responsible for the observed properties of AGN SEDs, host galaxy contribution, gas obscuration, dust absorption, and AGN power. Our analysis is based on multi-wavelength data, on the characterization of the average SEDs, and on the comparison of the luminosities emitted in the main energy windows, optical, mid-IR, X-rays and radio. Out of 136 hard X-ray sources, 132 are AGNs, two are clusters and two are star-forming galaxies. From the AGN sample, we select a sub-sample of 117 AGNs with high quality SEDs. The main results obtained from the analysis of this sample are summarized below.
-
•
AGN SED classification We fit the optical-IR (from 0.37 to 24m) SEDs of the whole sample (134 sources, excluding the two clusters) to estimate photometric redshifts and classify the sources. Spectroscopic data are available for 33 sources. We obtain photometric redshifts with (1+)=0.11 and 6% of outliers. The AGN sample is divided in three classes based on their SEDs, type 1 AGNs (AGN1s) (33%), type 2 AGNs (AGN2) (50%) and star-forming galaxy-like AGNs (SF) (17%) (Section 3.1).
-
•
Average SEDs We derive average SEDs, from hard X-ray to mid-IR wavelengths, for each AGN class (Section 4). AGN1s show AGN-dominated SEDs from optical to infrared wavelengths, and mostly unabsorbed X-ray spectra. Their optical spectra show a broad range of extinction, up to =0.55, indicating that the AGN1 class includes some reddened AGNs. In AGN2s, hot dust emission associated with the AGN is detected at mid-infrared wavelengths, and emission from the host galaxy dominates in the optical. They show a broad range of X-ray properties, with the majority being absorbed in the X-rays. Sources classified as SFs do not show any AGN signature at optical and infrared wavelengths, they are all absorbed in the X-rays.
-
•
Average SEDs X-ray luminosity and SED class The change in the average SEDs per class as a function of X-ray luminosity is analyzed in Section 7. The comparison of the average SEDs of each class shows that the optical-IR SEDs in the AGN2 and SF classes and the IR SEDs in the AGN1 class redden as the luminosity increases. This reddening is consistent with a lower relative contribution from the host galaxy to the near-IR luminosity at larger X-ray luminosities.
-
•
X-ray IR luminosity The majority of sources with high X-ray luminosities are AGN1s, while SFs dominate at lower luminosities. No correlation is observed between the X-ray or mid-IR luminosity and the X-ray absorption.
We compare the mid-infrared (3–20 m) over absorption-corrected X-ray luminosity ratio with the X-ray luminosity and with observed values from various AGN samples in the literature. The luminosity ratios are characterized by a wide dispersion as the sources in the literature and we do not find any dependency on the X-ray luminosity. However, we find sources with significantly lower ratios in the SF class. Even lower ratios are found for sub-millimeter detected AGNs. These low ratios are explained by either obscuration in the mid-IR or by lack of hot dust as expected if the dust is located at a relatively large distance, e.g. 10 pc, from the central heating source (Ballantyne et al., 2006). However, other explanations cannot be ruled out with the present data.
-
•
AGN mid-IR colors The analysis of AGN red mid-infrared colors as measured by IRAC reveals that redness is strongly correlated with the AGN class, but also with the X-ray and mid-IR luminosities and does not depend on the X-ray absorption (Section 8). The correlation of the mid-IR redness with the AGN class is likely due to a decreasing host-galaxy contribution from SFs to AGN1s.
-
•
Radio luminosity X-ray and IR luminosities Radio luminosities are compared with the X-ray and mid-infrared luminosities confirming previously known relationships (Brinkmann et al., 2000; Sopp & Alexander, 1991) for AGNs (Section 9). A sub-set of sources shows radio emission in excess compared with the optical and/or mid-IR flux, consistent with begin radio-intermediate. We propose the use of the radio luminosity to identify heavily obscured AGNs by estimating the unabsorbed X-ray luminosity in radio-quiet AGNs and by comparing the estimated flux with the observed X-ray flux.
-
•
AGN identification through SED fitting The SED fitting technique presented here succeeds in identifying signatures in 83% of the objects in the hard X-ray sample. The remaining 17% of AGNs are fitted with star-forming galaxy templates (SF class). A comparison with the spectroscopic classification available for a small sub-sample indicates that the AGN1 class is 100% reliable and 62% complete. The AGN2 class is 29% reliable and 58% complete, and the SF class is 33% reliable and 27% complete. The SED and the spectroscopic classification agree in 53% of the cases.
-
•
The nature of elusive AGNs AGNs in the SF class are elusive AGNs at optical and IR wavelengths, similarly to optically dull AGNs, XBONGs, and type 3 QSOs. The properties of these sources can be simply explained by large obscuration in the mid-IR, however it is not clear whether the large obscuration is an effect of orientation or whether it implies larger covering factors and/or dust at larger distance from the nucleus. We do not find any evidence for inefficient accretion in these sources as they can be powerful X-ray sources.
-
•
The missing AGN population We investigated whether the AGNs still missing from X-ray surveys and responsible for the bulk of the CXRB at high energies (10–30 keV) can be detected at radio wavelengths. The expected radio flux, derived assuming an X-ray luminosity of 1043 and the relationship shown in Figure 13, and =1 is 2.2 Jy. This flux density is lower than the limits reached by the deepest current radio surveys. Thus, they will still be missing even in radio surveys.
The SED analysis of the AGN sample presented here indicates the existence of a large fraction of AGNs that would remain unidentified in optical and/or IR-selected samples (SFs). These elusive AGNs show a broad range of luminosities and they are mostly X-ray absorbed. The evolution of this population needs to be constrained and taken into account in all evolutionary models. In backward evolutionary models, where SEDs are associated with different types of sources (Xu et al., 2001, 2003; Silva et al., 2004; Treister & Urry, 2005), the inclusion of AGNs with SF-like SED will greatly affect the estimated contribution of AGNs at all wavelengths, especially in the mid-IR where AGN-dominated SEDs are much redder than SF SEDs. The identification of these objects would be important in estimating the contribution of accretion energy to the mid-IR background and source counts (Silva et al., 2004; Treister et al., 2006; Ballantyne et al., 2006).
References
- Akiyama et al. (2003) Akiyama, M., Ueda, Y., Ohta, K., Takahashi, T., & Yamada, T. 2003, ApJS, 148, 275
- Akylas et al. (2006) Akylas, A., Georgantopoulos, I., Georgakakis, A., Kitsionas, S., & Hatziminaoglou, E. 2006, A&A, 459, 693
- Alexander et al. (2002) Alexander, D. M., Aussel, H., Bauer, F. E., et al. 2002, ApJ, 568, L85
- Alexander et al. (2005a) Alexander, D. M., Bauer, F. E., Chapman, S. C., et al. 2005a, ApJ, 632, 736
- Alexander et al. (2001a) Alexander, D. M., Brandt, W. N., Hornschemeier, A. E., et al. 2001a, AJ, 122, 2156
- Alexander et al. (2001b) Alexander, D. M., La Franca, F., Fiore, F., et al. 2001b, ApJ, 554, 18
- Alexander et al. (2005b) Alexander, D. M., Smail, I., Bauer, F. E., et al. 2005b, Nature, 434, 738
- Alonso-Herrero et al. (1997) Alonso-Herrero, A., Ward, M. J., & Kotilainen, J. K. 1997, MNRAS, 288, 977
- Appleton et al. (2004) Appleton, P. N., Fadda, D. T., Marleau, F. R., et al. 2004, ApJS, 154, 147
- Arnaud (1996) Arnaud, K. A. 1996, in ASP Conf. Ser. 101: Astronomical Data Analysis Software and Systems V, ed. G. H. Jacoby & J. Barnes, 17
- Babbedge et al. (2004) Babbedge, T. S. R., Rowan-Robinson, M., Gonzalez-Solares, E., et al. 2004, MNRAS, 353, 654
- Ballantyne et al. (2006) Ballantyne, D. R., Shi, Y., Rieke, G. H., et al. 2006, ApJ, 653, 1070
- Barger et al. (2002) Barger, A. J., Cowie, L. L., Brandt, W. N., et al. 2002, AJ, 124, 1839
- Barger et al. (2001) Barger, A. J., Cowie, L. L., Mushotzky, R. F., & Richards, E. A. 2001, AJ, 121, 662
- Barger et al. (2007) Barger, A. J., Cowie, L. L., & Wang, W. . 2007, ApJ, 654, 764
- Barmby et al. (2006) Barmby, P., Alonso-Herrero, A., Donley, J. L., et al. 2006, ApJ, 642, 126
- Bassani et al. (1999) Bassani, L., Dadina, M., Maiolino, R., et al. 1999, ApJS, 121, 473
- Bassani et al. (2006) Bassani, L., Molina, M., Malizia, A., et al. 2006, ApJ, 636, L65
- Beckmann et al. (2006) Beckmann, V., Gehrels, N., Shrader, C. R., & Soldi, S. 2006, ApJ, 638, 642
- Berta (2005) Berta, S. 2005, Ph.D. Thesis, University of Padua, Italy
- Berta et al. (2003) Berta, S., Fritz, J., Franceschini, A., Bressan, A., & Pernechele, C. 2003, A&A, 403, 119
- Bolzonella et al. (2000) Bolzonella, M., Miralles, J.-M., & Pelló, R. 2000, A&A, 363, 476
- Bondi et al. (2003) Bondi, M., Ciliegi, P., Zamorani, G., et al. 2003, A&A, 403, 857
- Borys et al. (2005) Borys, C., Smail, I., Chapman, S. C., et al. 2005, ApJ, 635, 853
- Brandl et al. (2006) Brandl, B. R., Bernard-Salas, J., Spoon, H. W. W., et al. 2006, ApJ, 653, 1129
- Brandt et al. (2001) Brandt, W. N., Alexander, D. M., Hornschemeier, A. E., et al. 2001, AJ, 122, 2810
- Brinkmann et al. (2000) Brinkmann, W., Laurent-Muehleisen, S. A., Voges, W., et al. 2000, A&A, 356, 445
- Brodwin et al. (2006) Brodwin, M., Brown, M. J. I., Ashby, M. L. N., et al. 2006, ApJ, 651, 791
- Bruzual & Charlot (2003) Bruzual, A. G. & Charlot, S. 2003, MNRAS, 344, 1000
- Calzetti et al. (2000) Calzetti, D., Armus, L., Bohlin, R. C., et al. 2000, ApJ, 533, 682
- Chiappetti et al. (2005) Chiappetti, L., Tajer, M., Trinchieri, G., et al. 2005, A&A, 439, 413, (Paper I)
- Ciliegi et al. (2005) Ciliegi, P., Zamorani, G., Bondi, M., et al. 2005, A&A, 441, 879
- Colbert et al. (2004) Colbert, E. J. M., Heckman, T. M., Ptak, A. F., Strickland, D. K., & Weaver, K. A. 2004, ApJ, 602, 231
- Coleman et al. (1980) Coleman, G. D., Wu, C.-C., & Weedman, D. W. 1980, ApJS, 43, 393
- Comastri et al. (2002) Comastri, A., Brusa, M., Ciliegi, P., et al. 2002, Proc. of ‘New New Visions of the X-ray Universe in the XMM-Newton and Chandra Era’, 26-30 November 2001, ESTEC, The Netherlands, [astro-ph/0203019]
- Condon & Broderick (1988) Condon, J. J. & Broderick, J. J. 1988, AJ, 96, 30
- de Jong et al. (1985) de Jong, T., Klein, U., Wielebinski, R., & Wunderlich, E. 1985, A&A, 147, L6
- Devriendt et al. (1999) Devriendt, J. E. G., Guiderdoni, B., & Sadat, R. 1999, A&A, 350, 381
- Dickey & Salpeter (1984) Dickey, J. M. & Salpeter, E. E. 1984, ApJ, 284, 461
- Donley et al. (2006) Donley, J. L., Koribalski, B. S., Staveley-Smith, L., et al. 2006, MNRAS, 369, 1741
- Donley et al. (2005) Donley, J. L., Rieke, G. H., Rigby, J. R., & Pérez-González, P. G. 2005, ApJ, 634, 169
- Dudley & Wynn-Williams (1997) Dudley, C. C. & Wynn-Williams, C. G. 1997, ApJ, 488, 720
- Dye et al. (2006) Dye, S., Eales, S. A., Ashby, M. L. N., et al. 2006, ApJ, 644, 769
- Eckart et al. (2006) Eckart, M. E., Stern, D., Helfand, D. J., et al. 2006, ApJS, 165, 19
- Elvis et al. (1981) Elvis, M., Schreier, E. J., Tonry, J., Davis, M., & Huchra, J. P. 1981, ApJ, 246, 20
- Elvis et al. (1994) Elvis, M., Wilkes, B. J., McDowell, J. C., et al. 1994, ApJS, 95, 1
- Fabian (2004) Fabian, A. C. 2004, in Coevolution of Black Holes and Galaxies, ed. L. C. Ho, 446
- Fadda et al. (2002) Fadda, D., Flores, H., Hasinger, G., et al. 2002, A&A, 383, 838
- Fioc & Rocca-Volmerange (1997) Fioc, M. & Rocca-Volmerange, B. 1997, A&A, 326, 950
- Franceschini et al. (2005) Franceschini, A., Manners, J., Polletta, M. d. C., et al. 2005, AJ, 129, 2074
- Gavignaud et al. (2006) Gavignaud, I., Bongiorno, A., Paltani, S., et al. 2006, A&A, 457, 79
- Giacconi et al. (2002) Giacconi, R., Zirm, A., Wang, J., et al. 2002, ApJS, 139, 369
- Gilli et al. (2006) Gilli, R., Comastri, A., & Hasinger, G. 2006, A&A, 463, 79
- Glikman et al. (2004) Glikman, E., Gregg, M. D., Lacy, M., et al. 2004, ApJ, 607, 60
- Granato & Danese (1994) Granato, G. L. & Danese, L. 1994, MNRAS, 268, 235
- Granato et al. (1997) Granato, G. L., Danese, L., & Franceschini, A. 1997, ApJ, 486, 147
- Gregg et al. (2002) Gregg, M. D., Lacy, M., White, R. L., et al. 2002, ApJ, 564, 133
- Hasinger (2002) Hasinger, G. 2002, Reviews of Modern Astronomy, 15, 71
- Hatziminaoglou et al. (2005) Hatziminaoglou, E., Pérez-Fournon, I., Polletta, M., et al. 2005, AJ, 129, 1198
- Higdon et al. (2005) Higdon, J. L., Higdon, S. J. U., Weedman, D. W., et al. 2005, ApJ, 626, 58
- Horst et al. (2006) Horst, H., Smette, A., Gandhi, P., & Duschl, W. J. 2006, A&A, 457, L17
- Ilbert et al. (2006) Ilbert, O., Arnouts, S., McCracken, H. J., et al. 2006, A&A, 457, 841
- Jarrett et al. (2006) Jarrett, T. H., Polletta, M., Fournon, I. P., et al. 2006, AJ, 131, 261
- Kim et al. (1992a) Kim, D.-W., Fabbiano, G., & Trinchieri, G. 1992a, ApJS, 80, 645
- Kim et al. (1992b) Kim, D.-W., Fabbiano, G., & Trinchieri, G. 1992b, ApJ, 393, 134
- Kitsionas et al. (2005) Kitsionas, S., Hatziminaoglou, E., Georgakakis, A., & Georgantopoulos, I. 2005, A&A, 434, 475
- Lacy et al. (2006) Lacy, M., Petric, A., Sajina, A., et al. 2006, AJ, 133, 186
- Lacy et al. (2004) Lacy, M., Storrie-Lombardi, L. J., Sajina, A., et al. 2004, ApJS, 154, 166
- Lawrence (1991) Lawrence, A. 1991, MNRAS, 252, 586
- Lawrence et al. (2006) Lawrence, A. and Warren, S. J. and Almaini, O., et al. 2006, MNRASsubmitted [astro-ph/0604426]
- Le Fèvre et al. (2004) Le Fèvre, O., Mellier, Y., McCracken, H. J., et al. 2004, A&A, 417, 839
- Le Fèvre et al. (2005) Le Fèvre, O., Vettolani, G., Garilli, B., et al. 2005, A&A, 439, 845
- Leipski et al. (2007) Leipski, C., Haas, M., Meusinger, H., et al. 2007, å, accepted [astro-ph/0701840]
- Lonsdale et al. (2004) Lonsdale, C., Polletta, M. d. C., Surace, J., et al. 2004, ApJS, 154, 54
- Lonsdale et al. (2003) Lonsdale, C. J., Smith, H. E., Rowan-Robinson, M., et al. 2003, PASP, 115, 897
- Lutz et al. (2004) Lutz, D., Maiolino, R., Spoon, H. W. W., & Moorwood, A. F. M. 2004, A&A, 418, 465
- Maiolino et al. (2003) Maiolino, R., Comastri, A., Gilli, R., et al. 2003, MNRAS, 344, L59
- Maiolino et al. (1998) Maiolino, R., Salvati, M., Bassani, L., et al. 1998, A&A, 338, 781
- Marconi et al. (2000) Marconi, A., Oliva, E., van der Werf, P. P., et al. 2000, A&A, 357, 24
- Martínez-Sansigre et al. (2006) Martínez-Sansigre, A., Rawlings, S., Lacy, M., et al. 2006, MNRAS, 370, 1479
- McCracken et al. (2003) McCracken, H. J., Radovich, M., Bertin, E., et al. 2003, A&A, 410, 17
- Moran et al. (2002) Moran, E. C., Filippenko, A. V., & Chornock, R. 2002, ApJ, 579, L71
- Morrison et al. (2006) Morrison, G., Dickinson, M., Owen, F., et al. 2006, ASP Conference Series of ‘The Spitzer Science Center 2005 Conference: Infrared Diagnostics of Galaxy Evolution’, [astro-ph/0603412]
- Mulchaey et al. (1994) Mulchaey, J. S., Koratkar, A., Ward, M. J., et al. 1994, ApJ, 436, 586
- Page et al. (2003) Page, M. J., McHardy, I. M., Gunn, K. F., et al. 2003, Astronomische Nachrichten, 324, 101
- Perola et al. (2004) Perola, G. C., Puccetti, S., Fiore, F., et al. 2004, A&A, 421, 491
- Persic et al. (2004) Persic, M., Rephaeli, Y., Braito, V., et al. 2004, A&A, 419, 849
- Pierre et al. (2004) Pierre, M., Valtchanov, I., Altieri, B., et al. 2004, Journal of Cosmology and Astro-Particle Physics, 9, 11
- Pierre et al. (2007) Pierre, M., et al. 2007, MNRAS, submitted
- Polletta et al. (2006) Polletta, M., Wilkes, B. J., Siana, B., et al. 2006, ApJ, 642, 673
- Ranalli et al. (2003) Ranalli, P., Comastri, A., & Setti, G. 2003, A&A, 399, 39
- Rigby et al. (2006) Rigby, J. R., Rieke, G. H., Donley, J. L., Alonso-Herrero, A., & Pérez-González, P. G. 2006, ApJ, 645, 115
- Rigby et al. (2005) Rigby, J. R., Rieke, G. H., Pérez-González, P. G., et al. 2005, ApJ, 627, 134
- Risaliti et al. (1999) Risaliti, G., Maiolino, R., & Salvati, M. 1999, ApJ, 522, 157
- Rosati et al. (2002) Rosati, P., Tozzi, P., Giacconi, R., et al. 2002, ApJ, 566, 667
- Rowan-Robinson et al. (2005) Rowan-Robinson, M., Babbedge, T., Surace, J., et al. 2005, AJ, 129, 1183
- Roy et al. (1998) Roy, A. L., Norris, R. P., Kesteven, M. J., Troup, E. R., & Reynolds, J. E. 1998, MNRAS, 301, 1019
- Sanders et al. (1989) Sanders, D. B., Phinney, E. S., Neugebauer, G., Soifer, B. T., & Matthews, K. 1989, ApJ, 347, 29
- Severgnini et al. (2003) Severgnini, P., Caccianiga, A., Braito, V., et al. 2003, A&A, 406, 483
- Silva et al. (1998) Silva, L., Granato, G. L., Bressan, A., & Danese, L. 1998, ApJ, 509, 103
- Silva et al. (2004) Silva, L., Maiolino, R., & Granato, G. L. 2004, MNRAS, 355, 973
- Simpson et al. (2006) Simpson, C., Rawlings, S., & Martínez-Sansigre, A. 2006, Astronomische Nachrichten, 327, 270
- Sopp & Alexander (1991) Sopp, H. M. & Alexander, P. 1991, MNRAS, 251, 14P
- Spergel et al. (2003) Spergel, D. N., Verde, L., Peiris, H. V., et al. 2003, ApJS, 148, 175
- Stern et al. (2004) Stern, D., van Dokkum, P. G., Nugent, P., et al. 2004, ApJ, 612, 690
- Stocke et al. (1992) Stocke, J. T., Morris, S. L., Weymann, R. J., & Foltz, C. B. 1992, ApJ, 396, 487
- Sturm et al. (2006) Sturm, E., Hasinger, G., Lehmann, I., et al. 2006, ApJ, 642, 81
- Szokoly et al. (2004) Szokoly, G. P., Bergeron, J., Hasinger, G., et al. 2004, ApJS, 155, 271
- Tajer et al. (2007) Tajer, M., Polletta, M., Chiappetti, L. Maraschi, L., et al. 2007, A&A, accepted (Paper II)
- Treister & Urry (2005) Treister, E. & Urry, C. M. 2005, ApJ, 630, 115
- Treister et al. (2004) Treister, E., Urry, C. M., Chatzichristou, E., et al. 2004, ApJ, 616, 123
- Treister et al. (2006) Treister, E., Urry, C. M., Van Duyne, J., et al. 2006, ApJ, 640, 603
- Turner et al. (1997) Turner, T. J., George, I. M., Nandra, K., & Mushotzky, R. F. 1997, ApJ, 488, 164
- Ueda et al. (2003) Ueda, Y., Akiyama, M., Ohta, K., & Miyaji, T. 2003, ApJ, 598, 886
- Urrutia et al. (2005) Urrutia, T., Lacy, M., Gregg, M. D., & Becker, R. H. 2005, ApJ, 627, 75
- Virani et al. (2005) Virani, S. N., Treister, E., Urry, C. M., et al. 2005, Bulletin of the American Astronomical Society, 37, 1190
- Weedman et al. (2006) Weedman, D. W., Le Floc’h, E., Higdon, S. J. U., Higdon, J. L., & Houck, J. R. 2006, ApJ, 638, 613
- Wilkes & Elvis (1987) Wilkes, B. J. & Elvis, M. 1987, ApJ, 323, 243
- Wilkes et al. (2005) Wilkes, B. J., Pounds, K. A., Schmidt, G. D., et al. 2005, ApJ, 634, 183
- Wilkes et al. (2002) Wilkes, B. J., Schmidt, G. D., Cutri, R. M., et al. 2002, ApJ, 564, L65
- Worsley et al. (2005) Worsley, M. A., Fabian, A. C., Bauer, F. E., et al. 2005, MNRAS, 357, 1281
- Xu et al. (2001) Xu, C., Lonsdale, C. J., Shupe, D. L., O’Linger, J., & Masci, F. 2001, ApJ, 562, 179
- Xu et al. (2003) Xu, C. K., Lonsdale, C. J., Shupe, D. L., et al. 2003, ApJ, 587, 90
- Yuan & Narayan (2004) Yuan, F. & Narayan, R. 2004, ApJ, 612, 724
| XMDS seq | Source Name | Sp. type | N | LBX | L | L | L1.4GHz | Lmid-IR | SED type | SED Class | Comment | |||
|---|---|---|---|---|---|---|---|---|---|---|---|---|---|---|
| 1022 cm-2 | erg s-1 | erg s-1 Hz-1 | L⊙ | |||||||||||
| 4 | XMDS J022521.0043949 | 0.245 | 0.265aaSpectroscopic redshift from Garcet et al., in prep. | 2 | 0.757 | 43.29 | 43.42 | 43.22 | 29.21 | 43.57 | 0.40 | Sb | SF | … |
| 12 | XMDS J022544.9043735 | 3.597 | 3.589bbSpectroscopic redshift from Gavignaud et al. (2006). | 1 | 29.825 | 45.54 | 45.67 | 45.42 | 31.86 | 46.31 | 0.55 | TQSO1 | AGN1 | … |
| 13 | XMDS J022504.5043707 | 1.103 | … | … | 3.287 | 44.32 | 44.45 | 44.20 | 30.66 | 45.08 | 0.05 | Mrk231 | AGN2 | … |
| 16 | XMDS J022506.4043621 | 0.850 | … | … | 0.129 | 43.97 | 43.97 | 43.68 | 30.39 | 44.46 | 0.20 | Sey18 | AGN2 | … |
| 18 | XMDS J022510.6043549 | 1.612 | … | … | 1.917 | 44.89 | 44.94 | 44.71 | 31.07 | 45.42 | 0.10 | I19254 | AGN2 | … |
| 29 | XMDS J022521.0043228 | 0.868 | … | … | 2.663 | 43.79 | 43.93 | 43.68 | 30.42 | 44.41 | 0.10 | Arp220 | SF | … |
| 36 | XMDS J022449.8043026 | 1.043 | … | … | 1.773 | 44.44 | 44.53 | 44.32 | 30.61 | 45.12 | 0.50 | BQSO1 | AGN1 | … |
| 40 | XMDS J022510.6042928 | 1.955 | … | … | 27.436 | 44.92 | 45.14 | 44.91 | 31.25 | 45.73 | 0.40 | Mrk231 | AGN2 | … |
| 55 | XMDS J022522.8042648 | 1.135 | 1.029aaSpectroscopic redshift from Garcet et al., in prep. | 2 | 4.359 | 44.21 | 44.37 | 44.19 | 31.00 | 45.14 | 0.25 | QSO2 | AGN2 | … |
| 58 | XMDS J022436.2042511 | 0.645 | … | … | 1.760 | 43.74 | 43.88 | 43.63 | 30.30 | 44.21 | 0.10 | Mrk231 | AGN2 | … |
| 60 | XMDS J022439.6042401 | 0.203 | 0.478aaSpectroscopic redshift from Garcet et al., in prep. | 2 | 0.072 | 43.81 | 43.81 | 43.61 | 30.08 | 44.59 | 0.00 | QSO2 | AGN2 | … |
| 67 | XMDS J022537.0042132 | 0.961 | … | … | 0.150 | 44.38 | 44.37 | 44.05 | 30.52 | 45.18 | 0.15 | BQSO1 | AGN1 | … |
| 71 | XMDS J022511.9041911 | 1.401 | … | … | 8.182 | 44.78 | 44.95 | 44.72 | 30.91 | 45.54 | 0.55 | Mrk231 | AGN2 | … |
| 91 | XMDS J022710.0041649 | 1.005 | … | … | 0.159 | 44.25 | 44.25 | 44.07 | 30.57 | 44.27 | 0.30 | Sey18 | AGN2 | B |
| 0.396 | … | … | 0.062 | 43.26 | 43.27 | 43.09 | 29.61 | 43.64 | 0.15 | spi1_4 | SF | B | ||
| 94 | XMDS J022643.8041626 | 0.349 | … | … | 1.229 | 43.44 | 43.70 | 43.46 | 29.48 | 44.34 | 0.00 | QSO2 | AGN2 | … |
| 101 | XMDS J022809.4041524 | 0.874 | … | … | 0.134 | 44.24 | 44.24 | 44.03 | … | 43.69 | 0.00 | Sb | SF | No IR |
| 106 | XMDS J022719.5041407 | 0.387 | … | … | 10.289 | 42.73 | 43.09 | 42.83 | 30.20 | 44.11 | 0.55 | I22491 | AGN2 | … |
| 111 | XMDS J022735.6041317 | 2.015 | … | … | 5.069 | 45.08 | 45.17 | 45.00 | 31.71 | 45.68 | 0.00 | I19254 | AGN2 | B, No IR |
| 2.514 | … | … | 7.548 | 45.32 | 45.40 | 45.23 | 31.93 | 44.40 | 0.00 | Sc | SF | B, No IR | ||
| 112 | XMDS J022809.0041232 | 0.900 | 0.878aaSpectroscopic redshift from Garcet et al., in prep. | 1 | 0.386 | 45.08 | 45.12 | 44.87 | … | 45.86 | 0.55 | TQSO1 | AGN1 | No IR |
| 114 | XMDS J022649.7041240 | 0.375 | … | … | 0.060 | 43.22 | 43.22 | 42.99 | 29.60 | 43.73 | 0.15 | Sc | SF | … |
| 118 | XMDS J022649.3041154 | 1.195 | 1.157bbSpectroscopic redshift from Gavignaud et al. (2006). | 1 | 0.193 | 44.38 | 44.37 | 44.05 | 30.71 | 44.55 | 0.20 | Sey18 | AGN2 | … |
| 120 | XMDS J022735.7041122 | 1.167 | … | … | 0.732 | 45.05 | 45.09 | 44.84 | 31.12 | 44.17 | 0.00 | Sey2 | AGN2 | B, No IR |
| 1.078 | … | … | 0.656 | 44.96 | 45.00 | 44.76 | 31.03 | 44.61 | 0.15 | Sey18 | AGN2 | B, No IR | ||
| 124 | XMDS J022659.7041108 | 0.371 | … | … | 6.730 | 43.09 | 43.40 | 43.14 | 29.54 | 43.92 | 0.10 | QSO2 | AGN2 | … |
| 133 | XMDS J022713.1040912 | 0.723 | … | … | 1.200 | 43.91 | 44.00 | 43.74 | 30.23 | 43.86 | 0.10 | QSO2 | AGN2 | M |
| 134 | XMDS J022701.3040912 | 0.755 | … | … | 0.113 | 43.74 | 43.74 | 43.52 | 30.27 | 44.48 | 0.00 | Sey18 | AGN2 | … |
| 138 | XMDS J022656.0040821 | 0.546 | … | … | 7.348 | 43.17 | 43.45 | 43.20 | 29.94 | 44.19 | 0.00 | Sey2 | AGN2 | … |
| 139 | XMDS J022727.7040806 | 0.729 | … | … | 0.108 | 44.02 | 44.02 | 43.74 | 30.23 | 44.50 | 0.00 | Sey18 | AGN2 | Bu, No IR |
| 140 | XMDS J022701.3040751 | 0.235 | 0.220aaSpectroscopic redshift from Garcet et al., in prep. | 2 | 0.101 | 43.01 | 43.05 | 42.86 | 29.03 | 43.53 | 0.25 | Sd | SF | … |
| 142 | XMDS J022644.1040720 | 0.573 | … | … | 0.085 | 43.81 | 43.81 | 43.53 | 30.01 | 44.62 | 0.50 | BQSO1 | AGN1 | … |
| 143 | XMDS J022655.4040650 | 0.374 | … | … | 2.817 | 42.98 | 43.20 | 42.95 | 29.59 | 43.89 | 0.35 | QSO2 | AGN2 | … |
| 144 | XMDS J022652.0040556 | 0.864 | … | … | 0.132 | 44.28 | 44.28 | 44.09 | 30.41 | 44.59 | 0.00 | Sey18 | AGN2 | … |
| 149 | XMDS J022707.2040438 | 0.493 | … | … | 0.169 | 43.47 | 43.50 | 43.26 | 29.83 | 44.31 | 0.55 | Sey18 | AGN2 | … |
| 161 | XMDS J022700.7042020 | 0.086 | 0.053ccSpectroscopic redshift from Lacy et al. (2006). | 1 | 0.030 | 42.83 | 42.84 | 42.44 | 27.95 | 43.51 | 0.00 | QSO2 | AGN2 | … |
| 178 | XMDS J022544.6041936 | 0.059 | … | … | 0.223 | 41.82 | 41.90 | 41.66 | 27.81 | 42.07 | 0.10 | S0 | SF | … |
| 179 | XMDS J022607.7041843 | 0.328 | 0.495aaSpectroscopic redshift from Garcet et al., in prep. | 1 | 0.074 | 44.29 | 44.29 | 44.05 | 29.84 | 44.68 | 0.45 | BQSO1 | AGN1 | … |
| 191 | XMDS J022626.5041214 | 0.779 | … | … | 19.818 | 44.11 | 44.44 | 44.18 | 30.30 | 44.98 | 0.55 | QSO2 | AGN2 | … |
| 197 | XMDS J022539.0040823 | 0.824 | … | … | 9.338 | 44.02 | 44.27 | 44.02 | 30.36 | 44.76 | 0.55 | Sey18 | AGN2 | … |
| 199 | XMDS J022614.5040738 | 2.411 | … | … | 37.558 | 45.15 | 45.36 | 45.12 | 31.47 | 45.35 | 0.00 | QSO2 | AGN2 | Bu, M |
| 227 | XMDS J022511.4041916 | 1.446 | … | … | 11.553 | 44.74 | 44.94 | 44.69 | 30.95 | 44.59 | 0.20 | N6090 | SF | B |
| 1.683 | … | … | 14.693 | 44.91 | 45.10 | 44.85 | 31.10 | 44.79 | 0.50 | TQSO1 | AGN1 | B | ||
| 229 | XMDS J022406.4041830 | 1.128 | … | … | 54.869 | 44.27 | 44.69 | 44.43 | 30.69 | 44.54 | 0.05 | N6090 | SF | … |
| 232 | XMDS J022449.2041800 | 0.581 | … | … | 0.086 | 43.75 | 43.75 | 43.46 | 30.00 | 44.01 | 0.00 | Sey18 | AGN2 | … |
| 233 | XMDS J022456.0041725 | 1.293 | … | … | 1.114 | 44.45 | 44.50 | 44.25 | 30.83 | 44.83 | 0.55 | TQSO1 | AGN1 | Bu |
| 242 | XMDS J022437.8041520 | 1.051 | … | … | 5.200 | 44.07 | 44.24 | 43.99 | 30.61 | 44.14 | 0.55 | spi1_4 | SF | … |
| 246 | XMDS J022415.6041416 | 2.106 | … | … | 2.382 | 45.18 | 45.22 | 44.97 | 31.33 | 45.84 | 0.50 | QSO1 | AGN1 | … |
| 253 | XMDS J022451.9041209 | 1.686 | … | … | 0.341 | 44.79 | 44.78 | 44.55 | 31.35 | 46.08 | 0.15 | TQSO1 | AGN1 | … |
| 255 | XMDS J022408.4041149 | 1.929 | … | … | 30.718 | 44.70 | 44.94 | 44.69 | 31.26 | 45.10 | 0.05 | Arp220 | SF | B |
| 0.357 | … | … | 4.156 | 42.90 | 43.15 | 42.91 | 29.50 | 43.16 | 0.10 | Sd | SF | B | ||
| 258 | XMDS J022447.4041049 | 2.628 | … | … | 21.429 | 45.08 | 45.23 | 44.98 | 31.55 | 45.55 | 0.00 | QSO1 | AGN1 | … |
| 270 | XMDS J022449.2040841 | 0.958 | … | … | 2.446 | 43.91 | 44.03 | 43.78 | 30.52 | 44.27 | 0.00 | Sey18 | AGN2 | … |
| 271 | XMDS J022509.5040836 | 2.042 | … | … | 0.471 | 44.99 | 44.98 | 44.74 | 31.30 | 45.84 | 0.40 | BQSO1 | AGN1 | … |
| 272 | XMDS J022501.6040752 | 0.797 | … | … | 0.120 | 44.10 | 44.11 | 43.89 | 30.33 | 44.98 | 0.25 | BQSO1 | AGN1 | … |
| 279 | XMDS J022421.3040607 | 0.260 | … | … | 1.172 | 42.77 | 42.94 | 42.69 | 29.19 | 44.00 | 0.35 | QSO2 | AGN2 | … |
| 280 | XMDS J022417.9040606 | 1.633 | … | … | 16.445 | 44.59 | 44.80 | 44.55 | 31.07 | 44.65 | 0.20 | TQSO1 | AGN1 | … |
| 281 | XMDS J022503.2040538 | 0.930 | … | … | 0.061 | 44.61 | 44.61 | 44.36 | 30.49 | 44.57 | 0.00 | Sey18 | AGN2 | … |
| 282 | XMDS J022452.1040518 | 0.189 | … | … | 0.041 | 42.95 | 42.96 | 42.66 | 28.88 | 43.69 | 0.20 | QSO1 | AGN1 | … |
| 288 | XMDS J022421.2040351 | 0.566 | … | … | 1.298 | 43.61 | 43.73 | 43.48 | 29.97 | 43.36 | 0.35 | spi2a_12 | SF | … |
| 291 | XMDS J022452.0040258 | 0.269 | … | … | 54.378 | 42.71 | 43.40 | 43.14 | 29.69 | 43.90 | 0.00 | QSO2 | AGN2 | M |
| 330 | XMDS J022333.0041525 | 2.271 | … | … | 71.370 | 44.73 | 45.03 | 44.78 | … | 45.60 | 0.00 | QSO2 | AGN2 | … |
| 351 | XMDS J022356.5041105 | 0.927 | … | … | 0.679 | 44.06 | 44.10 | 43.86 | … | 44.25 | 0.00 | Sey18 | AGN2 | … |
| 359 | XMDS J022325.3040922 | 1.154 | … | … | 17.337 | 43.93 | 44.20 | 43.95 | … | 44.26 | 0.00 | spi1_4 | SF | … |
| 403 | XMDS J022742.1043607 | 3.493 | … | … | 32.273 | 45.46 | 45.60 | 45.35 | 32.38 | 45.39 | 0.20 | N6090 | SF | Bu |
| 406 | XMDS J022732.7043544 | 0.713 | … | … | 7.860 | 44.01 | 44.26 | 44.02 | 30.75 | 44.49 | 0.55 | TQSO1 | AGN1 | … |
| 414 | XMDS J022726.3043327 | 3.666 | … | … | 10.703 | 45.50 | 45.56 | 45.31 | 31.88 | 46.34 | 0.10 | BQSO1 | AGN1 | … |
| 416 | XMDS J022812.2043230 | 1.668 | … | … | 0.335 | 44.94 | 44.94 | 44.73 | … | 45.00 | 0.05 | BQSO1 | AGN1 | No IR |
| 420 | XMDS J022729.2043225 | 2.357 | 2.290bbSpectroscopic redshift from Gavignaud et al. (2006). | 1 | 0.577 | 45.14 | 45.13 | 44.89 | 31.41 | 46.20 | 0.00 | QSO1 | AGN1 | … |
| 427 | XMDS J022758.6043112 | 0.859 | … | … | 0.131 | 43.91 | 43.91 | 43.68 | 30.40 | 44.80 | 0.00 | I19254 | AGN2 | No IR |
| 430 | XMDS J022737.1043031 | 0.760 | … | … | 0.537 | 43.93 | 43.98 | 43.74 | 30.28 | 43.90 | 0.40 | Sey18 | AGN2 | … |
| 438 | XMDS J022756.3042905 | 0.375 | … | … | 12.691 | 42.76 | 43.15 | 42.89 | 29.55 | 43.58 | 0.00 | Arp220 | SF | No IR |
| 439 | XMDS J022746.0042853 | 1.988 | 1.368ddSpectroscopic redshift from Le Fèvre et al. (2005). | 3 | 13.195 | 44.15 | 44.36 | 44.12 | 30.93 | 44.03 | 0.20 | Sd | SF | … |
| 440 | XMDS J022748.8042820 | 2.574 | … | … | 0.509 | 45.43 | 45.42 | 45.22 | 31.53 | 46.21 | 0.00 | QSO1 | AGN1 | No IR |
| 449 | XMDS J022815.2042617 | 2.504 | … | … | 21.945 | 45.03 | 45.20 | 44.95 | … | 44.60 | 0.40 | spi1_4 | SF | B, No IR |
| 2.438 | … | … | 20.886 | 45.00 | 45.17 | 44.92 | … | 44.57 | 0.00 | Sey18 | AGN2 | B, No IR | ||
| 453 | XMDS J022802.3042546 | 0.568 | … | … | 5.450 | 43.47 | 43.71 | 43.48 | … | 44.35 | 0.30 | QSO2 | AGN2 | No IR |
| 470 | XMDS J022804.5041818 | 1.886 | … | … | 0.411 | 45.01 | 45.00 | 44.79 | … | 45.41 | 0.00 | I19254 | AGN2 | B, No IR |
| 0.418 | … | … | 0.065 | 43.39 | 43.40 | 43.19 | … | 42.51 | 0.00 | spi1_4 | SF | B, No IR, M | ||
| 1.082 | … | … | 0.176 | 44.41 | 44.41 | 44.20 | … | 43.88 | 0.00 | I22491 | AGN2 | B, No IR | ||
| 487 | XMDS J022643.6043317 | 0.489 | 0.308aaSpectroscopic redshift from Garcet et al., in prep. | 3 | 5.507 | 42.95 | 43.25 | 43.00 | 29.76 | 44.29 | 0.20 | spi1_4 | SF | M |
| 498 | XMDS J022629.2043057 | 1.903 | 2.031aaSpectroscopic redshift from Garcet et al., in prep. | 1 | 0.466 | 45.41 | 45.40 | 45.20 | 31.29 | 45.82 | 0.00 | QSO1 | AGN1 | … |
| 503 | XMDS J022649.3042920 | 0.723 | 0.634ddSpectroscopic redshift from Le Fèvre et al. (2005). | 3 | 4.310 | 43.62 | 43.83 | 43.58 | 30.09 | 44.38 | 0.00 | QSO2 | AGN2 | … |
| 505 | XMDS J022649.0042745 | 0.084 | 0.327aaSpectroscopic redshift from Garcet et al., in prep. | 2 | 0.054 | 43.07 | 43.08 | 42.86 | 29.42 | 44.01 | 0.00 | Sey18 | AGN2 | … |
| 521 | XMDS J022658.8042321 | 1.754 | 1.325ddSpectroscopic redshift from Le Fèvre et al. (2005). | 3 | 2.550 | 44.84 | 44.93 | 44.74 | 30.93 | 44.89 | 0.05 | Sey2 | AGN2 | … |
| 523 | XMDS J022622.1042221 | 1.586 | 2.006bbSpectroscopic redshift from Gavignaud et al. (2006). | 1 | 0.456 | 45.40 | 45.39 | 45.11 | 31.28 | 45.96 | 0.00 | BQSO1 | AGN1 | … |
| 551 | XMDS J022342.0043533 | 1.128 | … | … | 1.723 | 44.44 | 44.52 | 44.28 | … | 45.12 | 0.35 | QSO1 | AGN1 | … |
| 561 | XMDS J022424.1043228 | 1.678 | … | … | 0.338 | 45.05 | 45.05 | 44.72 | 31.10 | 45.79 | 0.00 | BQSO1 | AGN1 | … |
| 564 | XMDS J022350.7043157 | 0.224 | … | … | 0.044 | 42.71 | 42.72 | 42.51 | … | 43.57 | 0.00 | Sey18 | AGN2 | … |
| 565 | XMDS J022356.8043115 | 1.051 | … | … | 0.774 | 44.26 | 44.31 | 44.06 | … | 43.98 | 0.55 | spi1_4 | SF | … |
| 567 | XMDS J022432.4043036 | 0.588 | … | … | 0.087 | 43.85 | 43.86 | 43.59 | 30.01 | 44.21 | 0.10 | BQSO1 | AGN1 | … |
| 571 | XMDS J022330.2043004 | 2.404 | 2.666aaSpectroscopic redshift from Garcet et al., in prep. | 1 | 5.506 | 45.40 | 45.45 | 45.21 | … | 46.31 | 0.40 | QSO1 | AGN1 | … |
| 577 | XMDS J022438.9042705 | 0.188 | 0.252ccSpectroscopic redshift from Lacy et al. (2006). | 2 | 0.047 | 43.69 | 43.70 | 43.39 | 29.51 | 44.31 | 0.10 | Sey18 | AGN2 | … |
| 578 | XMDS J022350.7042703 | 1.033 | … | … | 0.165 | 44.22 | 44.22 | 43.88 | … | 44.69 | 0.25 | QSO1 | AGN1 | … |
| 602 | XMDS J022351.2042054 | 0.097 | 0.181aaSpectroscopic redshift from Garcet et al., in prep. | 2 | 2.836 | 42.41 | 42.67 | 42.42 | … | 43.64 | 0.00 | M82 | SF | … |
| 626 | XMDS J022326.0043534 | 1.149 | … | … | 1.191 | 44.63 | 44.69 | 44.45 | … | 44.91 | 0.00 | N6090 | SF | … |
| 708 | XMDS J022605.3045803 | 1.476 | … | … | 0.276 | 44.75 | 44.75 | 44.50 | 30.97 | 44.77 | 0.00 | Sey18 | AGN2 | … |
| 709 | XMDS J022606.7045722 | 0.661 | … | … | 0.098 | 43.91 | 43.91 | 43.60 | 30.13 | 44.26 | 0.00 | Sey18 | AGN2 | … |
| 710 | XMDS J022627.4045710 | 2.320 | … | … | 0.931 | 45.55 | 45.56 | 45.35 | 32.11 | 45.97 | 0.50 | TQSO1 | AGN1 | … |
| 718 | XMDS J022615.1045355 | 0.896 | … | … | 0.900 | 44.08 | 44.14 | 43.94 | 30.64 | 44.23 | 0.45 | spi1_4 | SF | … |
| 720 | XMDS J022628.9045252 | 2.027 | … | … | 0.465 | 45.14 | 45.13 | 44.88 | 31.29 | 45.40 | 0.50 | BQSO1 | AGN1 | … |
| 731 | XMDS J022554.1044921 | 0.534 | … | … | 2.107 | 43.26 | 43.42 | 43.17 | 29.91 | 43.93 | 0.55 | QSO2 | AGN2 | … |
| 738 | XMDS J022556.1044724 | 0.898 | 1.010aaSpectroscopic redshift from Garcet et al., in prep. | 1 | 0.160 | 44.49 | 44.49 | 44.25 | 31.92 | 44.66 | 0.00 | Sey18 | AGN2 | … |
| 739 | XMDS J022617.1044724 | 0.184 | 0.140aaSpectroscopic redshift from Garcet et al., in prep. | 2 | 2.820 | 42.11 | 42.38 | 42.14 | 29.32 | 43.56 | 0.05 | spi1_4 | SF | M |
| 742 | XMDS J022514.3044659 | 1.615 | 1.924aaSpectroscopic redshift from Garcet et al., in prep. | 1 | 0.425 | 45.29 | 45.28 | 45.04 | 31.34 | 46.23 | 0.10 | BQSO1 | AGN1 | … |
| 743 | XMDS J022625.2044647 | 1.556 | … | … | 2.256 | 44.74 | 44.80 | 44.56 | 31.02 | 45.25 | 0.15 | Mrk231 | AGN2 | … |
| 746 | XMDS J022512.6044633 | 0.219 | … | … | 5.213 | 43.04 | 43.36 | 43.10 | 29.02 | 43.02 | 0.55 | Sb | SF | … |
| 747 | XMDS J022640.4044606 | 1.248 | … | … | 23.531 | 44.49 | 44.79 | 44.53 | 31.61 | 45.17 | 0.00 | I19254 | AGN2 | B |
| 1.248 | … | … | 23.531 | 44.49 | 44.79 | 44.53 | 31.61 | 45.17 | 0.00 | I19254 | AGN2 | B | ||
| 748 | XMDS J022610.9044550 | 2.886 | … | … | 12.547 | 45.32 | 45.42 | 45.17 | 31.65 | 45.79 | 0.40 | TQSO1 | AGN1 | … |
| 755 | XMDS J022600.1044412 | 0.730 | … | … | 0.108 | 44.06 | 44.06 | 43.83 | 30.24 | 44.59 | 0.10 | Mrk231 | AGN2 | … |
| 760 | XMDS J022531.4044210 | 0.833 | 1.228ddSpectroscopic redshift from Le Fèvre et al. (2005). | 3 | 150.000ffFixed maximum value of the intrinsic column density. | 45.31 | 46.21 | 45.96 | 30.78 | 44.41 | 0.40 | Sey18 | AGN2 | … |
| 779 | XMDS J022321.8045740 | 0.637 | … | … | 16.471 | 43.93 | 44.28 | 44.02 | … | 45.26 | 0.00 | Mrk231 | AGN2 | … |
| 780 | XMDS J022332.0045740 | 0.963 | … | … | 0.151 | 44.31 | 44.31 | 44.07 | … | 45.04 | 0.00 | Sey18 | AGN2 | … |
| 782 | XMDS J022326.3045708 | 0.839 | 0.826aaSpectroscopic redshift from Garcet et al., in prep. | 1 | 0.125 | 44.12 | 44.12 | 43.98 | … | 44.72 | 0.00 | Sey18 | AGN2 | … |
| 787 | XMDS J022317.9045527 | 0.981 | … | … | 9.800 | 43.91 | 44.14 | 43.90 | … | 43.69 | 0.15 | Sey18 | AGN2 | … |
| 788 | XMDS J022353.7045510 | 0.958 | … | … | 0.085 | 44.58 | 44.58 | 44.36 | … | 44.68 | 0.40 | QSO1 | AGN1 | … |
| 789 | XMDS J022329.1045452 | 0.646 | 0.604aaSpectroscopic redshift from Garcet et al., in prep. | 1 | 0.089 | 43.84 | 43.84 | 43.56 | … | 44.44 | 0.00 | Sey18 | AGN2 | … |
| 800 | XMDS J022403.8045120 | 0.874 | … | … | 0.134 | 44.13 | 44.13 | 43.88 | 30.42 | 44.66 | 0.55 | Sey18 | AGN2 | … |
| 801 | XMDS J022344.4045120 | 0.959 | … | … | 1.167 | 44.09 | 44.16 | 43.92 | … | 44.24 | 0.00 | Sey18 | AGN2 | … |
| 807 | XMDS J022333.0044924 | 2.039 | 2.302aaSpectroscopic redshift from Garcet et al., in prep. | 1 | 2.460 | 45.08 | 45.12 | 44.87 | … | 45.53 | 0.00 | BQSO1 | AGN1 | … |
| 817 | XMDS J022354.5044815 | 2.428 | 2.458aaSpectroscopic redshift from Garcet et al., in prep. | 1 | 0.657 | 45.23 | 45.21 | 44.91 | … | 46.67 | 0.00 | QSO1 | AGN1 | … |
| 820 | XMDS J022319.4044732 | 0.640 | 0.293aaSpectroscopic redshift from Garcet et al., in prep. | 2 | 0.185 | 43.18 | 43.23 | 43.03 | … | 44.27 | 0.00 | QSO2 | AGN2 | … |
| 825 | XMDS J022330.6044633 | 1.735 | … | … | 3.157 | 45.05 | 45.12 | 44.84 | … | 45.34 | 0.10 | Mrk231 | AGN2 | … |
| 828 | XMDS J022318.8044616 | 0.673 | … | … | 0.100 | 43.75 | 43.75 | 43.53 | … | 44.28 | 0.05 | QSO1 | AGN1 | … |
| 840 | XMDS J022330.9044235 | 2.297 | … | … | 13.666 | 45.05 | 45.19 | 44.94 | … | 45.39 | 0.55 | Mrk231 | AGN2 | Bu |
| 842 | XMDS J022402.4044140 | 0.010 | 0.0433eeSpectroscopic redshift from NED. | 3 | 1.761 | 41.26 | 41.49 | 41.24 | 29.28 | 43.71 | 0.30 | Sd | SF | … |
| 844 | XMDS J022343.2044105 | 1.493 | … | … | 60.833 | 44.46 | 44.83 | 44.57 | … | 45.36 | 0.05 | I19254 | AGN2 | B |
| 1.857 | … | … | 86.702 | 44.69 | 45.07 | 44.81 | … | 45.32 | 0.25 | I22491 | AGN2 | B | ||
| 846 | XMDS J022317.2044035 | 0.765 | 0.842aaSpectroscopic redshift from Garcet et al., in prep. | 1 | 0.128 | 44.27 | 44.27 | 44.11 | … | 45.61 | 0.45 | BQSO1 | AGN1 | … |
| 1197 | XMDS J022720.2045738 | 1.116 | … | … | 15.507 | 44.16 | 44.42 | 44.18 | 30.68 | 44.95 | 0.25 | I22491 | AGN2 | … |
| 1199 | XMDS J022651.6045714 | 0.290 | 0.331aaSpectroscopic redshift from Garcet et al., in prep. | 2 | 0.249 | 43.54 | 43.60 | 43.37 | 29.43 | 43.85 | 0.00 | QSO2 | AGN2 | … |
| 1201 | XMDS J022723.4045608 | 0.168 | … | … | 0.295 | 42.28 | 42.36 | 42.12 | 28.77 | 42.39 | 0.00 | Sey18 | AGN2 | … |
| 1219 | XMDS J022701.6045158 | 2.112 | … | … | 25.148 | 44.66 | 44.86 | 44.62 | 32.45 | 45.13 | 0.55 | M82 | SF | Bu |
| 1226 | XMDS J022711.7045038 | 0.946 | … | … | 0.215 | 44.81 | 44.82 | 44.59 | 30.50 | 44.93 | 0.55 | BQSO1 | AGN1 | … |
| 1227 | XMDS J022736.8045033 | 0.445 | … | … | 1.147 | 43.32 | 43.45 | 43.26 | 29.91 | 44.19 | 0.00 | Sey2 | AGN2 | … |
| 1231 | XMDS J022731.9044957 | 0.741 | … | … | 0.110 | 43.62 | 43.62 | 43.39 | 30.85 | 44.18 | 0.30 | Sey18 | AGN2 | … |
| 1236 | XMDS J022729.0044857 | 1.513 | … | … | 14.984 | 44.31 | 44.52 | 44.28 | 30.99 | 45.51 | 0.40 | I19254 | AGN2 | … |
| 1246 | XMDS J022712.8044636 | 1.446 | … | … | 0.267 | 44.74 | 44.74 | 44.48 | 32.85 | 46.02 | 0.00 | BQSO1 | AGN1 | … |
| 1247 | XMDS J022633.1044637 | 1.197 | … | … | 3.040 | 44.56 | 44.68 | 44.42 | 30.75 | 44.91 | 0.00 | QSO2 | AGN2 | … |
| 1248 | XMDS J022725.4044619 | 0.034 | … | … | 0.029 | 41.30 | 41.32 | 41.09 | 27.31 | 42.60 | 0.00 | Sa | SF | M |
| 1252 | XMDS J022716.0044539 | 0.590 | … | … | 0.087 | 44.07 | 44.08 | 43.82 | 30.02 | 44.55 | 0.50 | BQSO1 | AGN1 | … |
| 1264 | XMDS J022751.3044251 | 1.694 | … | … | 0.343 | 44.95 | 44.94 | 44.79 | 31.11 | 45.42 | 0.10 | BQSO1 | AGN1 | … |
| 1265 | XMDS J022712.6044221 | 0.232 | 0.205aaSpectroscopic redshift from Garcet et al., in prep. | 2 | 2.526 | 42.94 | 43.18 | 42.93 | 29.48 | 43.95 | 0.55 | spi1_4 | SF | … |
Note. — XMDS seq: X-ray catalog sequence number (Paper I; Paper II); : photometric redshift; : spectroscopic redshift; Sp. type: spectroscopic classification (1: type 1 AGN, 2: type 2 AGN, 3: star-forming galaxy). N: effective column density (Paper II). Upper limits are derived from the minimum value of 2.61020 corresponding to the Galactic value, when no additional absorption was required; LBX: logarithm of the not corrected for absorption rest-frame broad-band (0.5–10 keV) luminosity; L: logarithm of the absorption-corrected rest-frame broad-band (0.5–10 keV) luminosity; L: logarithm of the absorption-corrected rest-frame hard-band (2–10 keV) luminosity. All X-ray luminosities have been derived assuming an absorbed power-law spectrum with photon index =1.7 and column density N. Broad-band X-ray luminosities have been derived from the broad-band fluxes and hard-band X-ray luminosities have been derived from the hard-band fluxes (see Paper II). L1.4GHz: logarithm of the monochromatic radio luminosity at 1.4 GHz rest-frame; Lmid-IR: logarithm of the integrated mid-IR luminosity in the 3–20 m rest-frame wavelength range; : optical extinction derived from the best-fit assuming the prescription reported in Calzetti et al. (2000); SED type: best-fit template (see Figure 1); Class: AGN spectral classification (SF, AGN1, AGN2); Comment: B indicates a source in the B sample, Bu marks those in the B sample with unreliable poorly sampled SED, M refers to a source for which the absolute magnitude criterion for the photometric redshift determination was relaxed, No IR indicates sources without SWIRE coverage.
| Group | N | % in R1 | % in R2 | % in R3 |
|---|---|---|---|---|
| All | 107 (87) | 28 (25) | 32 (33) | 36 (36) |
| 25 (24) | 37 (45) | 29 (34) | 11 (13) | |
| 29 (21) | 37 (32) | 35 (34) | 16 (13) | |
| 26 (20) | 23 (18) | 26 (28) | 26 (26) | |
| 22 (17) | 3 (5) | 9 (3) | 47 (48) | |
| 24 (17) | 33 (32) | 21 (21) | 18 (13) | |
| 29 (23) | 47 (50) | 35 (31) | 8 (10) | |
| 25 (23) | 17 (14) | 35 (41) | 21 (26) | |
| 24 (19) | 3 (5) | 9 (7) | 53 (52) | |
| Normal | 0 (0) | 0 (0) | 0 (0) | 0 (0) |
| SF | 14 (7) | 30 (27) | 9 (0) | 5 (3) |
| AGN2 | 55 (45) | 63 (64) | 62 (69) | 39 (35) |
| AGN1 | 33 (30) | 7 (9) | 29 (31) | 55 (61) |
| 25 (24) | 33 (41) | 32 (38) | 11 (13) | |
| 29 (25) | 33 (32) | 32 (38) | 21 (23) | |
| 27 (16) | 30 (23) | 29 (21) | 21 (16) | |
| 21 (17) | 3 (5) | 6 (3) | 47 (48) |
Note. — The reported statistics refers to 107 sources for which IRAC observations are available. Of these 87 sources are detected in all 4 IRAC bands, for the remaining 20 sources upper limits were adopted, 4.3, 8.3, 58.5, and 65.7 Jy at 3.6, 4.5, 5.8, and 8.0 m, respectively. The values in parenthesis refer to the sub-sample of 87 sources with detections in all 4 IRAC bands. is the absorption-corrected luminosity in the 0.5–10 keV rest-frame interval in . is the mid-IR luminosity integrated between 3 and 20 m rest-frame in L⊙. is the intrinsic column density density measured in the X-rays in .
R1, R2, R3 represent three regions defined in color space by the flux ratios, F(5.8)/F(3.6) and F(8.0)/F(4.0). They are shown in Figure 11. Only sources in the A sample are taken into account.