GRB 060505: A possible short-duration gamma-ray burst in a star forming region at redshift of
Abstract
On 2006 May 5, a four second duration, low energy, erg, Gamma-Ray Burst (GRB) was observed, spatially associated with a galaxy. Here, we report the discovery of the GRB optical afterglow and observations of its environment using Gemini-south, Hubble Space Telescope (HST), Chandra, Swift and the Very Large Array. The optical afterglow of this GRB is spatially associated with a prominent star forming region in the Sc-type galaxy 2dFGRS S173Z112. Its proximity to a star forming region suggests that the progenitor delay time, from birth to explosion, is smaller than about 10 Myr. Our HST deep imaging rules out the presence of a supernova brighter than an absolute magnitude of about (or in case of “maximal” extinction) at about two weeks after the burst, and limits the ejected mass of radioactive Nickel 56 to be less than about M⊙ (assuming no extinction). Although it was suggested that GRB 060505 may belong to a new class of long-duration GRBs with no supernova, we argue that the simplest interpretation is that the physical mechanism responsible for this burst is the same as for short-duration GRBs.
Subject headings:
gamma rays: bursts1. Introduction
Observations of short Gamma-Ray Burst (GRB) afterglows (e.g. Gehrels et al. 2005; Fox et al. 2005; Hjorth et al. 2005; Berger et al. 2005; Bloom et al. 2006) resulted in a possible dichotomy between short GRBs and long GRBs – the presence of a supernova component in long GRBs and its absence from short GRBs. However, the recent discovery of GRB 060614, a 102 s-long GRB with no apparent associated supernova (Gal-Yam et al. 2006; Fynbo et al. 2006b; Della Valle et al. 2006) may suggest a more complex picture. The situation is further tangled as the duration distribution of short and long GRBs overlap (e.g. Horváth 2002), and there is no clear way to classify an intermediate duration GRB based on its duration alone (despite the fashionable 2 s cut). Therefore, intensive multi-wavelength observations of nearby GRBs are needed in order to construct a clear picture of the GRB zoo, and to unveil the physical mechanisms behind the different families of GRBs.
On UTC 2006 May 5, 06:36:01, the Swift Burst Alert Telescope (BAT) detected the weak GRB 060505 with a fluence of erg cm-2 in the keV band (Palmer et al. 2006; Hullinger et al. 2006), and a duration of s. The gamma-ray time-averaged spectrum was reported to be well fitted by a simple power law, with an index of (i.e. ). The on-board detection significance for the burst was below the threshold for an autonomous spacecraft maneuver. Analysis of the full data set on the ground showed the burst to be statistically significant and a repointing was commanded at days. The Swift X-Ray Telescope (XRT) detected an X-ray source (Conciatore et al. 2006a) at a position: (J2000.0). The X-ray position, which has a confidence radius of , is located about from the galaxy 2dFGRS S173Z112 (Colless et al. 2003). Further observations by Swift XRT, about five days after the GRB, showed that the X-ray source decayed between the two epochs (Conciatore et al. 2006b). In the optical regime, Brown & Palmer (2006) did not detect an Optical Transient (OT) using Swift Ultra-Violet/Optical Telescope (UVOT) observations of this field conducted d after the GRB trigger. However, Ofek et al. (2006) reported the detection of the OT associated with GRB 060505 (see §2), later confirmed by VLT/FORS2 observations (Thoene et al. 2006).
2. Observations
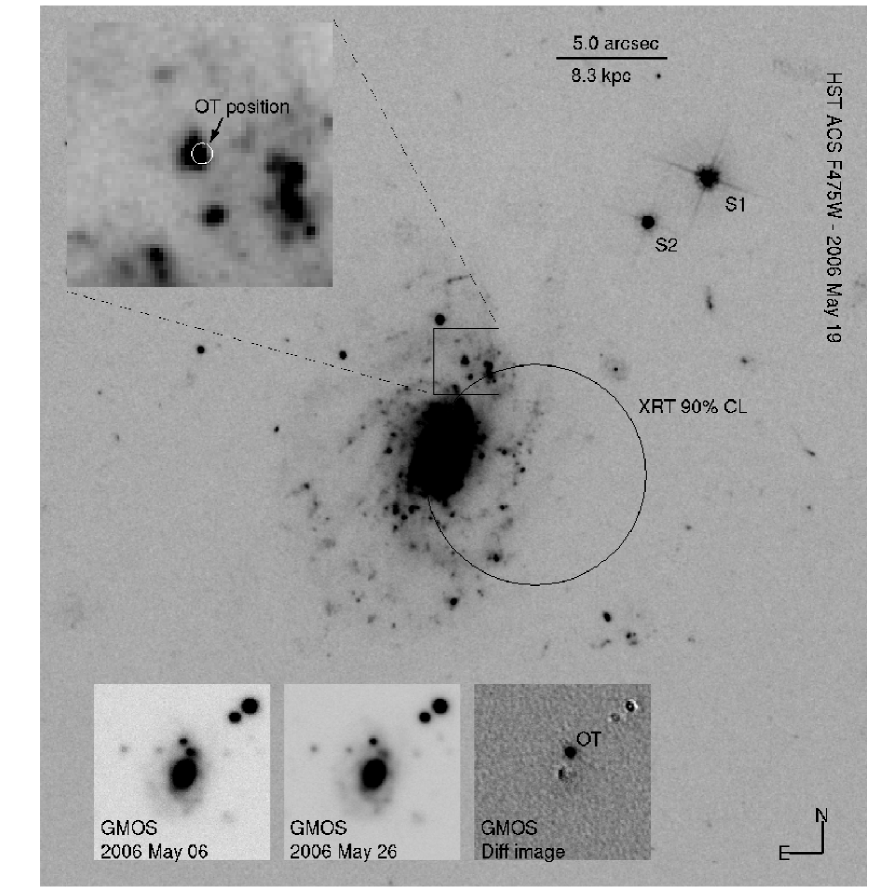
Starting d after the BAT trigger, we observed GRB 060505 with the Gemini Multi-Object Spectrograph (GMOS) on the Gemini south telescope and obtained imaging data at four epochs. Image subtraction (Alard & Lupton 1998) of the first epoch Gemini image from later epochs have revealed the presence of an OT (Ofek et al. 2006), spatially associated with the XRT position, within the galaxy 2dFGRS S173Z112 at (Colless et al. 2003; see Fig. 1). The position of the OT is (J2000.0; rms ).
Given the possible low-redshift origin of this burst, we have activated our Hubble Space Telescope (HST) target of opportunity program, and observed GRB 060505 at two epochs, 14.36 and 32.8 days after the burst, using the Advance Camera for Surveys (ACS). In each epoch we integrated for six orbits with the F475W (SDSS ) band, and for three orbits with the F814W (Cousins ) band. The HST and Gemini images of the OT and host galaxy are presented in Fig. 1.
The optical afterglow is not detected in the difference images of the two HST epochs, down to a limiting AB magnitude of 27.3 and 27.1 in the F814W and F475W bands, respectively. It is also not detected by subtraction of Swift/UVOT images, obtained at several epochs.
The log of optical imaging observations along with the measurements and upper limits are listed in Table 1. All the limiting magnitudes were obtained by artificially adding point sources with decreasing magnitudes to the first epoch images. To mimic the signal-to-noise properties of the OT, we placed the artificial stars on top of a star forming region in the host galaxy, which has a surface brightness similar to the one in the region where the OT was found. Then, we subtracted the latest epoch from each simulated image, and inspected the images for the artificial sources. Photometric calibration of the Gemini images was based on the HST imaging and it is presented, with details, in Table 2.
| Instrument | Date | Exp. Time | Band | AB Mag | Flux |
|---|---|---|---|---|---|
| UTC 2006 | [s] | [mag] | [Jy] | ||
| GMOS | 05-06.377 | r | |||
| GMOS | 05-06.393 | g | |||
| GMOS | 05-12.316 | g | |||
| GMOS | 05-12.330 | r | |||
| GMOS | 05-14.353 | g | |||
| GMOS | 05-14.367 | r | |||
| GMOS | 05-14.380 | i | |||
| GMOS | 05-26.318 | g | bbUsed as a reference image in the image subtraction process. | ||
| GMOS | 05-26.294 | r | bbUsed as a reference image in the image subtraction process. | ||
| UVOTaaSwift UVOT Vega-based zero points used are , , , and for the UM2, UW1, U, and V-bands, respectively. To convert Vega-based magnitudes to AB magnitudes we added , , , and magnitudes to the , , , and -bands, respectively. | 05-05.981 | U | |||
| UVOT | 05-10.512 | U | bbUsed as a reference image in the image subtraction process. | ||
| UVOT | 05-05.996 | V | |||
| UVOT | 05-21.818 | V | bbUsed as a reference image in the image subtraction process. | ||
| UVOT | 05-05.977 | UW1 | |||
| UVOT | 05-18.241 | UW1 | bbUsed as a reference image in the image subtraction process. | ||
| UVOT | 05-05.999 | UM2 | |||
| UVOT | 05-10.505 | UM2 | bbUsed as a reference image in the image subtraction process. | ||
| ACS | 05-19.635 | F814W | |||
| ACS | 05-19.636 | F475W | |||
| ACS | 06-06.957 | F814W | bbUsed as a reference image in the image subtraction process. | ||
| ACS | 06-07.160 | F475W | bbUsed as a reference image in the image subtraction process. |
| Name | R.A. | Dec. | g | r | i |
|---|---|---|---|---|---|
| J2000.0 | AB magnitudeaaThe magnitudes were calculated by fitting the synthetic photometry magnitudes of stellar spectral templates (Pickles 1998) to the observed ACS F475W and F814W-band magnitudes, and then calculating the synthetic magnitudes in the , , and -bands using the best fit spectral template. The ACS magnitudes were measured in a four-pixel radius aperture and were extrapolated to an infinite aperture (Sirianni et al. 2005). | ||||
| S1bbThe best fit spectral template for this object is of an F8V star. The ACS F475W magnitude is , and the ACS F814W magnitude is . | 22:07:02.95 | 27:48:44.4 | |||
| S2ccThe best fit spectral template for this object is of an K3I star. The ACS F475W magnitude is and the ACS F814W magnitude is . | 22:07:03.15 | 27:48:46.5 | |||
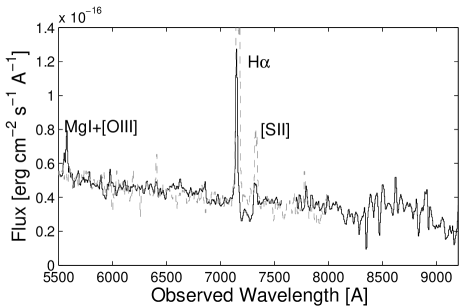
On 2006 May 13, we obtained a min spectrum of the position of the OT using the Gemini-south telescope with the GMOS instrument. We used a slit with the R400 grating blazed at 6000 Å. The spectrum shows a feeble continuum emission and prominent emission lines at the redshift of the host galaxy, confirming that the bright knot at the OT position is indeed a star forming region within the galaxy (see also Fynbo et al. 2006b). In order to estimate the star formation rate within the host galaxy, on 2006 July 19 we obtained a flux calibrated spectrum of the central part of the host galaxy using the Double Beam Spectrograph (DBSP) on the Palomar 200-inch telescope. We used a slit with the R158 grating blazed at 7500 Å. The red-arm spectrum, shown in Fig. 2, consists of two 15 min exposures. An H emission line is clearly detected in the spectrum, indicating ongoing star formation in this galaxy.
At about d after the burst, we observed GRB 060505 using the ACIS-S detector on board the Chandra X-ray observatory. Using wavedetect111part of the Chandra Interactive Analysis of Observations software., we identified a source consistent with the OT position. The source was detected at the - confidence level in the – keV band. The XRT and Chandra X-ray measurements are listed in Table 3.
| DateaaUTC 2006 May, time of beginning of observation. | Exp. | BandccBand for the X-ray counts. | Count rate | ddPhoton index assumed in the conversion from counts to flux. | FluxeeUnabsorbed flux in the 0.2–10 keV band. Assuming Galactic neutral Hydrogen column density of cm-2 (Dickey & Lockman 1990). | FluxffSpecific flux at 1keV. |
|---|---|---|---|---|---|---|
| Tel.bbThe instrument used is listed below the date. | [ks] | [keV] | [count s-1] | [erg s-1 cm-2] | [nJy] | |
| 05.973 | 8.0 | 0.2–10 | 2.0 | |||
| Swift | 2.5 | |||||
| 10.031 | 11.7 | 0.2–10 | 2.0 | |||
| Swift | 2.5 | |||||
| 24.334 | 24.71 | 2.0–8 | 2.0 | |||
| Chandra | 2.5 |
Note. — Swift-XRT X-ray counts are from Conciatore et al. (2006b).
The X-ray flux was calculated using WebPIMMS222http://cxc.harvard.edu/toolkit/pimms.jsp, assuming the X-ray spectrum is described by a power-law with a photon index of , and a Galactic Hydrogen column density of cm-2 (Dickey & Lockman 1990).
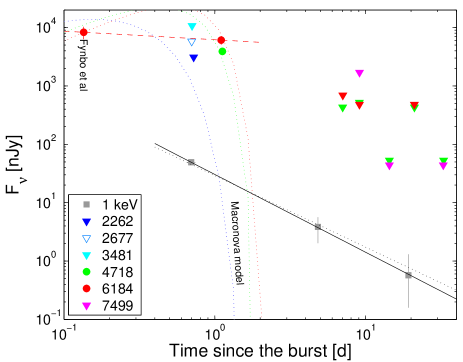
Figure 3 shows the X-ray and optical light curves of GRB 060505. The X-ray light curve is well fitted by a single power-law with a slope of (solid line). Our early -band measurement together with the single -band data presented in Fynbo et al. (2006b; converted to the AB magnitude system, ), suggest a power-law decay rate of about (dashed line).
We have observed GRB 060505 with the Very Large Array333The Very Large Array is operated by the National Radio Astronomy Observatory, a facility of the National Science Foundation operated under cooperative agreement by Associated Universities, Inc., at frequency of GHz and 100 MHz bandwidth, at the following epochs: UTC 2006 May 17.53; Aug 18.32, 20.35, 21.32, 22.31, and 23.37. The reduction was done following standard practice in the Astronomical Image Processing System software package. At the first epoch, 12.3 d after the burst, no radio source was visible at the OT position to a 3- limit of 165 Jy. Summing the last five epochs, with mean epoch 107.8 d after the burst, reveal no radio source to a 3- limit of 46 Jy at the OT position.
3. Results
At , the luminosity distance444Assuming WMAPSDSS cosmological parameters: km s-1 Mpc-1; ; (Spergel et al. 2006). to GRB 060505 is 404 Mpc (distance modulus mag; angular diameter distance 341 Mpc). The relatively low redshift of GRB 060505 makes it an extraordinary event for both constraining the presence of a supernova and the ejecta from the explosion, and for studying the GRB environment. We discuss these issues below.
3.1. Environment and progenitor age
As seen in Fig. 1, GRB 060505 is spatially associated with a bright, spectroscopically confirmed, star forming region found at a projected distance of kpc () from its host galaxy center. The AB magnitude of this star forming knot is 23.9 and 23.7 in the F475W and F814W-bands, respectively.
Our observations (Fig. 1 and 2) show that 2dFGRS S173Z112 is a face-on Sc-type galaxy. Using the flux of the H emission line, along with the relation from Kennicutt (1998), we estimate that the star formation rate in this galaxy is about 2 M⊙ yr-1. We obtained this value by extrapolating the H emission, observed within the slit, over the entire area of the galaxy, weighted by the g-band surface brightness. We note that the total AB magnitude of the galaxy is 18.3 and 17.7 in the F475W and F814W-bands, respectively. This is equivalent to absolute magnitude of and in the F475W and F814W-bands, respectively (corrected for K-correction; Oke & Sandage 1968). Therefore, the specific star formation in this galaxy is M⊙ yr-1 L.
The association of GRB 060505 with a bright star forming region can be used to set a limit on the delay time, from progenitor birth to explosion. This limit may be especially interesting if GRB 060505 is a consequence of a compact-binary merger rather than due to a massive-star core collapse. First, the presence of an HII region in the explosion site of GRB 060505 suggests a delay time below about 10 Myr (e.g. Mayya 1995). Second, a limit on the delay time that is applicable for the compact-star merger scenario can be derived from the size of the star forming region combined with the speed of the progenitor. The diameter of pc of the HII region at the position of the OT suggests that the delay time, , from birth to explosion of GRB 060505 is:
| (1) |
where is the (kick) velocity of the progenitor. The km s-1 kick velocity we adopted is half (in order to account for the binary center of mass speed) of the value of the lowest transverse velocity of a pulsar in the sample of Hansen & Phinney (1997).
3.2. Supernova Limits
The absence of detectable optical emission from the OT at d after the burst (see Table 1), suggests that GRB 060505 was not associated with a bright supernova. Assuming negligible extinction555The Galactic extinction toward GRB 060505 is (Schlegel et al. 1998)., our deep HST observations imply a limit on the and -bands absolute magnitude of a supernova, two weeks after the burst, of mag. Extinction within the host galaxy may weaken our results. However, the Balmer lines ratio of the star formation region at the position of the OT is suggestive of no reddening (Fynbo et al. 2006b). We note that the color of the afterglow (), is somewhat redder than expected for GRB afterglow. Therefore, it may suggest some extinction. We put a conservative upper limit on the extinction by using the observed color of the OT at one day after the burst and by assuming that the intrinsic optical spectrum cannot be steeper than a Rayleigh-Jeans spectrum (). We find that (assuming ; Cardelli et al. 1989).
Assuming this “maximal extinction”, the -band absolute AB magnitude of a supernova lurking in the OT position is fainter than . This limit includes a K-correction (Humason, Mayall, & Sandage 1956; ) of mag in the -band, assuming an SN1998bw-like spectrum. Our limit improves upon the result of Fynbo et al. (2006b) by three magnitudes (at about two weeks after the burst), and rules out even the faint class of supernova they discuss.
Furthermore, using our HST limit on day 14, along with Eq. 44 in Kulkarni (2005) we can place an approximate upper limit on the mass of the radioactive Nickel 56 produced in this explosion of M M⊙, assuming no extinction and M M⊙, assuming maximal extinction. We note that the faintest core collapse supernovae known to date, ejected about M⊙ of 56Ni (e.g. Pastorello et al. 2004), but there may be a bias against finding such low-luminosity SN.
3.3. The Light Curve and Spectral Energy Distribution
As shown in Fig. 3, during the first day, the optical light curve evolution is consistent with a power-law decay with a index. The photometry was performed after image subtraction, so this result is not sensitive to contamination by the host galaxy light. Such a flat temporal evolution is rare among optical GRB afterglows. Interestingly, similar flat temporal optical evolution was observed in the short-duration GRB 060313 (Roming et al. 2006). However, we note that this power-law decay is based on sparsely sampled light curve. At later times, between day one and 14, the power-law index is steeper than about . The X-ray light curve, on the other hand, is consistent with a single power-law decay rate of .
Although the optical-to-X-ray spectral power-law index (defined by ) that we measured at 1.1 days after the burst is typical for GRB afterglows, the visible-light color of the afterglow () is marginally redder than expected at one day after the burst (e.g. Šimon et al. 2001; Lipkin et al. 2004). Possible explanations are either that the OT is reddened or that some of the optical radiation is contributed by some additional mechanism (i.e. not by the afterglow). An interesting possibility is that the early optical emission is powered, in addition to the afterglow light, by the decay of free neutron ejecta. Such a scenario was suggested in the context of neutron star (NS) mergers by Li & Paczyński (1998), and investigated by Kulkarni (2005; i.e. macronova). In Fig. 3 we show, for example, a macronova model that roughly fits the optical data. The dotted red, green, and blue lines correspond to a macronova model with M⊙ free-neutron ejecta and a velocity of the speed of light. An inspection of the models presented by Kulkarni (2005) suggests that the radioactive decay of the free neutron ejecta may roughly explain the behavior of the optical light curve. However, our observations are too sparse for a critical examination of this model.
4. Discussion
GRBs are traditionally classified according to their durations into short and long events (Kouveliotou et al. 1993). GRB 060505 has some unusual characteristics that make it difficult to place within this scheme. Fynbo et al. (2006b) suggested that GRB 060505 may belong to a new emerging group of long duration GRBs without a supernova. We note that the existence of a third group of GRBs was already suggested in the past (e.g. Mukherjee et al. 1998; Horváth 2002), based on the analysis of the GRB duration distribution. Recently, a third group was also discussed by Gal-Yam et al. (2006), Fynbo et al. (2006b), and Della Valle et al. (2006) which presented observations of GRB 060614 – a long-duration GRB ( s; Barthelmy et al. 2006), spatially associated with a galaxy, with no apparent supernova. However, a simpler explanation for this particular case is that GRB 060505 was a short-duration GRB. We note that, “short” is used here in the sense that the GRB physical mechanism is similar to that of short GRBs. We discuss the various possibilities for the nature of GRB 060505 below.
The absence of a supernova, the low isotropic equivalent -ray energy, erg, and the low-redshift of GRB 060505, are characteristic of other short-duration GRBs (see however Berger et al. 2006). On the other hand, the duration of GRB 060505 is above the canonical 2 s cut, separating short and long GRBs. However, the duration distributions of short and long GRB overlap (e.g. Horváth 2002; Donaghy et al. 2006). For example, adopting the Horváth (2002) decomposition (based on BATSE observations), the probability of a short burst to have a duration larger than 4 s is about . Moreover, of the GRBs with s durations belong to the “short”-duration group. Although the Horváth (2002) decomposition is not necessarily the correct one, it is preferred over using a sharp cutoff at 2 s.
If indeed GRB 060505 is a genuine short-duration GRB, then our limit on the delay time implies that any scenario for short-duration GRBs should be able to produce events with delay times shorter than about 10 Myr. In the context of the NS merger scenario, we note that Belczynski et al. (2006) estimated that the time delay from binary-birth-to-explosion probability function has a narrow maximum around 20 Myr, with approximately 10 Myr width, followed by a flat probability extending to delay times of the order of the Hubble time. Furthermore, NS-black hole (BH) mergers may have somewhat shorter delay times than those of NS–NS mergers. Therefore, if indeed GRB 060505 was a short-duration GRB, our observations are consistent with a NS–NS/NS–BH merger model for short GRBs.
Next we address the possibility that GRB 060505 is a long-duration GRB. The redshift and the isotropic equivalent -ray energy of GRB 060505 are atypically low for a “classical” long GRB. While several anomalous low energy, local Universe, long GRBs have been detected (e.g. GRB060218; Campana et al. 2006), GRB 060505 and GRB 060614 (Gal-Yam et al. 2006) are not associated with a supernova.
Following Fruchter et al. (2006) we compared the environment of GRB 060505 to that of other long GRBs. Fruchter et al. (2006) studied a sample of long GRBs with identified host galaxies. They sorted all the pixels in each host galaxy image by brightness, and computed the fraction of the total light of the host contained in pixels fainter than or equal to the pixel in which the OT is located. Next, they presented a histogram of this fraction of light, and found that long GRBs prefer to reside in the brightest pixels of a galaxy. We applied the Fruchter et al. (2006) analysis to an F475W-band image of GRB 060505. Using exactly the same SExtractor (Bertin & Arnouts 1996) detection criteria used by these authors, we find that the brightness at the spatial position of the OT is among the dimmest first-to-th percentile (depending on the exact location of the OT, which is known to about 60 mas) of the galaxy light. Comparing this to the long-duration GRBs population investigated by Fruchter et al. (2006), we find that fewer than of Fruchter et al. (2006) long-duration GRBs occurred in similar (or fainter) regions to that of GRB 060505. We note that our analysis may be biased by two facts. First, our observations were made at rest-frame wavelengths of about 4400 Å, while the Fruchter et al. (2006) analysis was performed at a median rest-frame wavelength of about 3700 Å. However, as shown by Fruchter et al. (2006), their analysis is not sensitive to the redshift of the galaxies in their sample. Second, the redshift of GRB 060505 is smaller (by a factor ) than the typical redshift of the GRBs in the Fruchter et al. (2006) sample. Placing our galaxy at the typical redshift of the Fruchter et al. sample will bring most of the galaxy light below the noise level. Hence, the fraction of observable galaxy light that is dimmer than the brightness at the OT position decreases, making GRB 060505 less consistent with the long-duration GRBs population. We note that a possible interpretation of the Fruchter et al. analysis is that long GRBs are associated with low metallicity environment (see however, Fynbo et al. 2006a). Therefore, long GRBs in massive spirals are expected to occur at the outskirts of the galaxy, where the metallicity is on average lower. In this case the fact that GRB 060505 occurred in the outer region of its host galaxy may support the notion that it is a long GRB (although until now long GRBs were not observed in massive spirals). Therefore, it will be constructive to measure the metallicity of GRB 060505 host galaxy and the immediate environment of the GRB and to compare it with the metallicity of other long GRB hosts.
Fynbo et al. (2006b) suggested that both GRB 060505 and GRB 060614 may constitute a new class of GRBs, which are associated with faint supernovae (e.g. Fryer, Young, & Hungerford 2006). If a class of long GRBs with faint (or no) supernovae exists, a clue regarding the nature of the progenitor can be derived from the rate of such events, which we derive below. To estimate the rate we took into account the BAT field of view ( sr) and operation time ( yr), and assumed that at least two such bursts were observed by Swift/BAT. Next, we summed the volume to the two GRBs and multiply it by two. We introduced the factor of two in order to account for the fact that we can detect bursts at larger distances. It has been shown (Schmidt 1968) that the expectancy value for the ratio of the volume enclosed within the distance to an event to the maximal volume in which such an event is detectable (i.e. ) is , hence the factor of 2. We get that the local rate of such GRBs is yr-1 Gpc-3, at the confidence level (Gehrels 1986). This lower limit is approximately three times larger than the observed rate of classical long GRBs (without beaming correction; e.g. Schmidt 2000; Guetta, Piran, & Waxman 2005). However, this limit is below the inferred rate of low-luminosity long GRBs such as GRB 980425 and GRB 060218 (e.g., Soderberg et al. 2006).
Finally, we discuss the possibility that GRB 060505 is a background event unrelated to the galaxy 2dFGRS S173Z112. Schaefer & Xiao (2006) claimed that the association of GRB 060505 with the galaxy 2dFGRS S173Z112 is due to a chance coincidence. Estimating the probability for a chance coincidence is susceptible to the pitfalls of aposteriori statistics. Moreover, it is not clear how to incorporate additional information like the fact that GRB 060505 is associated with a star forming region. Bearing this in mind, we note that in their calculation Schaefer & Xiao (2006) used an inappropriate luminosity (of L∗) for the host galaxy of GRB 060505. Repeating their calculation using the correct value ( L∗), and using the galaxy luminosity function given by Blanton et al. (2003), we get that the probability for a chance coincidence per trial is six times lower than the probability of claimed by Schaefer & Xiao (2006). While a chance projection cannot be definitely ruled out for this burst, its association with 2dFGRS S173Z112 is no less certain than those of prototypical short GRBs (e.g., GRB 050709 and GRB 050724) with their host galaxies.
To summarize, our observations show that GRB 060505 is not associated with any supernova brighter than absolute -band magnitude of (assuming no extinction). Furthermore, we can constrain the mass of radioactive Nickel 56 ejecta to be less than M⊙, and we find that the delay time, from birth to explosion, of this GRB progenitor is probably smaller than about Myr. The light curve of GRB 060505 is atypical for GRB afterglows and we show it may be explained by the macronova model (Kulkarni 2005). Alternatively, the OT may be somewhat reddened. The simplest interpretation of GRB 060505 is that it is the nearest observed short-duration GRB to date. Another possibility is that GRB 060505 belongs to a new class of supernova-lacking GRBs that have long durations. However, this will require that the rate of such events will be at least a factor of three larger than that of “classical” long GRBs.
References
- Alard & Lupton (1998) Alard, C., & Lupton, R. H. 1998, ApJ, 503, 325
- Barthelmy et al. (2006) Barthelmy, S., et al. 2006, GRB Coordinates Network, 5256, 1
- Belczynski et al. (2006) Belczynski, K., Perna, R., Bulik, T., Kalogera, V., Ivanova, N., & Lamb, D. Q. 2006, ApJ, 648, 1110
- Berger et al. (2005) Berger, E., et al. 2005, Nature, 438, 988
- Berger et al. (2006) Berger, E., et al. 2006, astro-ph/0611128
- Bertin & Arnouts (1996) Bertin, E., & Arnouts, S. 1996, A&AS, 117, 393
- Blanton et al. (2003) Blanton, M. R., et al. 2003, ApJ, 592, 819
- Bloom et al. (2006) Bloom, J. S., et al. 2006, ApJ, 638, 354
- Brown & Palmer (2006) Brown, P. J., & Palmer, D. 2006, GRB Coordinates Network, 5082, 1
- Campana et al. (2006) Campana, S., et al. 2006, Nature, 442, 1008
- Cardelli et al. (1989) Cardelli, J. A., Clayton, G. C., & Mathis, J. S. 1989, ApJ, 345, 245
- Colless et al. (2003) Colless, M., et al. 2003, VizieR Online Data Catalog, 7226, 0
- Conciatore et al. (2006a) Conciatore, M. L., Capalbi, M., Vetere, L., Palmer, D., & Burrows, D. 2006a, GRB Coordinates Network, 5078, 1
- Conciatore (2006b) Conciatore, M. L. 2006b, GRB Coordinates Network, 5115, 1
- Della Valle et al. (2006) Della Valle, M., et al. 2006, Nature, 444, 1050
- Dickey & Lockman (1990) Dickey, J. M., & Lockman, F. J. 1990, ARA&A, 28, 215
- Donaghy et al. (2006) Donaghy, T. Q., et al. 2006, astro-ph/0605570
- Fox et al. (2005) Fox, D. B., et al. 2005, Nature, 437, 845
- Frail et al. (2001) Frail, D. A., et al. 2001, ApJL, 562, L55
- Fruchter & Hook (2002) Fruchter, A. S., & Hook, R. N. 2002, PASP, 114, 144
- Fruchter et al. (2006) Fruchter, A. S., et al. 2006, Nature, 441, 463
- Fryer et al. (2006) Fryer, C. L., Young, P. A., & Hungerford, A. L. 2006, astro-ph/0604471
- Fynbo et al. (2006a) Fynbo, J. P. U., et al. 2006a, A&A, 451, L47
- Fynbo et al. (2006b) Fynbo, J. P. U., et al. 2006b, Nature, 444, 1047
- Gal-Yam et al. (2006) Gal-Yam, A., et al. 2006, Nature, 444, 1053
- Gehrels (1986) Gehrels, N. 1986, ApJ, 303, 336
- Gehrels et al. (2005) Gehrels, N., et al. 2005, Nature, 437, 851
- Guetta et al. (2005) Guetta, D., Piran, T., & Waxman, E. 2005, ApJ, 619, 412
- Hansen & Phinney (1997) Hansen, B. M. S., & Phinney, E. S. 1997, MNRAS, 291, 569
- Hjorth et al. (2005) Hjorth, J., et al. 2005, Nature, 437, 859
- Horváth (2002) Horváth, I. 2002, A&A, 392, 791
- Hullinger et al. (2006) Hullinger, D., et al. 2006, GRB Coordinates Network, 5142, 1
- Humason et al. (1956) Humason, M. L., Mayall, N. U., & Sandage, A. R. 1956, AJ, 61, 97
- Kennicutt (1998) Kennicutt, R. C., Jr. 1998, ApJ, 498, 541
- Kinney et al. (1996) Kinney, A. L., Calzetti, D., Bohlin, R. C., McQuade, K., Storchi-Bergmann, T., & Schmitt, H. R. 1996, ApJ, 467, 38
- Kouveliotou et al. (1993) Kouveliotou, C., Meegan, C. A., Fishman, G. J., Bhat, N. P., Briggs, M. S., Koshut, T. M., Paciesas, W. S., & Pendleton, G. N. 1993, ApJL, 413, L101
- Kulkarni (2005) Kulkarni, S. R. 2005, astro-ph/0510256
- Li & Paczyński (1998) Li, L.-X., & Paczyński, B. 1998, ApJL, 507, L59
- Lipkin et al. (2004) Lipkin, Y. M., et al. 2004, ApJ, 606, 381
- Mayya (1995) Mayya, Y. D. 1995, AJ, 109, 2503
- Monet et al. (1998) Monet, D. B. A., et al. 1998, VizieR Online Data Catalog, 1252, 0
- Mukherjee et al. (1998) Mukherjee, S., Feigelson, E. D., Jogesh Babu, G., Murtagh, F., Fraley, C., & Raftery, A. 1998, ApJ, 508, 314
- Ofek et al. (2006) Ofek, E. O., Cenko, S. B., Gal-Yam, A., Peterson, B., Schmidt, B. P., Fox, D. B., & Price, P. A. 2006, GRB Coordinates Network, 5123, 1
- Oke & Sandage (1968) Oke, J. B., & Sandage, A. 1968, ApJ, 154, 21
- Palmer et al. (2006) Palmer, D., Cummings, J., Stamatikos, M., Markwardt, C., & Sakamoto, T. 2006, GRB Coordinates Network, 5076, 1
- Pastorello et al. (2004) Pastorello, A., et al. 2004, MNRAS, 347, 74
- Pickles (1998) Pickles, A. J. 1998, PASP, 110, 863
- Roming et al. (2006) Roming, P. W. A., et al. 2006, ApJ, 651, 985
- Schaefer & Xiao (2006) Schaefer, B. E., & Xiao, L. 2006, astro-ph/0608441
- Schlegel et al. (1998) Schlegel, D. J., Finkbeiner, D. P., & Davis, M. 1998, ApJ, 500, 525
- Schmidt (1968) Schmidt, M. 1968, ApJ, 151, 393
- Schmidt (2000) Schmidt, M. 2000, AIP Conf. Proc. 526: Gamma-ray Bursts, 5th Huntsville Symposium, 526, 58
- Šimon et al. (2001) Šimon, V., Hudec, R., Pizzichini, G., & Masetti, N. 2001, A&A, 377, 450
- Sirianni et al. (2005) Sirianni, M., et al. 2005, PASP, 117, 1049
- Soderberg et al. (2006) Soderberg, A. M., et al. 2006, Nature, 442, 1014
- Spergel et al. (2006) Spergel, D. N., et al. 2006, astro-ph/0603449
- Thoene et al. (2006) Thoene, C. C., Fynbo, J. P. U., Sollerman, J., Jensen, B. L., Hjorth, J., Jakobsson, P., & Klose, S. 2006, GRB Coordinates Network, 5161, 1