Phase correction of VLBI with water vapour radiometry
Abstract:
We demonstrate phase correction of 3 mm VLBI observations using the scanning 18 GHz to 26 GHz water vapour radiometer at Effelsberg and we demonstrate an absolute accuracy of 15 mm in zenith path delay by comparing with GPS and radiosondes. This accuracy should provide significant improvement in astrometric phase referencing observations. It is not good enough for geodetic VLBI to replace the tropospheric delay estimation but could be used to remove short-term path-length fluctuations and so improve the geodetic observables. We discuss lessons learned and opportunities for further improvement.
1 Introduction
The Effelsberg radio telescope was equipped in March 2004 with a 22 GHz water vapour radiometer for phase correction of tropospheric phase fluctuations during VLBI experiments at frequencies up to 86 GHz. The radiometer also measures tropospheric path delay for astrometric and geodetic VLBI experiments. It has been used during routine VLBI experiments at 86 GHz for validation tests and software is being developed to provide the data routinely to observers.
VLBI at 86 GHz yields resolution down to 60 as with global baselines. Experiments up to 230 GHz have produced fringes with a record smallest spacing of 30 as, on the 6.4 G trans-atlantic baseline between Pico Veleta and the HHT (Krichbaum et al. 2004), which is comparable to the 27 as diameter predicted by Falcke, Melia & Agol (2000) for the silhouette of the event horizon in Sgr A∗. However, the signal-to-noise ratios of the 230 GHz detections were only 7.3 on on 3C 454.3 and 6.4 on 0716+714 due to a combination of decoherence due to atmospheric phase fluctuations during the 7 min integration, relatively high system noise, and atmospheric opacity. Sensitivity could be improved by a factor of two to four by correcting for the coherence loss due to atmospheric phase noise using water vapour radiometry. Water vapour radiometry monitors with high precision the strength of emission from atmospheric water vapour and infers a time-dependent correction to the VLBI phase, which then improves the temporal coherence.
2 The Water Vapour Radiometer at Effelsberg (WAVE)
We have built a scanning 18 GHz to 26 GHz water vapour radiometer and installed it on the focus cabin roof at Effelsberg viewing along the optical axis. It is based on a prototype by Alan Rogers that was demonstrated at BIMA and during 3 mm VLBI on the baseline between BIMA and Kitt Peak (Tahmoush & Rogers 2000). The radiometer is uncooled to reduce cost, is scanning to reduce the parts count and hence cost and to provide better stability since offsets and drifts affect all channels and so are common-mode noise sources, which are rejected to some extent when differencing on-line and off-line channels. We paid particular attention to RF shielding, weather proofing, temperature stabilization using a Peltier element to maintain the RF electronics near 30∘C and we added a noise diode for noise-adding radiometry to monitor the system gain. Monitoring and control takes place over a TCP/IP connection on optical fibre, so the system requires only power and a network connection to operate. The data are logged into a MySQL database from where they can be examined and downloaded through a web interface.
Photographs, schematics, measured performance and correction of atmospheric opacity have been shown by Roy et al. (2004). Here, we demonstrate the correction of tropospheric phase fluctuations during an 86 GHz VLBI experiment and we validate the absolute calibration for astrometric and geodetic application by comparing to GPS and radiosonde measurements.
3 Demonstration of Phase Correction
A typical water line spectrum measured by the radiometer is shown in Fig 1a, as presented by the web interface to the WVR database. The line is centred on 22.2 GHz and is pressure-broadened to GHz FWHM. The line appears asymmetric as it sits on the frequency-squared wing of the oxygen line at 60 GHz. Such a spectrum is measured each 6 s. We fit to each spectrum a three-component model consisting of a frequency-squared baseline underneath the water line plus a constant offset and a van Vleck-Weisskopf profile to the line to estimate the strength of the line above the baseline. From the line strength we infer the path length using the theoretical relationship between refractive index and emissivity of water vapour derived by Tahmoush & Rogers (2000).
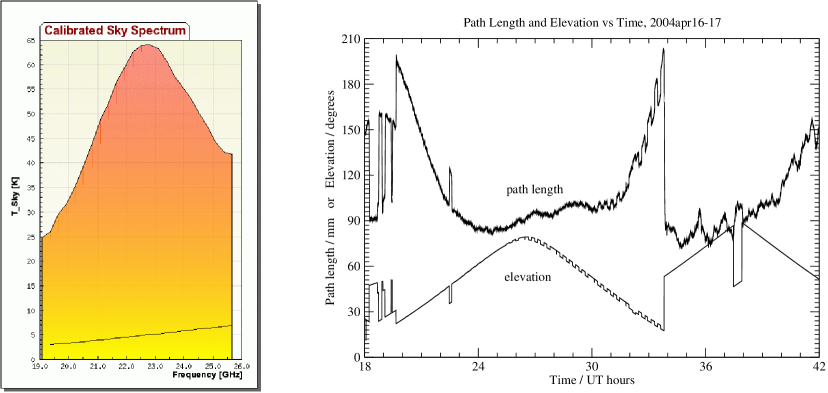
A typical time series of tropospheric path length inferred from the WVR is shown in Fig 1b. This shows a 24 h period during the 86 GHz VLBI experiment on 2004apr16 to 17. The path length varies with elevation as the airmass changes and the short-term path-length fluctuations grow throughout the period due to a change in the weather.
A 7 min piece of the time series is shown in Fig 2a along with the measured VLBI phase on the baseline Effelsberg to Pico Veleta. The inferred path length and the observed VLBI phase correlate strongly. Correcting the VLBI phase with the WVR corrections reduced the path rms from 1.0 mm rms to 0.47 mm rms and raised the coherence from 0.45 to 0.86 for a 240 s time-scale. Phase correction data from Pico Veleta from the 230 GHz continuum radiometer described by Bremer (2002) were applied, further reducing the rms path fluctuations to 0.34 mm and raising the coherence to 0.9. In total the coherent signal-to-noise ratio improved by a factor of 2.1.
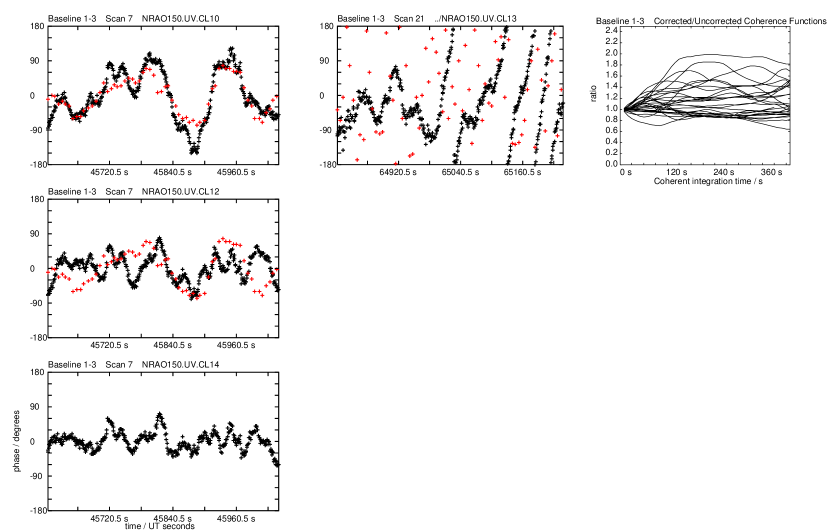
Another scan during cloud is shown in Fig 2b. The phase corrections varied dramatically and no phase correlation could be seen. We are now improving the cloud separation. Phase correction in the presence of cloud has been reported by Bremer (2006) at Plateau de Bure.
The fraction of scans for which the WVR corrections improved the coherence is summarized in Fig 2c, which shows the coherence after correction divided by the coherence before correction. If the correction makes an improvement, the ratio is greater than unity. Most scans lie between 1 and 2, with the worst case being 0.75. Scans affected by cloud were removed for this summary.
Corrections applied to four subsequent 86 GHz VLBI experiments yielded no further cases of improved coherence; in these four experiments applying WVR corrections increased the rms phasse noise, unfortunately. The cause is under investigation; perhaps the atmospheric stability during those experiments was already very good and the WVR noise raised the rms. This is supported since the WVR corrections were often seen to be stable and the VLBI phase wandered by rather more suggesting that the phase noise was dominated by the other end of the baseline. Other observatories have also seen periods when the phase corrections from WVRs fail to reduce the tropospheric phase noise at the VLA (Chandler et al. 2004), Plateau de Bure (Bremer 2006), and OVRO (Woody, Carpenter & Scoville 2000) though not as often as in our tests.
4 Validation of Absolute Calibration
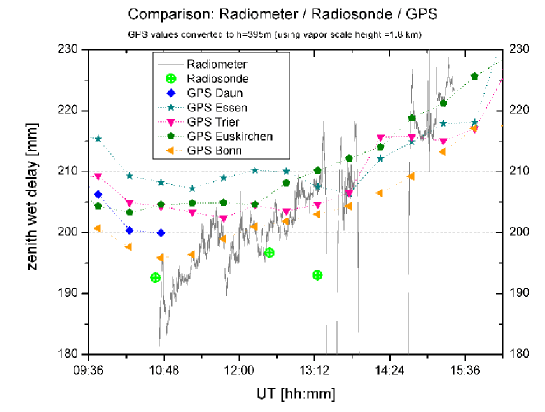
Astrometric and geodetic applications of water vapour radiometry require good absolute calibration; low thermal noise is less important. To check the absolute calibration, we carried out an intercomparison of WVR, five GPS stations closest to Effelsberg out to 120 km and three radiosonde launches on 2005jul27. The GPS data were analyzed at GeoForschungsZentrum, Potsdam and the radiosonde data were analyzed by C. Simmer at the Dept of Meteorology, Uni. Bonn to derive zenith tropospheric path delays. We found agreement within 15 mm between the WVR, all GPS receivers and three radiosonde launches (Fig 3).
5 Lessons Learned
We came to appreciate the critical importance of good temperature stabilization for maintaining absolute calibration and maintaining the short-term gain stability required for phase correction. We had initially 0.7 ∘C variation in the internal temperature over a 24 h period, however superimposed on this was a temperature oscillation with a 3 min period and peak-to-peak amplitude of 20 mK due to the time lag for heat flow from the Peltier element to the temperature sensor located beside the LNA. The temperature oscillation caused the detector output power to vary by 250 mK peak-to-peak which was enough to degrade the phase correction. We stopped the oscillation by weakening the thermal contact between the Peltier element and the RF components by reducing the speed of a fan and removing copper straps but the internal temperature then followed the external temperature more closely, producing 6 ∘C or more temperature changes over periods of days. Much tighter temperature regulation has been demonstrated by, for example, Tanner (1998).
The frequency spanned by the radiometer might be too narrow to allow separation of cloud emission with the precision required to allow phase correction to continue during periods of heavy cloud. A channel on the continuum at 50 GHz would help this a lot (Crewell 2006). However, phase correction in the presence of clouds with a narrower frequency span than ours has been demonstrated by Bremer (2006) at Plateau de Bure, thus proving the principle.
The spillover contribution is unexpectedly large (8 K) since the feedhorn over-illuminates the dish at low frequencies. A new horn with larger edge taper will alleviate this source of noise.
The noise diode proved somewhat unstable, and the system gain variations could be better removed using the temperature measured near the LNA along with the temperature coefficient of the amplifier. Methods to improve the noise diode stability have been described by Tanner (1998).
6 Conclusion
The Effelsberg water vapour radiometer corrections have been demonstrated to improve phase coherence during one high-frequency VLBI experiment, though not in four subsequent experiments. The tropospheric delay measurements agreed with 15 mm accuracy when compared to GPS and radiosondes.
References
- [1] M. Bremer 2002, Atmospheric Phase Correction for Connected-Element Interferometry and for VLBI in Astronomical Site Evaluation in the Visible and Radio Range. ASP Conference Proceedings, Vol. 266, eds J. Vernin, Z. Benkhaldoun, and C. Muñoz-Tuñón. (San Francisco: Astronomical Society of the Pacific) p238
- [2] M. Bremer 2006, in Proc. RadioNet Workshop on Measurement of Atmospheric Water Vapour: Theory, Techniques, Astronomical and Geodetic Applications, Wettzell / Hoellenstein, October 9-11 2006 (in preparation)
- [3] C. J. Chandler, W. F. Brisken, B. J. Butler, R. H. Hayward & B. E. Willoughby 2004, EVLA Memo 73
- [4] S. Crewell 2006, in Proc. RadioNet Workshop on Measurement of Atmospheric Water Vapour: Theory, Techniques, Astronomical and Geodetic Applications, Wettzell / Hoellenstein, October 9-11 2006 (in preparation)
- [5] H. Falcke, F. Melia, & E. Agol 2000, ApJ, 528, L13
- [6] T. P. Krichbaum, D. A. Graham, W. Alef et al. 2004, Towards the Event Horizon - The Vicinity of AGN at Micro-Arcsecond Resolution in Proc. 7th EVN Symposium, Toledo (Spain), October 12-15 2004, eds R. Bachiller, F. Colomer, J.-F. Desmurs & P. de Vicente, (OAN: Spain), p15
- [7] A. L. Roy, U. Teuber, & R. Keller 2004, The Water Vapour Radiometer at Effelsberg in Proc. 7th EVN Symposium on New Developments in VLBI Science and Technology, Toledo (Spain), October 12-15 2004, eds R. Bachiller, F. Colomer, J.-F. Desmurs & P. de Vicente, (OAN: Spain), p265
- [8] D. A. Tahmoush & A. E. E. Rogers 2000, Radio Sci, 35, 1241
- [9] A. B. Tanner 1998, Radio Sci, 33, 449
- [10] D. Woody, J. Carpenter & N. Scoville 2000, Phase Correction at OVRO Using 22 GHz Water Line Monitors in Imaging at Radio through Submillimeter Wavelengths ASP Conference Proceedings, Vol. 217, eds J. G. Mangum & S. J. E. Radford, (San Francisco: ASP) p317