THE [O ii] LUMINOSITY FUNCTION AND STAR FORMATION RATE AT IN THE COSMOS 2 SQUARE-DEGREE FIELD AND THE SUBARU DEEP FIELD11affiliation: Based on data collected at Subaru Telescope, which is operated by the National Astronomical Observatory of Japan.
Abstract
We have carried out a wide-field imaging survey for [O ii] emitting galaxies at in the HST COSMOS 2 square degree field using the Suprime-Cam on the Subaru Telescope. The survey covers a sky area of 6700 arcmin2 in the COSMOS field, and a redshift range between 1.17 and 1.20 (), corresponding to a survey volume of 5.56 Mpc3. We obtain a sample of 3176 [O ii] emitting galaxies with observed emission-line equivalent widths greater than 26 Å. Since our survey tends to sample brighter [O ii] emitting galaxies, we also analyze a sample of fainter [O ii] emitting galaxies found in the Subaru Deep Field (SDF). We find an extinction-corrected [O ii] luminosity density of ergs s-1 Mpc-3, corresponding to star formation rate density of yr-1 Mpc-3 in the COSMOS field at . This is the largest survey for [O ii] emitters beyond currently available.
1 INTRODUCTION
Measurements of the galaxy star formation rate density (SFRD) are one of the most important issues concerning studies of formation and evolution of galaxies. Since the pioneering study by Madau et al. (1996), a number of observational studies have been made to investigate both metal-enrichment history and star formation history in galaxies as a function of age or redshift (e.g., Gallego et al. 1995; Ellis et al. 1996; Lilly et al. 1996; Hogg et al. 1998; Tresse & Maddox 1998; Madau, Pozzetti, & Dickinson 1998; Pettini et al. 1998; Steidel et al. 1999; Barger et al. 2000; Fujita et al. 2003a; Giavalisco et al. 2004; Dickinson et al. 2004; Taniguchi et al. 2005; Bouwens & Illingworth 2006). A current picture is that the SFRD steeply increases for first 900 Myrs (from to ), peaks at , and then decreases strongly to the present day (e.g., Bouwens & Illingworth 2006). It is important to investigate what happened in first 900 Myrs in early universe (Taniguchi et al. 2005; Kashikawa et al. 2006; Bouwens & Illingworth 2006 and references therein). And, it is also important to investigate what happened from to because galaxies as well as large-scale structures could have rapidly evolved in this era.
Star formation activity in galaxies could be linked to galaxy environments because interaction and merging events can trigger intense star formation. Therefore, it is necessary to investigate co-evolution between galaxies and large-scale structures (e.g., Scoville et al. 2007). Recently, large-scale structures with a scale of several tens to 100 Mpc have been reported for samples of Ly emitters or Lyman break galaxies (LBG); i.e. star-forming galaxies, at (e.g., Steidel et al. 1998; Shimasaku et al. 2003; Ouchi et al. 2005a; Kashikawa et al. 2006). At , such large-scale structure of galaxies with a scale over 10 Mpc have also been reported (Tanaka et al. 2001; Nakata et al. 2005; Gal, Lubin & Squires 2005). These observational results appear to be consistent with -body simulations which suggest that clusters of galaxies at are still in the formation process (e.g., Moore et al. 1998). Therefore, more detailed studies on clustering of galaxies at are crucially important to understand the evolution of large-scale structures as well as that of galaxies themselves.
It is, however, difficult to obtain a large sample of galaxies beyond . Although optical broad-band imaging could detect a large number of LBGs, the accuracy of photometric redshifts is not high enough to obtain a sample of galaxies at a concerned redshift interval. Spectroscopic surveys are useful to obtain such a sample. However, since most galaxies beyond are faint, we need a lot of observing time to carry out such a program. Another method is to carry out an optical survey with a narrowband filter to isolate strong emission-line galaxies beyond . However, beyond , the H emission line, which is a good tracer of star formation rate (e.g., Gallego et al. 1996; Hammer et al. 1997; Jansen et al. 2001; Teplitz et al. 2003; Hopkins 2004 and references therein), is no longer detectable in the visible window. Therefore, the [O ii] emission line provides an estimator of the star-formation activity in galaxies. Although this line is considered to be a less reliable tracer of star formation rate because its line intensity is more affected by dust obscuration (Kennicutt 1998), careful comparisons among SFRs derived with various observables (e.g., H, [O ii], UV, and so on) are consistent within a factor of three (Cram et al. 1998; Hopkins 2004). Therefore, this line has the clear advantage of being observable in the visible bands over the interesting redshift range of , where the SFRD is thought to be changing rapidly.
In this paper, we present results of our narrowband imaging survey for [O ii] emitters at in the Cosmic Evolution Survey (COSMOS; Scoville et al. 2007) 2 square degree field. This survey was carried out during the course of Subaru imaging surveys of the COSMOS field (Taniguchi et al. 2007; see also Murayama et al. 2007) by using the narrowband filter NB816 [ Å and (FWHM) = 120 Å] available for the prime-focus, wide-field camera, Suprime-Cam on the 8.2m Subaru Telescope (see Section 2.1). Since the Suprime-Cam provides a very wide field of view; , this is suitable for wide-field optical imaging surveys. Through the large area covered by the COSMOS, we can obtain the largest sample of [O ii] emitting galaxies beyond by performing narrowband imaging of this field, targeting galaxies at . Such a large sample can improve the precision of our estimates of the SFRD at .
However, the COSMOS can sample only brighter [O ii] emitting galaxies because of relatively shallower survey depths. In order to obtain an accurate luminosity function of [O ii] emitters, it is also necessary to probe faint [O ii] emitters. For this purpose, we analyze a sample of fainter [O ii] emitters taken from the Subaru Deep Field (SDF; Kashikawa et al. 2004) where the same narrowband filter (NB816) was used (see Section 2.2). Although the SDF covered sky area is of the COSMOS field, the much deeper survey depth of the SDF makes it possible to explore faint objects and determine the faint end slope of the luminosity function of [O ii] emitting galaxies.
Throughout this paper, magnitudes are given in the AB system. We adopt a flat universe with the following cosmological parameters; , , and .
2 PHOTOMETRIC CATALOG
2.1 The HST COSMOS Field
The Cosmic Evolution Survey (COSMOS) is a 2 square degree imaging survey centered at (J2000) and (J2000) (Scoville et al. 2007). Our optical narrow-band imaging observations of the HST COSMOS field have been made with the Suprime-Cam (Miyazaki et al. 2002) on the 8.2 m Subaru Telescope (Kaifu et al. 2000; Iye et al. 2004) at Mauna Kea Observatories.
In this analysis, we use the COSMOS official photometric redshift catalog which includes objects whose total magnitudes ( or ) are brighter than 25 mag. The catalog presents diameter aperture magnitude of Subaru/Suprime-Cam , , , , , and NB816 111Our SDSS broad-band filters are designated as , , and in Capak et al. (2007) to distinguish from the original SDSS filters. Also, our and filters are designated as and in Capak et al. (2007) where means Johnson and Cousins filter system used in Landolt (1992).. Our NB816 imaging data of the COSMOS field are also used to search both for Ly emitters at (Murayama et al. 2007) and for emitters at (Shioya et al. 2007). Details of the Suprime-Cam observations are given in Taniguchi et al. (2007).
Because the accuracy of standard star calibration ( magnitude) is too large for obtaining accurate photometric redshifts, Capak et al. (2007) re-calibrated the photometric zero-points for photometric redshifts using the SEDs of galaxies with spectroscopic redshifts. Following the recommendation of Capak et al. (2007), we apply the zero-point correction to the photometric data in the official catalog. The offset values are 0.189, 0.04, 0.040, 0.020,0.005, 0.054 and 0.072 for , , , , , , and , respectively. The zero-point corrected limiting magnitudes are , , , , and for a detection on a diameter aperture. The catalog also includes diameter band aperture magnitude from CFHT. We use the CFHT magnitude for bright galaxies with mag because they appear to be less affected by the saturation effects. All magnitudes are corrected for the Galactic extinction; (Capak et al. 2007). Details of the COSMOS official photometric redshift catalog is presented in Mobasher et al. (2006).
2.2 The Subaru Deep Field
We used a catalog obtained by the Subaru Deep Field (SDF) project (Kashikawa et al. 2004). The SDF project is the deepest optical imaging survey using the Suprime-Cam on the Subaru Telescope. The SDF is located near the North Galactic Pole, being centered at (J2000) and (J2000). The SDF project official photometric catalog is obtained from the SDF site (http://step.mtk.nao.ac.jp/sdf/project/). In this work, we used , , , , , and NB816 data given in the selected catalog with diameter aperture photometry. Note that we correct NB816 magnitudes in the SDF photometric catalog because there is a small photometric offset ( mag). The limiting magnitudes for a detection on a diameter aperture are as follows; , , , , , and mag. The PSF size in this catalog is 0.98. All magnitudes are corrected for the Galactic extinction; (Schlegel et al. 1998). This complements our COSMOS [O ii] survey by extending it to fainter flux limits.
Table 1 summarizes the covered sky area, survey volume and photometric property in the COSMOS field and the SDF. Since the central wavelength of NB816 filter corresponds to a redshift of 1.2 for [O ii] emission, together with the broadband filter data, we can carry out a search for [O ii] emitters at .
3 RESULTS
3.1 Selection of NB816-Excess Objects
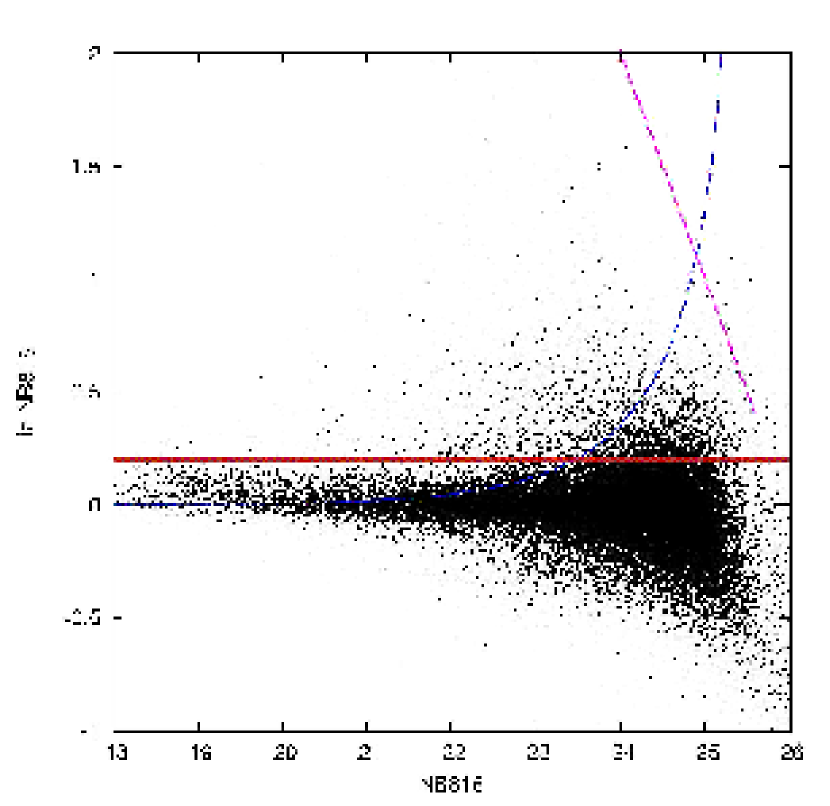
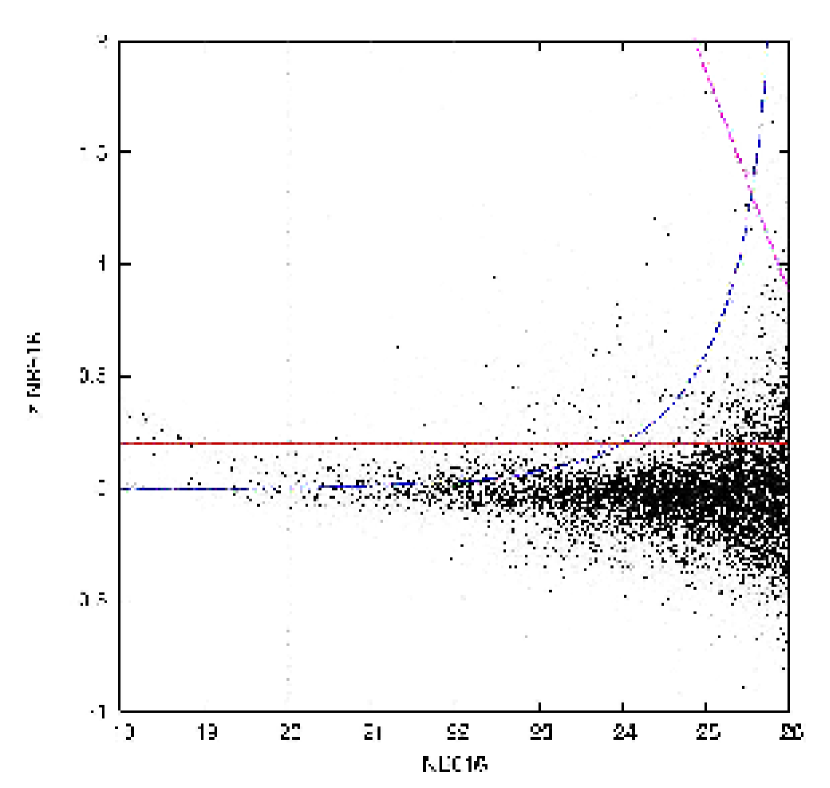
In order to select NB816-excess objects efficiently, it is desirable to have a wavelength-matched continuum image as off-band data. Since the central wavelength of the NB816 filter is different either from those of ( or ) and filters, we make a wavelength-matched continuum, “ continuum”, using the following linear combination; where and are the ( or ) and flux densities, respectively. Its 3 limiting magnitude is mag in a diameter aperture in the COSMOS field, while mag in the SDF. Note that we use the CFHT magnitude for the bright galaxies with mag in the COSMOS field since their magnitudes suffer from saturation effects. This enables us to more precisely sample the continuum at the same effective wavelength as that of the NB816 filter.
Taking both the scatter in the color and our survey depth into account, candidate line-emitting objects are selected with the following criteria.
| (1) |
and
| (2) |
where corresponds to Å. We will justify these adopted criteria in Section 3.3. We compute the of the color as
| (3) |
These two criteria, (1) and (2), are shown in Figure 1 by the red and blue solid lines, respectively.
In the COSMOS field, taking account of the homogeneity of the noise level, we select galaxies in the following region: and . The effective survey area is 6700 arcmin2. We find 5824 sources in the COSMOS field that satisfy the above criteria.
In the case of the SDF, objects with mag appear to be saturated. In order to avoid such saturated bright objects, we have also imposed the criterion mag to the SDF sample. We then find 602 sources that satisfy the above criteria in the SDF.
Note that the above NB816-excess objects found in both the COSMOS field and the SDF are brighter than the limiting magnitude in all bands.
3.2 Selection of NB816-Excess Objects at
A narrowband survey of emission-line galaxies can potentially detect galaxies with different emission lines at different redshifts. Strong emission lines that we would expect to detect are H, H, [O iii]4959,5007 and [O ii] (Tresse et al. 1999; Kennicutt 1992b). In Table 2 we show redshift coverages of those emission lines for the NB816 filter.
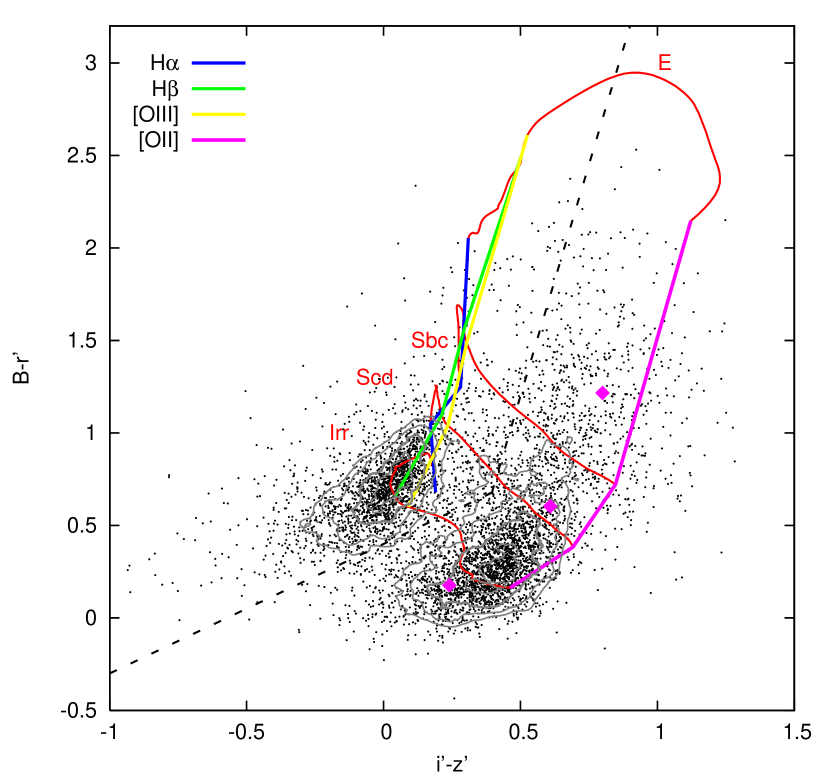
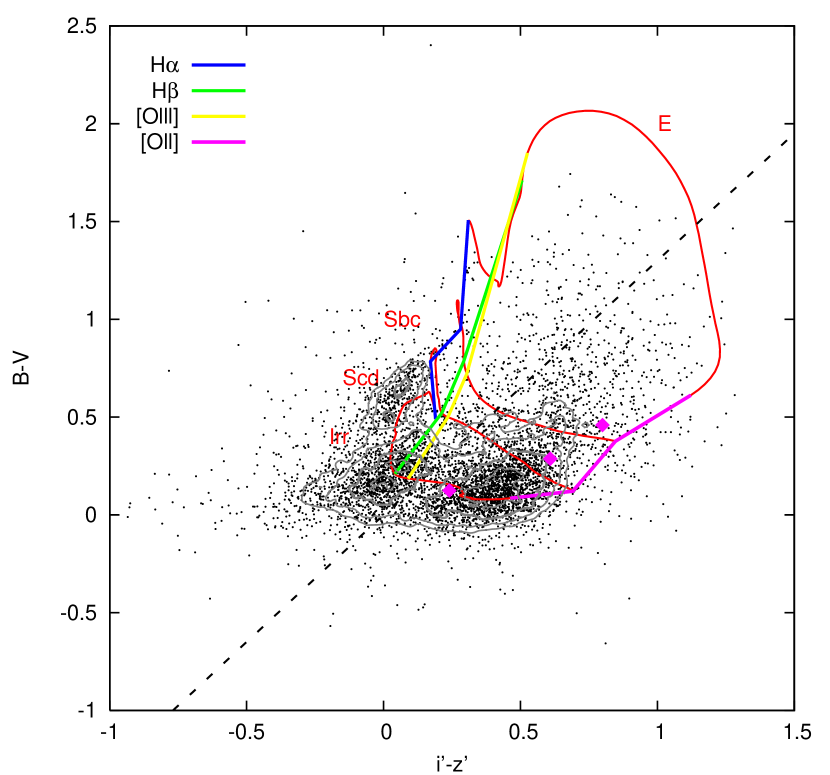
In order to distinguish [O ii] emitters at from other emission-line objects at different redshifts, we investigate their broad-band color properties. In the upper panels of Figures 2 and 3, we show the vs. and vs. color-color diagram for the 5824 sources in the COSMOS field together with the loci of model galaxies taken from Colman, Wu, & Weedman (1980). We can clearly see some clumps in the diagrams. We also calculated local surface density on the diagrams shown by the contours. The contour levels correspond to 2, , /2 and /3, where corresponds to the mean surface density on each color-color diagram. These contours show prominent sequences close to the model predictions for [O ii] emitters, with distinct, H or H or [O iii]4959,5007 emitter in the diagrams.
Taking account of the model lines and the surface density contours on the diagram, we find that [O ii] emitters at can be selected by adopting the following criteria on the vs. color-color diagram;
| (4) |
or,
| (5) |
and on the vs. color-color diagram;
| (6) |
The candidates which satisfy both of the criteria are selected to be [O ii] emitters at . These criteria give us a sample of 3178 [O ii] emitting galaxy candidates in the COSMOS field. We can distinguish [O ii] emitters from H or H or [O iii] emitters using these criteria. Since the two brightest [O ii] emitters seem to be AGNs, we do not include them in our final samples. Therefore, we finally obtain a sample of 3176 [O ii] emitting galaxy candidates in the COSMOS field. Note that three [O ii] emitters at confirmed by spectroscopy (pink points in the upper panels of Figures 2 and 3; see section 3.3) are satisfied with the three criteria.
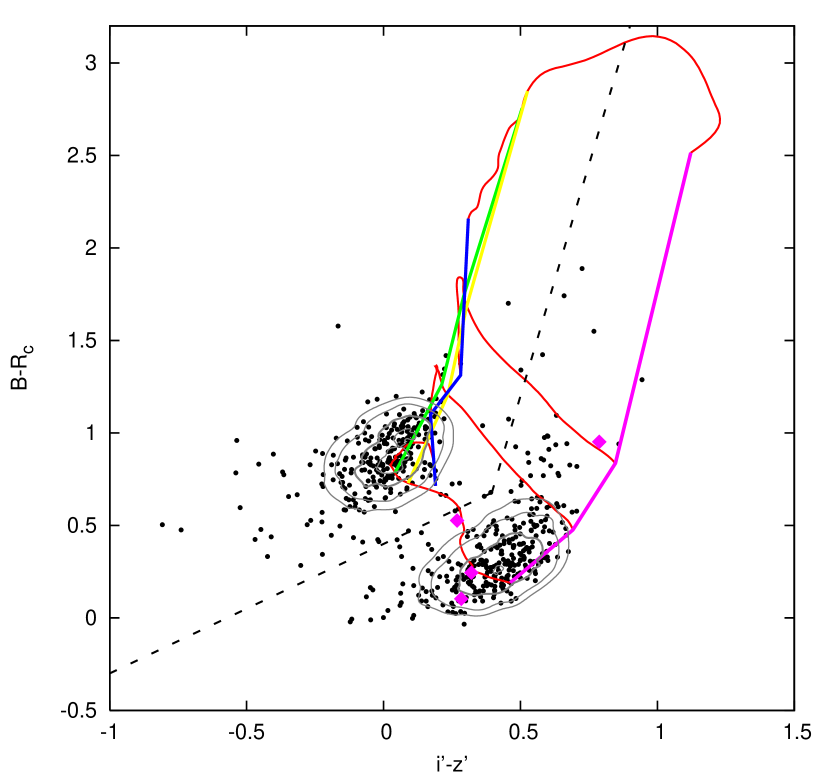
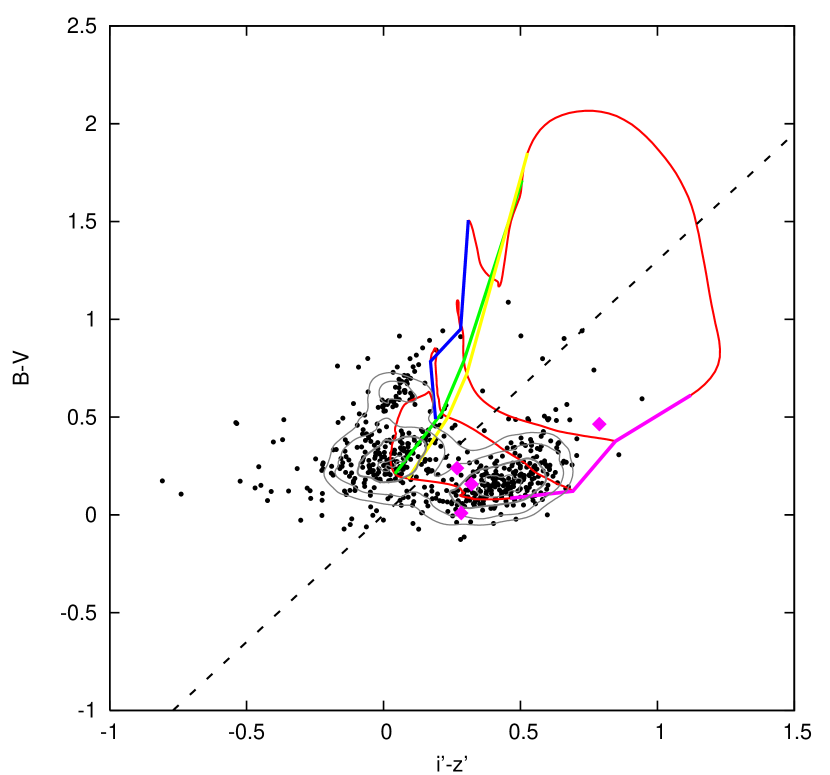
Next, we distinguish [O ii] emitters at from emission-line objects at other redshifts in the SDF. In the lower panels of Figures 2 and 3, we show the vs. and vs. color-color diagram for the 602 sources in the SDF. The contour levels are the same as above. Taking account of the model lines and contours of distribution on the diagram, we find that [O ii] emitters at can be selected by adopting the following criteria on the vs. color-color diagram;
| (7) |
or,
| (8) |
and on the vs. color-color diagram;
| (9) |
The candidates which satisfy both of the criteria are selected to be [O ii] emitters at . These criteria give us a sample of 295 [O ii] emitting galaxy candidates in the SDF. After eye inspection of the images, we rejected one object, which appears to be noise. Therefore, we obtain a sample of 294 [O ii] emitting galaxy candidates in the SDF. Note that four [O ii] emitters at confirmed by spectroscopy (pink points in the lower panels of Figures 2 and 3; see section 3.3) are satisfied with the three criteria.
In this way, we obtain our final [O ii] emitting galaxy candidates in both COSMOS and SDF. To our knowledge, this is the largest survey for [O ii] emitters beyond currently available.
In order to investigate how our selection criteria (4) - (6) on the color-color diagrams affect completeness of the [O ii] emitters and contamination of the other emitters, we examined the number distribution of emitter candidates as a function of distance from the adopted selection line on each color-color diagram in the COSMOS field. The three distinct peaks of H + [O iii], H, and [O ii] emitters can be seen in the distribution of vs. color-color diagram shown in the right panel of Figure 4 while prominent two peaks of [O ii] emitters and that of other emitters can be seen for the vs. color-color diagram in the left panel of Figure 4. We fit the distributions with the Gaussian and estimate the amount of contamination by H or H + [O iii] emitters and incompleteness of the [O ii] emitters. Then we find that the amount of contamination and incompleteness are 2% and 3%, respectively. Thus, using the two color-color diagrams, our procedures presented here can be basically free from contaminations from H or H or [O iii] emitters and allows us to select reliable [O ii] emitter samples at .
3.3 Optical Spectroscopy
Our pilot spectroscopic survey for objects in the COSMOS field is now progressing (z-COSMOS; Lilly et al. 2006). The first results from z-COSMOS have already confirmed that the three galaxies (ID 948253, ID 1297800, and ID 1690252) are star-forming galaxies at (see Appendix).
If we adopted the NB-excess criterion of and the same color-color selection as we have described in Section 3.2, our photometric sample would contain 8 galaxies which were spectroscopically observed. The four galaxies among them are star-forming galaxies at . However, the remaining four galaxies are all at where the [O ii] emission line is out of the bandpass of the NB816 filter. Since we find no H or H or [O iii] emitters in our spectroscopic sample, our color-color selection criteria are reliable discriminators between [O ii] emitters at and other emission line objects.
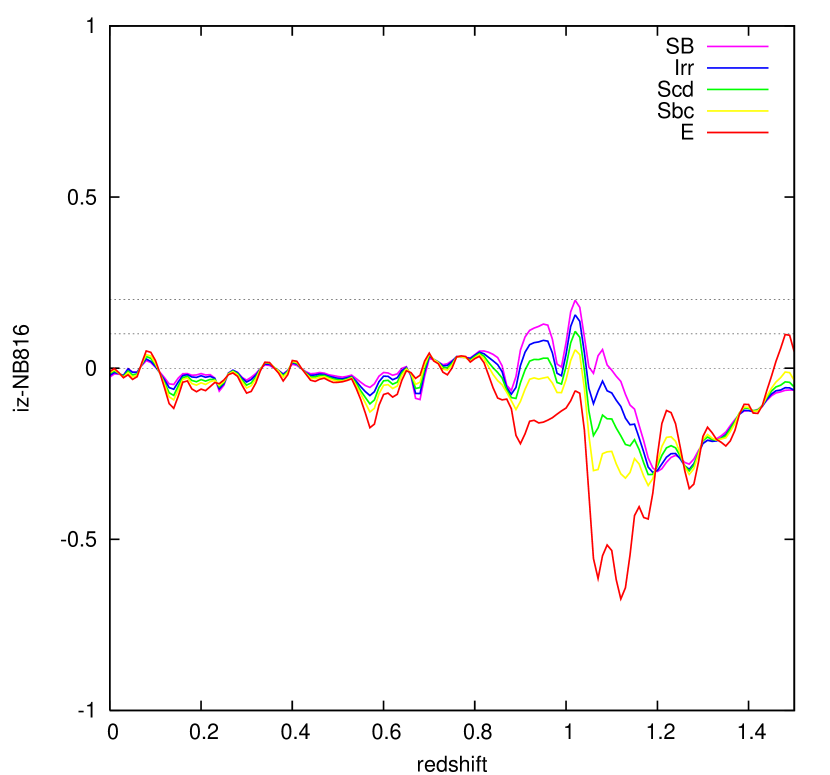
However, we have to mention why we find galaxies at in spectroscopy. To investigate the detection at , we calculated evolution of color by using the population synthesis model, GALAXEV (Bruzual & Charlot 2003), and found that continuum feature of galaxies at makes NB816-excess as shown in Figure 5. Note that emission-line features are not included in Figure 5. Although one of the [O ii] emitters at with small NB816-excess are removed, all four detections at can be removed by criterion of as expected. Therefore, candidate line-emitting objects are selected with the criterion of . Thus, it is expected that there is little contamination from objects at other different redshifts in our [O ii] emitter sample.
In the case of the SDF, redshifts of the following four [O ii] emitters selected here (ID 27396, ID 29922, ID 36025, and ID 178592) were also confirmed spectroscopically by Ly et al. (2006). Their spectroscopic redshifts are 1.1818, 1.1813, 1.1798, and 1.1783, respectively.
3.4 [O ii] Luminosity
The line flux, , is given by:
| (10) |
where and are the flux densities in each filter, with and being the effective bandwidth in those filters. The limiting observed line flux in the COSMOS field and that of the SDF are ergs s-1 cm-2 and ergs s-1 cm-2, respectively.
In order to obtain the [O ii] luminosity for each source, we apply a mean internal extinction correction to each object. To compare our result with the previous investigations compiled by Hopkins (2004), we use the same extinction correction method as that proposed by Hopkins (2004); mag and the Cardelli et al. (1989) Galactic obscuration curve. Note that this corresponds to and mag at the wavelength of [O ii]3727. We also apply a statistical correction (21%; the average value of flux decrease due to the NB816 filter transmission) to the measured flux because the filter transmission function is not square in shape (Fujita et al. 2003b). The [O ii] flux is then given by:
| (11) |
Finally, the [O ii] luminosity is estimated by . In this procedure, we assume that all the [O ii] emitters are located at that is the redshift corresponding to the central wavelength of NB816 filter. Therefore, the luminosity distance is set to be Mpc. For the COSMOS field, the aperture effect is corrected by using the offset between diameter aperture and total magnitude given in the COSMOS official photometric catalog (Capak et al. 2007). For the SDF, we used the total magnitude in the SDF official catalog (Kashikawa et al. 2004). The basic data of [O ii] emitter candidates, including aperture magnitude of , , , , and photometric errors in the COSMOS field and the SDF are listed in Tables 3 and 4, respectively. These tables also include line flux and [O ii] luminosity .
4 DISCUSSION
4.1 Luminosity Function of [O ii] Emitters
In order to investigate the star formation activity in the galaxies at detected here, we construct the luminosity function (LF) for our COSMOS and SDF [O ii] emitter samples. The LF is given by the relation,
| (12) |
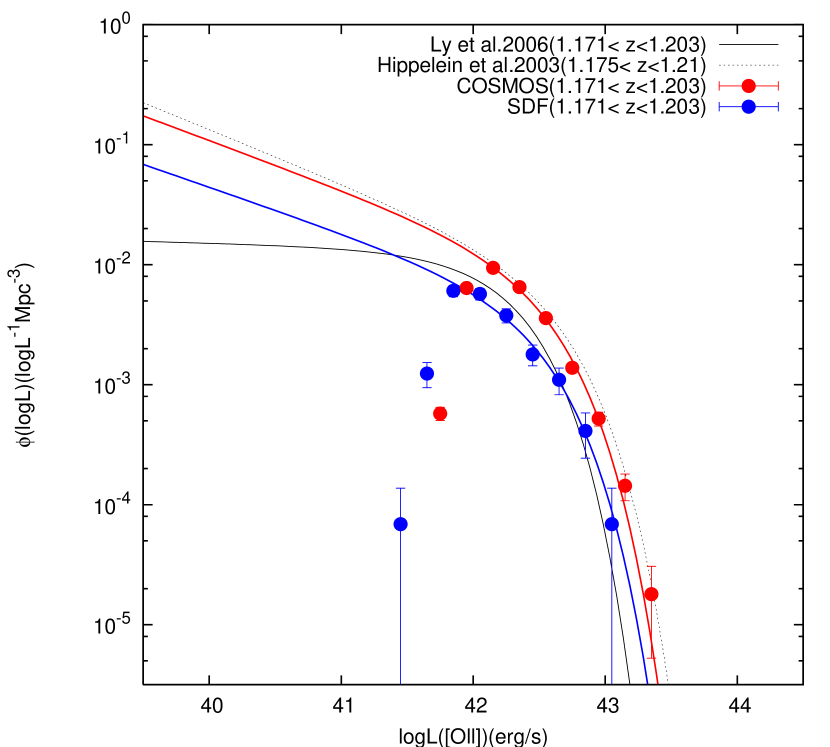
where is the comoving volume and is number of galaxies with [O ii] luminosity within the interval of [O ii][O ii]. We have used [O ii] = 0.2. The [O ii] LFs of the COSMOS field and SDF are shown in the upper panel of Figure 6. The number counts and the LFs obtained in both the COSMOS field and SDF are given in Table 5.
The samples that characterize the faint end slope of the [O ii] LF may be incomplete due to our selection criteria. The [O ii] LF looks to be incomplete at for the COSMOS field and at for the SDF. To investigate the lowest luminosity at which the [O ii] LF is still sufficiently complete, we checked the luminosity where the maximum number count appears in the LF. We examined several cases when the bins of the LF are slightly shifted for avoiding that the selection of bins of the LF affects this analysis. We finally found and 41.77, are expected to be the completeness limit in the COSMOS field and SDF, respectively. We fit the [O ii] LFs at with the Schechter function (Schechter 1976) by the maximum likelihood parametric fit (the STY method; Sandage et al. 1979).
We obtain the following best-fitting parameters for our [O ii] emitters in the COSMOS field with , , and , in the SDF with , , and . The results of Schechter function fit are overlayed in the upper panel of Figure 6.
Since the Schechter function parameter is sensitive to the incompleteness at the faint end, we also investigate the change of as a function of limiting luminosity . We confirmed that the best-fit changes fast from when the is decreased from 42.03 (COSMOS) and 41.77 (SDF). On the other hand, the best-fit changes slowly from when the is increased from 42.03 (COSMOS) and 41.77 (SDF). For example, () = (41.98, -1.15), (42.03, -1.41), (42.08, -1.55) for the COSMOS field, and () = (41.72, -1.08), (41.77, -1.38), (41.82, -1.60) for the SDF, respectively. Thus, we conclude that the adopted completeness limits of = 42.03 (COSMOS) and 41.77 (SDF) are well determined and that derived Schechter parameters are robust for the incompleteness.
When our results of the COSMOS field and SDF are compared, the number density of the COSMOS field is higher by a factor of than that of the SDF because the of the COSMOS field is twice as large as that of the SDF while is nearly the same for the both fields. In spite of deeper survey depth of the SDF, the faint end slope of the LF for the COSMOS field and the SDF yields a similar slope. The lower panel of Figure 6 shows the 1, 2, and 3 contour levels in the parameter space from the STY analysis. It can be seen that the and are highly correlated. We therefore conclude that the large number statics of the COSMOS field provides both the reliable bright and faint ends of the [O ii] LF.
The [O ii] LF of previous studies (Ly et al. 2006; Hippelein et al. 2003) are also plotted in the upper panel of Figure 6. Hippelein et al. (2003) surveyed an area of 309 arcmin2 with using their own medium-band filters and selected 119 [O ii] emitters with the limiting observed luminosity of [O ii] ergs s-1. Our [O ii] LF of the COSMOS field is similar to that of Hippelein et al. (2003). The faint end slope of Hippelein et al. (2003) is in agreement with our value, , in the COSMOS field. Ly et al. (2006) selected 894 [O ii] emitters in the SDF by using the same catalogue of our analysis. The difference between our LF of the SDF and that of Ly et al. (2006) may be attributed to the following different source selection procedures: Ly et al. (2006) used (1) diameter aperture magnitude, (2) criterion of , , and the median for the NB816-excess of 0.10, (3) vs. and vs. color-color diagrams to isolate [O ii] emitters from other emitters at different redshifts, and (4) SFR-dependent correction of Hopkins et al. (2001) for extinction correction.
The number density of the [O ii] emitters in the SDF is always lower than those of the COSMOS field and Hippelein et al. (2003) at all the concerned luminosities. This difference is not due to selection method but probably to the effect of cosmic variance. One possible idea seems to be that the SDF samples a relatively low number density region of star-forming galaxies at because the number density obtained in the COSMOS field with the covered area of deg2 is expected to be closer to an average number density in the Universe. Further analysis of [O ii] luminosity function at in other fields will be required to confirm that this is indeed effect of cosmic variance.
4.2 Luminosity Density and Star Formation Rate Density
The [O ii] luminosity density is obtained by integrating the LF:
| (13) |
where is Gamma function. We find the total [O ii] luminosity per unit comoving volume to be and ergs s-1 Mpc-3 at in the COSMOS field and the SDF from our best fit LF, respectively. The star formation rate can be estimated from the [O ii] luminosity using the relation
| (14) |
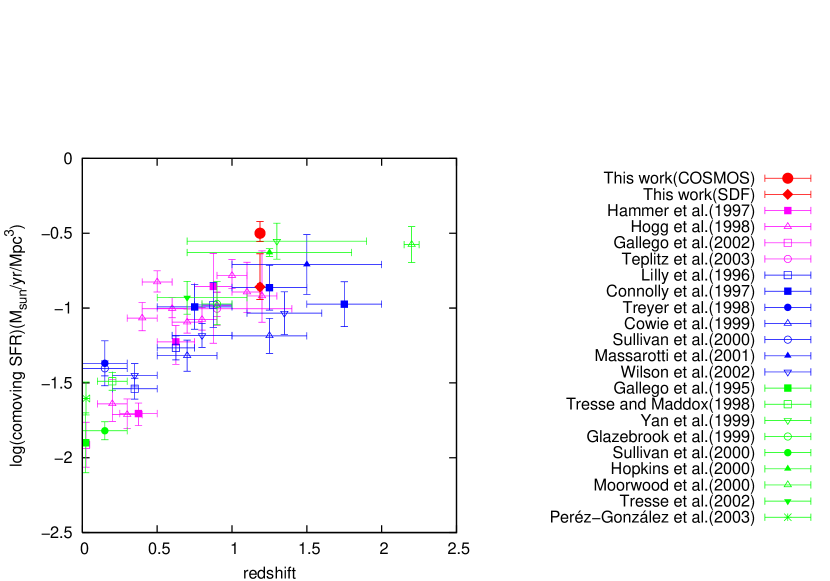
where [O ii] is in units of ergs s-1 (Kennicutt 1998). Thus, the [O ii] luminosity density can be translated into the SFR density of and yr-1 Mpc-3 in the COSMOS field and the SDF, respectively. This SFRD from [O ii] luminosity in the COSMOS field is estimated by using the statistically largest sample studied so far. The vertical error bar due to the number statistics is definitively small, and the horizontal error bar due to the width of the narrowband filter is also small compared with other spectroscopic surveys.
Figure 7 shows the evolution of the SFRD as a function of redshift from to . The previous investigations plotted here are compiled by Hopkins (2004), which have been converted to a common cosmology, consistent SFR calibrations, and consistent dust obscuration corrections where necessary. Our results follow the general of the strong decrease in the SFRD from to . If we carefully compare our results with previous ones, we find that the SFRD measured in the COSMOS field is consistent with that of Yan et al. (1999), while that of the SDF is consistent with that of Hogg et al. (1998). The difference among the SFRDs of the COSMOS field, SDF, and the other surveys may not surprising because the SFRD varies from space to space within at least factor of two due to the cosmic variance.
4.3 Spatial Distribution and Angular Two-Point Correlation Function
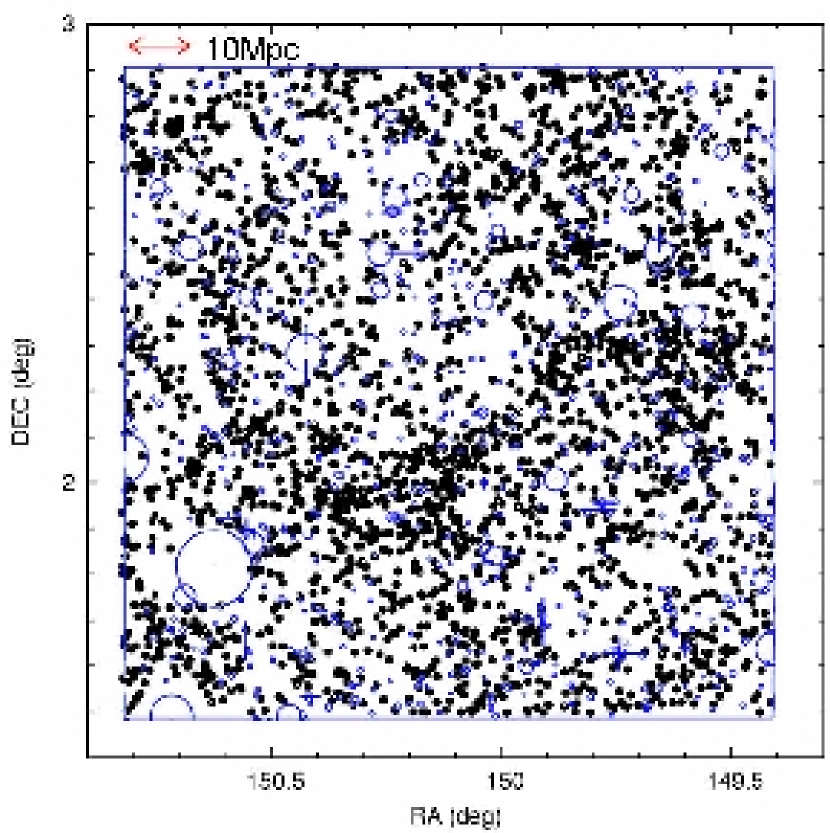
Figure 8 shows the spatial distribution of our 3176 [O ii] emitter candidates in the COSMOS field. There can be seen some clustering regions. In particular, it is worthwhile noting that there appears to be a filamentary structure near the central region of the field in Figure 8. If this is real, this filament extends across Mpc. At , large-scale clustering of red galaxies with the scale of Mpc have been identified (e.g., Tanaka et al. 2001; Nakata et al. 2005; Gal, Lubin & Squires 2005). Our result suggests that not only red galaxies but also relatively blue, star-forming galaxies form large-scale clustering at these redshifts.
To discuss the clustering properties more quantitatively, we derive the angular two-point correlation function (ACF), , using the estimator defined by Landy & Szalay (1993),
| (15) |
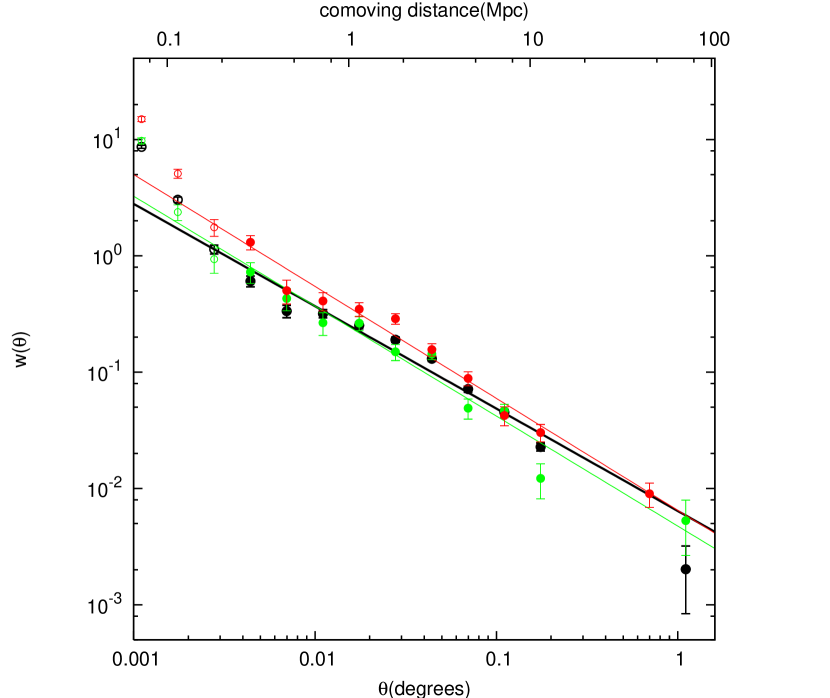
where , , and are normalized numbers of galaxy-galaxy, galaxy-random and random-random pairs, respectively. The random sample consists of 100,000 sources with the same geometrical constraints as the galaxy sample. Figure 9 shows the ACF of our 3176 and 294 [O ii] emitter candidates in the COSMOS field () and SDF (), respectively. The wide area of the COSMOS allows us to see the clustering properties at , 90 90 Mpc2 (comoving), while that of the SDF is 30 40 Mpc2. Note that our narrowband survey samples the thickness of 70 Mpc at along the line of sight, corresponding to the band width of the NB816.
In spite of the different field, amplitude and slope of the ACF are almost consistent among the COSMOS field and the SDF. The ACFs of [O ii] emitters show significant excess on small scales. For sample of degree (filled black points), the ACF of the COSMOS field is fit by power law, ; and (black line). Note we did not include negative value of on .
If the real-space correlation function is modeled as a power law, , we can infer the best-fit power law for from using the Limber transform (Peebles 1980; Phillipps 2005). This gives
| (16) |
| (17) |
where
| (18) |
and
| (19) |
where is the proper distance. Note that depends only on the selection function . Assuming that the redshift distribution of the [O ii] emitters is a top-hat shape of , we convert the amplitude to the correlation length . Then we obtain and Mpc, where .
The correlation function at is also studied by Le Fvre et al. (2005) and Coil et al. (2006). Le Fvre et al. (2005) analysed 7155 galaxies with at , from the VIMOS VLT Deep Survey (VVDS). They obtained and Mpc, for the sub-sample of 561 galaxies at by power law fitting of the ACF in a proper length range of 0.1 – 10 Mpc. Coil et al. (2006) analysed 25,000 galaxies with at from the DEEP2 Galaxy Redshift Survey. From power law fitting of the ACF at 0.1 – 20 Mpc, and Mpc are obtained for the DEEP2 sub-sample (10530 galaxies with ).
The slope of the COSMOS is consistent with that of the VVDS within the errors. The relatively small value of is obtained in the DEEP2 () with respect to those of the COSMOS () and VVDS () samples. This is consistent with the result from the VVDS, which shows slight increase of the slope with increasing redshift (Le Fvre et al. 2005).
The correlation length of the COSMOS is smaller than those of the VVDS and DEEP2. This difference may be due to that the brighter galaxies are selected by the VVDS () and DEEP2 () than by our COSMOS [O ii] sample ( estimated by magnitude). It has been extensively studied that more luminous galaxies are more strongly clustered in the local universe (Norberg et al. 2001, 2002; Zehavi et al. 2005) and at (Coil et al. 2006; Pollo et al. 2006). Further, the selection method adopted in the DEEP2 tends to exclude relatively blue galaxies and may result in the larger correlation length than those of the COSMOS [O ii] sample and the VVDS sample. It is known that the early type galaxies tend to show stronger clustering than late type ones (Loveday, Tresse & Maddox 1999; Norberg et al. 2002).
Since our samples are selected by emission line features and thus biased to star-forming galaxies, the comparison is not straightforward. Therefore, we also compare our results with those of Meneux et al. (2006). They measure the spectral type dependence of correlation function using a sample of 6495 VVDS galaxies. The galaxies with spectroscopic redshifts were divided into four spectral classes from E/S0 (type 1), early spiral, late spiral and irregular/star-forming galaxies (type 4). Our [O ii] samples are expected to be almost late spiral and irregular star-forming galaxies (see, Figures 2 and 3), we compare with merging type 3 and 4. They find that merging type 3 and 4 galaxies at (1030 galaxies, effective redshift = 1.032) have and Mpc. The slope is in good agreement with that of the COSMOS within the errors. Although this correlation length is smaller than that of all galaxies in the VVDS and DEEP2, and closer to our value Mpc, it is still larger than our result. Note that the magnitude range of both analyses is nearly the same. A interpretation of this result is that strong emission line galaxies show weaker clustering than overall late type galaxies.
To investigate the dependence of [O ii] luminosity, we also derive the ACFs for sub samples of different luminosity bins in the COSMOS field; (1) [O ii], and (2) [O ii]. Note that [O ii] corresponds to the luminosity limit at the faint end. The green and red points in the upper panel of Figure 9 show the ACFs obtained for the faint subsample and for the bright subsample, respectively. By power-law fitting of each ACF in a range of degree we obtain and (shown by the green line in Figure 9) or and Mpc for the faint sample, and and (shown by the red line in Figure 9) or and Mpc for the bright sample. The ACF amplitudes in the COSMOS field are given in Table 6.
Our result that clustering increases with increasing luminosity is consistent with many previous investigations (Norberg et al. 2002; Zehavi et al. 2005; Coil et al. 2006; Lee et al. 2006). The deviation from the power law at a small scale is also reported by previous investigations (Zehavi et al. 2004; Ouchi et al. 2005b; Coil et al. 2006; Kashikawa et al. 2006; Lee et al. 2006). This could be explained by galaxy multiplicity in a single dark matter halo at higher luminosities and on smaller scale. We do not analyse luminosity dependence of the ACF in the SDF, because compared with the COSMOS field, the number statistics of the SDF is too small to carry out this detailed analysis of the clustering property.
5 SUMMARY
A wide-field narrowband imaging survey for [O ii] emitting galaxies at in the HST COSMOS 2 square degree field has been presented. Our main results and conclusions are as follows.
1. In this survey, we have found 3176 [O ii] emitting galaxies in a comoving volume of 5.56 Mpc3. This is the largest survey for [O ii] emitters beyond to date.
2. Although our survey samples numerous [O ii] emitting galaxies, most of them are relatively brighter ones with log ([O ii]) erg s-1. Therefore, it is difficult to investigate fainter parts of [O ii] luminosity function. In order to obtain more reliable information, we have also analysed optical photometric data of the Subaru Deep Field (SDF) available for public (Kashikawa et al. 2004). Then we have constructed the [O ii] luminosity function and found the star formation rate density of yr-1 Mpc-3 in the COSMOS field. This result is consistent with those of previous works at similar redshifts (see Hopkins 2004) within the errors.
3. The spatial distributions of [O ii] emitters show some over density regions over the entire field. In particular, a filamentary structure is found in the central region of the COSMOS field. Its extension is estimated as several tens Mpc. These results suggest that the star-forming galaxies at found here tend to cluster.
4. Our angular two-point correlation function of the COSMOS field is fit by a power law, . We confirmed the previous results that more luminous galaxies have stronger clustering strength. We found significant deviation from power law at small scale in the ACF of [O ii] emitters. This result is consistent with previous surveys (Zehavi et al. 2004; Ouchi et al. 2005; Kashikawa et al. 2006), which suggests that [O ii] emitters at are biased tracers of the mass density field.
The HST COSMOS treasury program was supported through NASA grant HST-GO-09822. We greatly acknowledge the contributions of the entire COSMOS collaboration consisting of more than 70 scientists. The COSMOS science meeting in May 2005 was supported by in part by the NSF through grant OISE-0456439. We would also like to thank the Subaru Telescope staff for their invaluable help. This work was financially supported in part by the JSPS (Nos. 15340059 and 17253001). SSS and TN are JSPS fellows.
APPENDIX
In this Appendix, we show optical spectra of the following three [O ii] emitters; ID 948253, ID 1297800, and ID 1690252. The spectra shown in Figure 10 were obtained during the zCOSMOS observing runs with VIMOS on the Very Large Telescope (see for details, Lilly et al. 2006).
References
- (1) Barger, A. J., Cowie, L. L., & Richards, E. A. 2000, AJ, 119, 2092
- (2) Bouwens, R. J., & Illingworth, G. D. 2006, Nature, 443, 189
- (3) Bruzual, G., & Charlot, S. 2003, MNRAS, 344, 1000
- (4) Capak, P., et al. 2007, ApJS, submitted
- (5) Cardelli, J. A., Clayton, G. C., & Mathis, J. S. 1989, ApJ, 345, 245
- (6) Coil, A. L., et al. 2006, ApJ, 644, 671
- (7) Coleman, G. D., Wu, C.-C., & Weedman, D. W. 1980, ApJS, 43, 393
- (8) Connolly, A. J., Szalay, A. S., Dickinson, M., Subbarao, M. U., & Brunner, R. J. 1997, ApJ, 486, L11
- (9) Cowie, L. L., Songaila, A., & Barger, A. J. 1999, AJ, 118, 603
- (10) Cram, L., Hopkins, A., Mobasher, B., & Rowan-Robinson, M. 1998, ApJ, 507, 155
- (11) Dickinson, M., et al. 2004, ApJ, 600, L99
- (12) Ellis, R. S., Colless, M., Broadhurst, T., Heyl, J., & Glazebrook, K. 1996, MNRAS, 271, 781
- (13) Fujita, S. S., et al. 2003a, AJ, 125, 13
- (14) Fujita, S. S., et al. 2003b, ApJ, 586, L115
- (15) Gal, R. R., Lubin, M. L., & Squires, K. G. 2005, AJ, 129, 1827
- (16) Gallego, J., Zamorano, J., Aragón-Salamanca, A., & Rego, M. 1995, ApJ, 455, L1; Erratum 1996, ApJ, 459, L43
- (17) Gallego, J., García-Dabó, C. E., Zamorano, J., Aragón-Salamanca, A., & Rego, M. 2002, ApJ, 570, L1
- (18) Giavalisco, M., et al. 2004, ApJ, 600, L103
- (19) Glazebrook, K., Blake, C., Economou, F., Lilly, S., & Colless, M. 1999, MNRAS, 306, 843
- (20) Hammer, F., et al. 1997, ApJ, 481, 49
- (21) Hippelein, H., Maier, C., Meisenheimer, K., Wolf, C., Fried, J. W., von Kuhlmann, B., Kümmel, M., Phleps, S., & Röser, H.-J. 2003, A&A, 402, 65
- (22) Hogg, D. W., Cohen, J. G., Blandford, R., & Pahre, M. A. 1998, ApJ, 504, 622
- (23) Hopkins, A. M., Connolly, A. J., & Szalay, A. S. 2000, AJ, 120, 2843
- (24) Hopkins, A. M., Connolly, A. J., Haarsma, D. B., & Cram, L. E. 2001, AJ, 122, 288
- (25) Hopkins, A. M. 2004, ApJ, 615, 209
- (26) Iye, M., et al. 2004, PASJ, 56, 381
- (27) Jansen, R. A., Franx, M., & Fabricant, D. 2001, ApJ, 551, 825
- (28) Kaifu, N., et al. 2000, PASJ, 52, 1
- (29) Kashikawa, N., et al. 2004, PASJ, 56, 1011
- (30) Kashikawa, N., et al. 2006, ApJ, 637, 631
- (31) Kennicutt, R. C. 1992b, ApJS, 79, 255
- (32) Kennicutt, R. C. 1998 ARA&A, 36, 189
- (33) Landolt, A. U. 1992, AJ, 104, 340
- (34) Landy, S. D., & Szalay, A. S. 1993, ApJ, 412,64
- (35) Lee, K.-S., et al. 2006, ApJ, 642, 63
- (36) Le Fvre, O., Guzzo, L., Meneux, B., et al. 2005, A&A, 439, 877
- (37) Lilly, S. J., Le Fevre, O., Hammer, F., & Crampton, D. 1996, ApJ, 460, L1
- (38) Lilly, S. J., et al. 2006, submitted to ApJS
- (39) Loveday, J., Tresse, L., & Maddox, S. 1999, MNRAS, 310, 281
- (40) Ly, C., et al. 2006, ApJ, submitted (astro-ph/0610846)
- (41) Madau, P., Ferguson, H. C., Dickinson, M. E., Giavalisco, M., Steidel, C. C., & Fruchter, A. 1996, MNRAS, 283, 1388
- (42) Madau, P., Pozzetti, L., & Dickinson, M. E. 1998, ApJ, 498, 106
- (43) Massarotti, M., Iovino, A., & Buzzoni, A. 2001, ApJ, 559, L105
- (44) Meneux, B., et al. 2006, A&A, 452, 387
- (45) Miyazaki, S., et al. 2002, PASJ, 54, 833
- (46) Mobasher, B., et al. 2006, submitted to ApJS
- (47) Moore, B., Governato, F., Quinn, T., Stadel, J., & Lake, G. 1998, ApJ, 499, L5
- (48) Moorwood, A. F. M., van der Werf, P. P., Cuby, J. G., & Oliva, E. 2000, A&A, 362, 9
- (49) Murayama, T., et al. 2007, ApJS, in press (astro-ph/0702495)
- (50) Nakata, F., et al. 2005, MNRAS, 357,1357
- (51) Norberg, P., et al. 2001, MNRAS, 328, 64
- (52) Norberg, P., et al. 2002, MNRAS, 332, 827
- (53) Ouchi, M., et al. 2005a, ApJ, 620, L1
- (54) Ouchi, M., et al. 2005b, ApJ, 635, L117
- (55) Peebles, P. J. E. 1980, The Large-Scale Structure of the Universe (Princeton: Princeton Univ. Press)
- (56) Pérez-González, P. G., Zamorano, J., Gallego, J., Aragón-Salamanca, A., & Gil de Paz, A. 2003, ApJ, 591, 827
- (57) Pettini, M., et al. 1998, in Cosmic Origins: Evolution of Galaxies, Stars, Planets, and Life, ed. J. M. Shull, C. E. Woodward, & H. A. Thronson (San Francisco: ASP), 67
- (58) Phillipps, S. 2005, The Structure and Evolution of Galaxies (Wiley: John Wiley & Sons, Ltd)
- (59) Pollo, A., et al. 2006, A&A, 451, 409
- (60) Sandage, A., Tammann, G. A., & Yahil, A. 1979, ApJ, 232, 352
- (61) Schechter, P. 1976, ApJ, 203, 297
- (62) Schlegel, D. J., Finkbeiner, D. P., & Davis, M. 1998, ApJ, 500, 525
- (63) Scoville, N. Z., et al. 2007, ApJS, in press (astro-ph/0612305)
- (64) Shimasaku, K., et al. 2003, AJ, 586, L111
- (65) Shioya, Y., et al. 2007, ApJS, submitted
- (66) Steidel, C. C., et al. 1998, ApJ, 492, 428
- (67) Steidel, C. C., Adelberger, K. L., Giavalisco, M., Dickinson, M., & Pettini, M. 1999, ApJ, 519, 1
- (68) Sullivan, M., Treyer, M., Ellis, R. S., Bridges, B., & Donas, J. 2000, MNRAS, 312, 442
- (69) Tanaka, I., et al. 2001, ApJ, 547, 521
- (70) Taniguchi, Y., et al. 2005, PASJ, 57, 165
- (71) Taniguchi, Y., et al. 2007, ApJS, in press (astro-ph/0612295)
- (72) Teplitz, H. I., Collins, N. R., Gardner, J. P., Hill, R. S., & Rhodes, J. 2003, ApJ, 589, 704
- (73) Tresse, L., & Maddox, S. 1998, ApJ, 495, 691
- (74) Tresse, L., Maddox, S., Loveday, J., & Singleton, C. 1999, MNRAS, 310, 262
- (75) Tresse, L., Maddox, S., Le Fèver, O., & Cuby, J.-G. 2002, MNRAS, 337, 369
- (76) Treyer, M. A., Ellis, R. S., Milliard, B., Donas, J., & Bridges, T. J. 1998, MNRAS, 300, 303
- (77) Wilson, G., Cowie, L. L., Barger, A., & Burke, D. J. 2002, AJ, 124, 1258
- (78) Yan, L., et al. 1999, ApJ, 519, L47
- (79) Zehavi, I., et al. 2004, ApJ, 608, 16
- (80) Zehavi, I., et al. 2005, ApJ, 630, 1
| Field | Covered sky area | Survey volume | limiting | magnitude | ||||||
|---|---|---|---|---|---|---|---|---|---|---|
| (arcmin2) | (Mpc3) | ††footnotemark: | ††footnotemark: | ††footnotemark: | ††footnotemark: | ††footnotemark: | ††footnotemark: | NB816††footnotemark: | ||
| COSMOS | 6700 | 55.6 | 27.4 | 26.5 | 26.6 | - | 26.1 | 25.4 | 25.6 | |
| SDF | 875 | 7.27 | 27.6 | 27.0 | - | 27.2 | 27.0 | 26.2 | 26.1 |
| Line | Redshift range | aaMean redshift. | bbLuminosity distance. |
|---|---|---|---|
| (Mpc) | |||
| 0.233 0.251 | 0.242 | 1220 | |
| [O iii]4959,5007 | 0.616 0.656 | 0.636 | 3800 |
| 0.664 0.689 | 0.677 | 4100 | |
| [O ii] | 1.171 1.203 | 1.187 | 8190 |
| No. | ID | RA(J2000) | DEC(J2000) | aa3′′ aperture magnitude. | bbPhotometric error. | aa3′′ aperture magnitude. | bbPhotometric error. | aa3′′ aperture magnitude. | bbPhotometric error. | ccLine flux. | ddExtinction corrected [O ii] luminosity. | |
|---|---|---|---|---|---|---|---|---|---|---|---|---|
| (deg) | (deg) | (mag) | (mag) | (mag) | (mag) | (mag) | (mag) | (mag) | (ergs s-1 cm-2) | (ergs s | ||
| 1 | 27025 | 150.77573 | 1.622925 | 23.80 | 0.04 | 23.11 | 0.03 | 23.43 | 0.05 | 23.63 | -16.33 | 42.41 |
| 2 | 27180 | 150.74086 | 1.622155 | 24.44 | 0.06 | 24.00 | 0.07 | 24.32 | 0.10 | 24.39 | -16.80 | 41.94 |
| 3 | 28182 | 150.75733 | 1.615727 | 24.10 | 0.05 | 23.63 | 0.05 | 23.66 | 0.06 | 23.89 | -16.75 | 41.99 |
| 4 | 32985 | 150.78337 | 1.592096 | 24.58 | 0.07 | 23.94 | 0.07 | 24.20 | 0.10 | 24.40 | -16.70 | 42.04 |
| 5 | 33031 | 150.76678 | 1.591625 | 24.10 | 0.05 | 23.46 | 0.04 | 23.80 | 0.07 | 23.96 | -16.49 | 42.25 |
The complete version of this table is in the electronic edition of the Journal. The printed edition contains only a sample.
| No. | ID | RA(J2000) | DEC(J2000) | aa3′′ aperture magnitude. | bbPhotometric error. | aa3′′ aperture magnitude. | bbPhotometric error. | aa3′′ aperture magnitude. | bbPhotometric error. | ccLine flux. | ddExtinction corrected [O ii] luminosity. | |
|---|---|---|---|---|---|---|---|---|---|---|---|---|
| (deg) | (deg) | (mag) | (mag) | (mag) | (mag) | (mag) | (mag) | (mag) | (ergs s-1 cm-2) | (ergs s | ||
| 1 | 10459 | 201.35980 | 27.211346 | 24.20 | 0.01 | 23.69 | 0.01 | 23.77 | 0.01 | 24.00 | -16.73 | 42.01 |
| 2 | 10789 | 201.24632 | 27.210946 | 24.28 | 0.01 | 23.64 | 0.01 | 23.61 | 0.01 | 23.94 | -16.69 | 42.05 |
| 3 | 10960 | 201.19371 | 27.210909 | 24.13 | 0.01 | 23.51 | 0.01 | 23.57 | 0.01 | 23.85 | -16.60 | 42.13 |
| 4 | 11651 | 201.15106 | 27.212800 | 24.85 | 0.01 | 24.25 | 0.02 | 24.38 | 0.02 | 24.62 | -16.88 | 41.85 |
| 5 | 11959 | 201.25951 | 27.213563 | 24.30 | 0.01 | 23.73 | 0.01 | 23.58 | 0.01 | 23.93 | -16.84 | 41.89 |
The complete version of this table is in the electronic edition of the Journal. The printed edition contains only a sample.
| COSMOS | SDF | ||||||||||
|---|---|---|---|---|---|---|---|---|---|---|---|
| Observed luminosity function | Corrected luminosity function | Observed luminosity function | Corrected luminosity function | ||||||||
| Number of | Number of | Number of | Number of | ||||||||
| (ergs s | ( Mpc-3) | galaxies | ( Mpc-3) | galaxies | ( Mpc-3) | galaxies | ( Mpc-3) | galaxies | |||
| 40.75 | -3.86 | 2 | |||||||||
| 40.95 | -3.61 | 27 | -2.62 | 35 | |||||||
| 41.15 | -2.37 | 470 | -2.22 | 87 | |||||||
| 41.35 | -2.01 | 1080 | -2.23 | 86 | |||||||
| 41.45 | -4.16 | 1 | |||||||||
| 41.55 | -2.14 | 810 | -2.52 | 44 | |||||||
| 41.65 | -2.91 | 18 | |||||||||
| 41.75 | -2.37 | 474 | -3.24 | 64 | -2.80 | 23 | |||||
| 41.85 | -2.22 | 88 | |||||||||
| 41.95 | -2.72 | 212 | -2.19 | 712 | -3.08 | 12 | |||||
| 42.05 | -2.24 | 83 | |||||||||
| 42.15 | -3.20 | 70 | -2.03 | 1048 | -3.56 | 4 | |||||
| 42.25 | -2.42 | 55 | |||||||||
| 42.35 | -3.55 | 31 | -2.19 | 723 | -4.16 | 1 | |||||
| 42.45 | -2.75 | 26 | |||||||||
| 42.55 | -4.75 | 2 | -2.45 | 399 | |||||||
| 42.65 | -2.96 | 16 | |||||||||
| 42.75 | -2.86 | 154 | |||||||||
| 42.85 | -3.38 | 6 | |||||||||
| 42.95 | -3.28 | 58 | |||||||||
| 43.05 | -4.16 | 1 | |||||||||
| 43.15 | -3.84 | 16 | |||||||||
| 43.35 | -4.75 | 2 | |||||||||
| (degree) | All | ||
|---|---|---|---|
| 0.0011 | 8.6520.255 | 9.7550.571 | 14.9840.730 |
| 0.0018 | 3.0350.162 | 2.3780.368 | 5.0970.459 |
| 0.0028 | 1.1380.102 | 0.9370.229 | 1.7620.289 |
| 0.0044 | 0.6050.064 | 0.7260.146 | 1.3090.183 |
| 0.0070 | 0.3350.041 | 0.4300.092 | 0.5020.117 |
The complete version of this table is in the electronic edition of the Journal. The printed edition contains only a sample.