11email: gcastell@iafe.uba.ar 22institutetext: National Radio Astronomy Observatory, 520 Edgemont Road, Charlottesville, VA 22903 33institutetext: Remote Sensing Division, Code 7213, Naval Research Laboratory, 4555 Overlook Avenue, SW, Washington DC
The low frequency radio emission and spectrum of the extended SNR
W44:
new VLA observations at 74 and 324 MHz
Abstract
Aims. We present new Very Large Array (VLA) radio images at 74 and 324 MHz of the SNR W44. The VLA images, obtained with unprecedented angular resolution and sensitivity for such low frequencies have been used in combination with existing 1442 MHz radio data, Spitzer IR data, and ROSAT and Chandra X-ray data to investigate morphological and spectral continuum properties of this SNR.
Methods. The observations were carried out with the VLA simultaneously at 74 and 324 MHz in the A and B configurations and at 324 MHz in the C and D configurations. The radio continuum spectral index distribution was derived through direct comparison of the combined data at 74, 324, and 1442 MHz. In addition, to isolate and identify different spectral components, tomographic spectral analysis was performed.
Results. The spatially resolved spectral index study revealed that the bright filaments, both around and across the SNR, have a straight spectrum between 74 and 1442 MHz, with , with two clear exceptions: a short portion of the SNR limb to the southeast, with varying between 0 and +0.4 and a bright arc to the west where the spectrum breaks around 300 MHz and becomes concave down. We conclude that at the shell and along the internal filaments, the electrons responsible for the synchrotron emission were accelerated at the shock according to a simple diffusive shock model. The positive spectrum corresponds to a location where the SN shock is running into a molecular cloud and the line of sight intersects the photo dissociation region of an HII region and a young stellar object is present. Such spectral inversion is a classic signature of thermal absorption, either from ionized gas in the postshock region, from the HII region itself, or both. The curved spectrum on the westernmost bright arc is explained as the consequence of strong post-shock densities and enhanced magnetic fields after the interaction of the SN shock with a coincident molecular cloud. The comparison of the 324 MHz image with a 4.5 m IR image obtained with Spitzer underscored an impressive correspondence between emission both to the north and west sides of W44, while the comparison with ROSAT and Chandra images confirm that the synchrotron radio emission surrounds the thermal X-ray radiation.
Key Words.:
ISM: individual objects: W44-ISM: supernova remnants-radio continuum: ISM1 Introduction
The interaction of supernova remnant (SNR) shocks with inhomogeneous interstellar gas strongly affects the spatial and temporal evolution of SNRs. The density distribution of the ambient circumstellar material (CSM) and interstellar medium (ISM) can influence the formation of a variety of SNR morphologies, including specific sub-classes of SNRs such as “thermal-X-ray composites” (also called mixed-morphology SNRs, Rho & Petre 1998), or remnants with bilateral symmetry (Gaensler 1998). In this respect, sensitive high-resolution radio observations of SNRs are particularly useful for studying the physics of shock waves traveling through nonuniform environments in the ISM.
On the other hand, continuum radio spectra made accurate by extension to long wavelengths provide sensitive and often unique means of distinguishing between different physical processes taking place either within SNRs (e.g. shock acceleration), in their immediate surrounding, or in the ISM along the line of sight (e.g. thermal absorption, Lacey et al. 2001; Brogan et al. 2005). Based on accurate spectral continuum index studies it is possible to constrain shock acceleration theories that predict subtle variations in both spatially resolved (Anderson & Rudnick 1993) and integrated spectra (Reynolds & Ellison 1992). In addition, the information provided by low frequency observations of SNRs is a powerful complement to higher frequency radio, X-ray, and infrared (IR) data to study the complex processes associated with SNR shocks (Brogan et al. 2005).
W44 (G34.7$-$0.4) is a bright radio SNR (230 Jy) with an asymmetric morphology, about 05 in size, and located in a complex region of the inner Galactic plane rich in both thermal and nonthermal sources. W44 is an archetype of the “mixed-morphology” class of remnants, characterized by a highly filamentary radio shell and centrally concentrated thermal X-ray emission. Morphological studies of this remnant in the optical band reveal Balmer-dominated, [NII], and [SII] filaments from radiative shocks, with some concordance with the radio emission (Rho et al. 1994; Giacani et al. 1997).
This SNR is also of interest because it constitutes one of the few demonstrated cases of a SNR-molecular cloud interacting system. Seta et al. (1998) observed six giant molecular clouds that appear to be partially surrounding the remnant. Higher spatial resolution 12CO observations of the full extent of W44 presented by Seta et al. (2004) revealed that some of these clouds (at vLSR48 km s-1) are physically interacting with the remnant on its southeastern and western sides. These observations also show that the shocked molecular gas is confined to compact (1.5 pc) cores located adjacent to bright radio filaments or knots. The physical interaction of the blast wave with the clumpy ISM is also supported by the detection of bright OH (1720 MHz) masers (at LSR velocities between 43 and 47 km s-1, Hoffman et al. 2005, and references therein), and IR cooling lines from H2 (Reach et al. 2006).
The associated pulsar PSR~B1853+01 is located inside the W44 shell, about 9′ south of the geometric center of the remnant. A characteristic age of about 2 104 years has been estimated for this pulsar (Wolszczan et al. 1991). Frail et al. (1996) and Petre et al. (2002) report the detection of a radio and X-ray nebula powered by an associated pulsar wind.
It has also been proposed that the EGRET source 3EG 1856+0114 is associated with W44 (Esposito et al. 1996). The 95% confidence contour for this -ray source coincides with the southeastern sector of the remnant (Thompson et al. 1996). de Jager & Mastichiadis (1997) explained the observed GeV -rays in terms of relativistic bremsstrahlung and inverse Compton scattering produced by a power-law distribution of relativistic electrons injected by the pulsar PSR~B1853+01. While this constitutes a possible explanation, a significant part of the -ray flux observed may also be due to SNR shock-cloud interactions (Fatuzzo & Melia 2005). No -ray radiation at TeV energies was detected towards W44 using either the Whipple (Leslard 1995) or CANGAROO (Buckley et al. 1998) telescopes, suggesting a spectral cutoff between GeV and TeV energies (Rowell et al. 2000).
A distance of about 3 kpc was first suggested for W44 by Radhakrishnan et al. (1972) and Caswell et al. (1975) based on H i absorption measurements. From the afore mentioned molecular studies revealing associated gas with LSR velocities between approximately 43 and 48 km s-1 and using a flat rotation curve with the solar constants of R0=7.6 kpc (Eisenhauer et al. 2005) and 0=27.2 km s-1 kpc-1 (Feast & Whitelock 1997), a kinematical distance of 2.9 0.2 kpc can be derived for W44. Thus W44 is probably an object of the Sagittarius arm consistent with it being a core-collapse SNe from a massive progenitor star.
In this paper we present the highest resolution and sensitivity images of the SNR W44 yet obtained at low radio frequencies. These images were generated from multiple-configuration Very Large Array (VLA)111The Very Large Array of the National Radio Astronomy Observatory is a facility of the National Science Foundation operated under cooperative agreement by Associated Universities, Inc. observations at 74 and 324 MHz carried out in 2002 and 2003. Based on the comparison of the new images with existing VLA data at 1442 MHz, we have performed the first detailed study of the radio continuum spectral properties of W44, searching for changes in spectral index as a function of frequency and position. In addition, special attention was paid to the comparison between our high resolution radio images and the best existing infrared data from Spitzer and in X-rays from ROSAT and Chandra.
2 Observations and Data reduction
We have performed low frequency observations of the SNR W44 at 74 and 324 MHz using multiple-configurations of the VLA. Table LABEL:observations summarizes various observing details. Data at both frequencies were obtained in spectral-line mode to enable radio-frequency interference (RFI) excision and to mitigate bandwidth smearing. The observations at 74 MHz and 324 MHz were performed with 64 and 32 channels, respectively. A model image of Cygnus A was used to correct the bandpass222See http://lwa.nrl.navy.mil/tutorial/ to obtain source models in FITS format.. The absolute amplitude scale were set using Cygnus A at 74 MHz and 3C~48 at 324 MHz. Also, for the 324 MHz data, regular observations of the secondary calibrator 1822$-$096 were used for initial phase and amplitude calibration. At both frequencies, the data from each array were fully reduced and imaged separately using the NRAO Astronomical Image Processing Software (AIPS) package. After initial calibration the data at 74 and 324 MHz were averaged down to fourteen and eight channel spectral resolution data cubes, respectively, before imaging.
Two additional difficulties associated with low frequency radio observations are the wide-field imaging requirement imposed by the large field of view (the primary beam of the 324 and 74 MHz data are 25 and 115, respectively), and ionospheric-based phase variations that decorrelate phases on longer baselines, especially at 74 MHz (Kassim et al. 1993). We therefore employed wide-field imaging as implemented in the AIPS task IMAGR, based on a pseudo-three-dimensional multifacet algorithm to deal with the non-coplanarity of the visibilities (Cornwell & Perley 1992). Secondly, to remove ionospheric-induced phase distortions we employed several loops of self-calibration to the data from each configuration separately at 74 and 324 MHz (Cornwell & Fomalont 1999). We note that angle-invariant self-calibration (as currently implimented in AIPS) is not sufficient to correctly compensating for ionospheric effects across the full field of view, especially at 74 MHz (Cotton et al. 2004). However, self-calibration is adequate in the special case where the target source is located at the phase center and is the brightest source in the field, as is this case with W44.
The final calibrated 324 MHz visibility data from the A, B, C, and D configurations were combined into a single uv data set and imaged using a multi-scale CLEAN algorithm with four different scale sizes. For the final image, all facets were reassembled into one large field with the task FLATN within AIPS, resulting in a single image with an angular resolution of , PA=, and an rms noise of 5 mJy beam-1.
Data reduction and imaging at 74 MHz were performed following the procedures outlined above333see at http://lwa.nrl.navy.mil/tutorial/ for a full description on 74 MHz VLA data reduction.. For the A and B configuration 74 MHz data, an initial phase-only self-calibration was conducted using the B-configuration 324 MHz image as the starting model. The A and B configuration 74 MHz data sets were then phase-only self-calibrated; the B configuration data also required a final amplitude self-calibration. The individually calibrated A and B data sets were then concatenated, and followed by several more rounds of self-calibration. The final image has a synthesized beam of , PA= and an rms noise of 65 mJy beam-1.
A concern with self-calibrated images is that they can lose absolute position information subject to the arbitrary position of the starting model, which in this case may also be subject to ionospheric refraction. In order to check the astrometry in our 74 and 324 MHz images, we compared the position of several small-diameter sources detected in these images with their positions from the NRAO VLA Sky Survey (NVSS). This catalog has an astrometric accuracy better than 1′′ in both RA and Dec for bright sources (Condon et al. 1998). We found and corrected for an average ionospheric induced refraction of 0.63s 0.12s in RA and in Dec at 74 MHz and 0.14s 0.05s in RA and in Dec at 324 MHz.
A high resolution VLA image of W44 at 1442 MHz was produced from interferometric data taken in 1984 and 1985 (Jones et al. 1993) plus short spacing information from the Bonn 100 m 1408 MHz Survey (Reich et al. 1990). This 1442 MHz image recovers a total flux density of S=300 7 Jy and has a resolution and rms noise of 23′′ 19′′ and 4 mJy beam-1, respectively.
To study the spectral properties of W44 (§4), special care was taken to match the uv coverage for the 74, 324, and 1442 MHz VLA data. This was achieved by applying specific weighting schemes to the 324 MHz data in order to provide the same resolution as the 74 and 1442 MHz images, respectively. Similarly, we re-imaged the 1442 MHz data so that they matched the 74 MHz observations. Primary beam corrections were applied to the new 74 and 324 MHz images before estimating flux densities.
| Observing | VLA | Bandwidth | Integration |
|---|---|---|---|
| dates | Config. | (MHz) | time (hr) |
| 74 MHz Parameters | |||
| 2003 Aug 31 | A | 1.562 | 7.5 |
| 2003 Sep 1 | A | 1.562 | 2.6 |
| 2002 Jun 15 | B | 1.562 | 6.0 |
| 324 MHz Parameters | |||
| 2003 Aug 31 | A | 3.125 | 7.5 |
| 2003 Sep 1 | A | 3.125 | 2.6 |
| 2002 Jun 15 | B | 3.125 | 6.0 |
| 2002 Dec 14 | C | 3.125 | 4.0 |
| 2003 Mar 16 | D | 3.125 | 6.0 |
3 Results
3.1 VLA low frequency images of W44
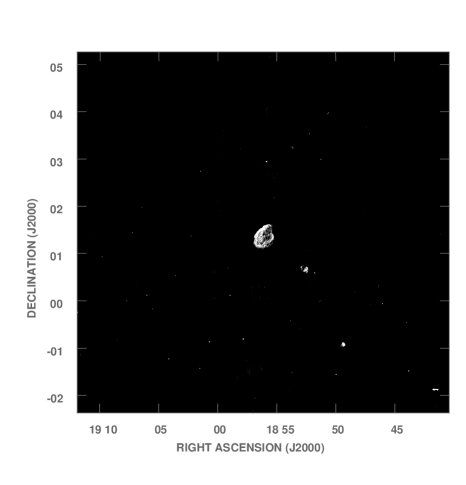
Figure 1 shows our resolution VLA 74 MHz image of a portion (7.5 square degrees) of the large field of view centered on the SNR W44. Note that while sources are detected across the full field-of-view, only those located near the field center are correctly imaged by the angle-invariant self-calibration technique implimented here. A close-up view of the radio emission at 74 MHz from W44 is shown in Fig. 2. This is the first sub-arcminute resolution image of this source ever obtained below 100 MHz. Though it is not sensitive to structures larger than , it is sufficient to recover all information for this source about 30′ in size. Moreover, the fact that no negative bowl is apparent around the SNR at this frequency confirms that most of the large-scale structure is recovered. However, since W44 is almost at the limit of the largest imaged structures, some flux might still be missing from the 74 MHz image.
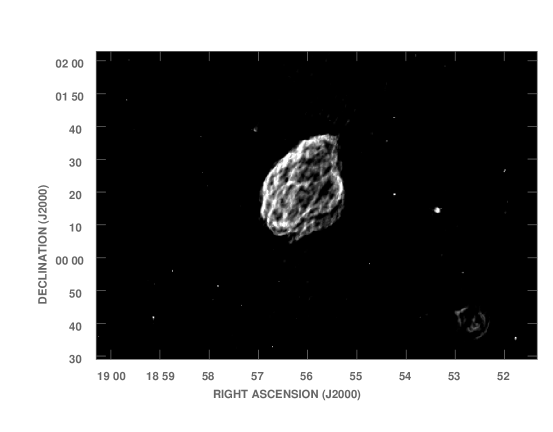
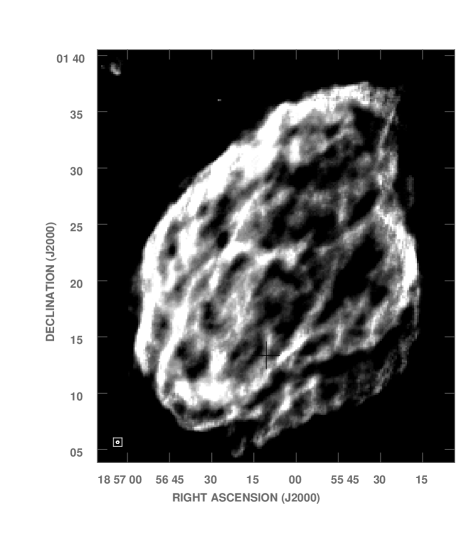
In Fig. 3 we present the new VLA image of W44 at 324 MHz with a resolution of over a field of view of square degrees. A close-up view showing the detailed radio morphology of W44 at 324 MHz is shown in Fig. 4. The present image has a beam size 300 times better and is 80 times more sensitive than any previously published 330 MHz image of W44 (Kassim 1992). The combination of all four VLA array configurations is sensitive to structures between 13 and 1∘ in size, ensuring complete sampling of all the spatial scales of the W44 emission. The high dynamic range achieved in these new observations has served to reveal new details previously unnoticed in W44, especially extreme filamentary and clumpy emission that is immersed in more tenuous diffuse emission.
At low radio frequencies the remnant has the appearance of a noncircular shell elongated in the southeast-northwest direction, with an average diameter of 30′ (or 25 pc at the distance of 2.9 kpc adopted in this paper). The brightest emission occurs along the eastern boundary, a region where previous observations have indicated the presence of molecular clouds probably interacting with W44. In the 324 MHz image (Fig. 4) it is apparent that the east limb is not sharp. On the contrary, faint emission is clearly detected at a 5 level extending about 1′ beyond the bright rim. A similar weak radio halo was observed along the eastern side of the SNR Puppis~A (Castelletti et al. 2006), a direction where Puppis~A is encountering a molecular cloud as is the case for W44. To the west, the most outstanding feature is the short bright arc located near , (J2000). The rest of the boundary is more diffuse in appearance.
Based on the new radio observations we have estimated integrated flux densities of 634 70 Jy at 74 MHz and 411 50 Jy at 324 MHz for W44, where the attenuation of the primary beam has been corrected for these estimates. The quoted errors take into account the statistical errors as well as uncertainties in the true extension of the SNR.
In the new sensitive 324 MHz image, the low frequency counterpart of the pulsar wind nebula (PWN) around PSR~B1853+01 discovered at higher radio frequencies and in X-rays (Frail et al. 1996; Petre et al. 2002), is clearly detected (small white cometary feature extending to the north of the pulsar position indicated by the plus sign in Fig. 4). An enlargement of the emission at 324 MHz associated with this PWN is shown in Fig. 5. Similar to the 1.4 GHz image shown by Frail et al. (1996), at 324 MHz the pulsar is located at the apex of an elongated structure in extent. The two maxima observed inside the PWN, where the intensity peaks up to 56 mJy beam-1, were previously reported by Jones et al. (1993) as discrete sources. The integrated flux density of the PWN at 324 MHz is Jy. Because of the relatively lower sensitivity and angular resolution, combined with the typically flat radio spectra of all PWN, the W44 PWN is not apparent in the 74 MHz image.
4 The radio spectral index behavior
4.1 Integrated radio spectrum
We have used the new estimated total flux densities at 74 and 324 MHz together with data from the literature to determine the mean spectral index of W44. To construct accurate spectra of individual SNRs it is necessary that all flux densities be tied to the same absolute flux density scale. In Table 2 we list all integrated flux density estimates for W44 between 22 and 10700 MHz. Most of the measurements over the frequency range between 408 and 10700 MHz were extrapolated to the Baars et al. (1977) absolute flux scale for consistency. In some cases an estimate of the correction factor was not available because the original reference did not list the assumed flux densities of the primary calibrators. Below 408 MHz ( 2.6), where the systematic error of the Baars et al. scale is more than 5%, no scaling was applied. These last values have been nevertheless used for the spectral fitting since they do not show a large spread.
In Fig. 6 we show a plot of the spectrum for W44 in which our new flux density determinations at 74 and 324 MHz are indicated by filled circles. A single power law slope =0.37 0.02 (S) adequately fits the flux densities measured over four decades in frequency without any obvious break. This integrated spectral index is quite flat for a typical shell type SNR, and agrees well with earlier estimates presented by Kassim (1989a, b, 1992) who derived a spectral index between 0.4 0.3. This result confirms Kassim (1989a)’s contention that the integrated spectrum of W44 remains a power law to well below 100 MHz. This behavior is in contrast to a number of other SNRs that exhibit a spectral turnover due to free-free absorption (e.g. W49B and 3C391, Lacey et al. 2001; Brogan et al. 2005). The fact that the new 74 MHz integrated flux falls nicely on the power law confirms that our 74 MHz image is missing little, if any emission on the largest spatial scales.

| Frequency | Scaled flux | References | Frequency | Scaled flux | References |
|---|---|---|---|---|---|
| (MHz) | density (Jy) | (MHz) | density (Jy) | ||
| 22 | 881108(a) | Roger et al. (1986) | 750 | 270 27 | Pauliny-Toth et al. (1966) |
| 30.9 | 849 170(a) | Kassim (1989b) | 960 | 208 8 | Harris (1962) |
| 38 | 766 230(a) | Kassim (1989b) | 960 | 230 16(c) | Kuz’min (1962) |
| 74 | 634 70(b) | This work | 960 | 266 40 | Wilson (1963) |
| 83 | 500 27(a) | Kovalenko et al. (1994) | 1390 | 173 35 | Westerhout (1958) |
| 85 | 436 131(a) | Mills et al. (1958) | 1400 | 188 23 | Pauliny-Toth et al. (1966) |
| 102 | 434 70(a) | Kovalenko et al. (1994) | 1400 | 173 26 | Kellermann et al. (1969) |
| 111 | 500 70(a) | Kovalenko et al. (1994) | 1410 | 236 47 | Scheuer (1963) |
| 159 | 680 122(a) | Edge et al. (1958) | 1410 | 236 35 | Beard & Kerr (1969) |
| 178 | 432 130(a) | Bennett (1963) | 1414 | 274.7 0. 4 | Altenhoff et al. (1970) |
| 178 | 400 80(a) | Bennett (1963) | 1420 | 180 36(c) | Leslie (1960) |
| 178 | 378 113(a) | Kellermann et al. (1969) | 1442 | 210 20 | Giacani et al. (1997) |
| 178 | 378 113(a) | Holden & Caswell (1969) | 1442 | 300 7 | This work |
| 195 | 398 119(a) | Kundu & Velusamy (1967) | 2650 | 167 17 | Beard & Kerr (1969) |
| 324 | 411 50(b) | This work | 2695 | 170.3 0.4 | Altenhoff et al. (1970) |
| 330 | 469 94(a) | Kassim (1992) | 2700 | 107 10 | Altenhoff et al. (1970) |
| 330 | 400 40(a) | Giacani et al. (1997) | 2700 | 169 18 | Willis (1973) |
| 400 | 360 72(a) | Davis et al. (1965) | 2700 | 179 10 | Velusamy & Kundu (1974) |
| 408 | 291 58 | Large et al. (1961) | 2700 | 124 19 | Milne & Dickel (1974) |
| 408 | 440 88 | Kesteven (1968) | 3000 | 146 29 | Scheuer (1963) |
| 408 | 290 58 | Clark et al. (1975) | 3125 | 135 14 | Kuz’min et al. (1960) |
| 430 | 291 59 | Kundu & Velusamy (1967) | 4875 | 123 12 | Downes et al. (1980) |
| 430 | 567 178 | Dickel & Denoyer (1975) | 5000 | 127 15 | Kundu & Velusamy (1969) |
| 513 | 297 30(c) | Kuz’min (1962) | 5000 | 155 23 | Milne (1969) |
| 610 | 314 32 | Moran (1965) | 5000 | 126.7 0.4 | Altenhoff et al. (1970) |
| 740 | 249 15(c) | Kuz’min (1962) | 8350 | 95 23(c) | Hollinger & Hobbs (1966) |
| 750 | 242 24 | Kellermann et al. (1969) | 10700 | 104 7 | Kundu & Velusamy (1972) |
-
(a)
No correction to Baars et al. (1977) scale was applied.
-
(b)
Flux density scale from VLA Calibrator Manual, http:/www.aoc.nrao.edu/gtaylor/calib.html.
-
(c)
The correction factor was not available.
4.2 Local variations in the radio spectral index
We aim to discern whether the spectrum is a global property of this SNR, or if it is locally affected by the shock-ISM interaction and/or the presence of the pulsar in its interior. To investigate this, we performed a detailed study of the variations in the spectrum as a function of frequency and position within the remnant. For this analysis we have used the new high resolution images at 74 and 324 MHz together with the reprocessed VLA data at 1442 MHz.
To accurately determine the spectral index distribution based on interferometric radio images, identical beam size and shape at the different pairs of frequencies is required. As mentioned in §2, we applied appropriate uv-tapering, in order to match the range of spatial scales measured at each frequency. In addition, to avoid any positional offsets, the images were aligned and interpolated to identical projections (field center, pixel separation, etc). The final common resolution is 40′′ 36′′, PA=62∘ for the 74/324 MHz comparison and 14, PA=45∘ for the 324/1442 MHz pair.
The spectral study was carried out by direct comparison of the matched images at the three frequencies and by constructing tomographic images. The different procedures ensure that the observed spectral features are robust, and unaffected by any artifacts or biases in the databases used for the comparison, like zero level differences, smooth background variation, etc.
In spite of the relatively good fidelity attained in the new images, some residual small-scale fluctuations, probably not real, were apparent at the highest spatial resolution traced in the spectral index maps. We therefore preferred to further smooth all three frequency maps to a 50 resolution, thus avoiding any small scale variation that could mask the main spectral features. We based our analysis on spectral comparisons derived from these smoothed databases.
4.2.1 Spectral index maps
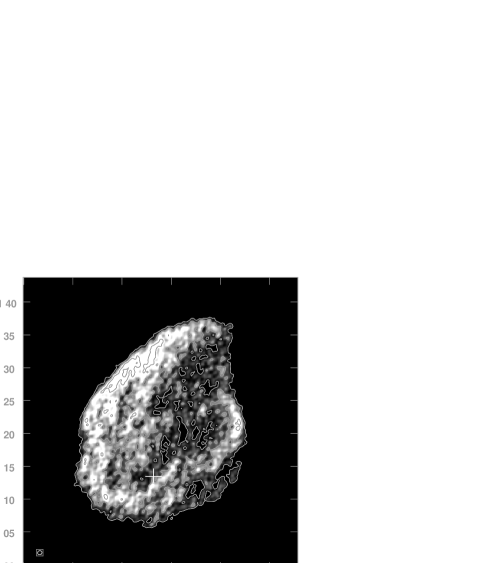
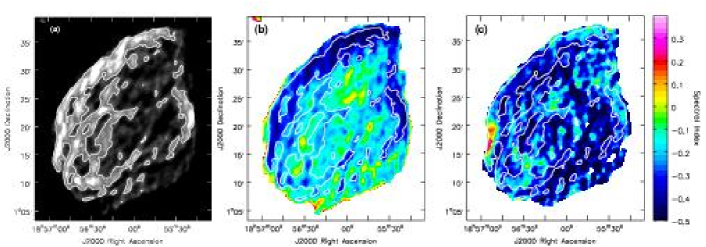
Figure 7a shows a 324 MHz continuum image of the SNR W44 smoothed to 25 resolution for comparison, while Fig. 7b and Fig. 7c display the spatial spectral index distribution in the remnant obtained from the direct ratio of the matched 324/1442 MHz and 74/324 MHz data, at the angular resolution of 50. To construct these spectral index maps the images were clipped at the 4 level of their respective noise levels. Since, as noted in §4.1, the global spectrum of W44 remains a power law to well below 100 MHz, we use the same scale in Fig. 7 for both frequency pairs in order to easily identify continuum spectral changes that depend on both position and frequency (spectral curvature).
In Fig. 7b it is readily apparent that the brightest radio emission all along the periphery of W44 has a spectral index 0.4, 0.5, compatible with a first-order Fermi mechanism operating at the shock. In addition, the bright filaments observed across the SNR have a similar , in contrast with the slightly flatter diffuse interior.
In the spectral index map traced between 74 and 324 MHz (Fig. 7c) the most striking feature is the short band seen on the southeastern limb (near , ), where the spectral index becomes positive, with varying between 0 and +0.4. This spectral inversion occurs at a site where previous studies have demonstrated that the SNR is physically interacting with a dense molecular cloud (Seta et al. 2004; Reach et al. 2005). Also, as shown below (§5.1) from 24 m and 8 m Spitzer observations, this is the location of an HII region (named G034.7-00.6 in the HII regions catalog by Paladini et al. 2003, centered at 18h 56m 47.9s, 01∘ 17 54 J2000) with the IRAS point source 18544+0112 (identified as a young stellar object) located on its border. Thus, the spectral inversion can be interpreted as originating from low frequency free-free absorption at the SNR/molecular cloud shock boundary. Absorbing ionized gas could have been created by the passage of a fast, ionizing J-type shock that passed through the molecular cloud and dissociated and ionized the gas. A similar spectral inversion was observed by Brogan et al. (2005) in the SNR 3C~391, where a spectral turnover for frequencies below 100 MHz was found at the positions where the SN shock was running into dense molecular gas. An alternative explanation is that thermal absorption is occuring inside the boundaries of the coincident HII region, along its periphery where the thermal electron density might be highest. We note that this localized absorption has a negligible influence on the total integrated flux and thus has no measurable impact on the integrated continuum spectrum.
From the comparison between Fig. 7b (324/1442 MHz) and Fig. 7c (74/324 MHz) one could have the misleading impression that the spectral behavior is reversed from one frequency range to the other. In fact the spectral index of the limb and bright filaments is the same (near 0.4 to 0.5) in both frequency pairs, and it is the diffuse interior that changes to a steeper value in the 74/324 MHz comparison. This effect, however, needs to be confirmed on the basis of more sensitive 74 MHz data before advancing an interpretation.
What is readily apparent from the comparison of Fig. 7b and Fig. 7c is that the westernmost arc changes its spectrum from 0.4 to a flatter value 0.2. This feature is also located at a site where the SN shock is probably running into a dense molecular cloud, where the intense near infrared emission (see §5.1) and the bright optical filaments observed in the [SII] and [NII] lines (Mavromatakis et al. 2003) suggest the presence of radiative shocks. In this case, it is possible that the observed change in the radio continuum spectrum is due to absorption by a layer of thermal electrons associated with the sheets responsible for the filaments.
4.2.2 Tomographic images
To investigate the fidelity of our radio continuum spectral index maps, we also produced a tomographic gallery (see for example Katz-Stone & Rudnick 1997). A tomographic map between two images at different frequencies is made by using a test spectral index to scale the brightness in the higher frequency image (), and then subtracting this scaled image from the lower frequency image (). Thus, a tomographic gallery is obtained by calculating , stepping through a range of test spectral indices . Features which have a spectral index identical to the test value will disappear in the St image. Spatial components that have different spectral indices will appear as positive or negative residuals depending upon whether the spectrum is steeper or flatter than the assumed value. Such a procedure allows us to trace fine-scale spectral index changes, and is particularly useful for disentangling the superposition of components with different spectra that can overlap along the line of sight.
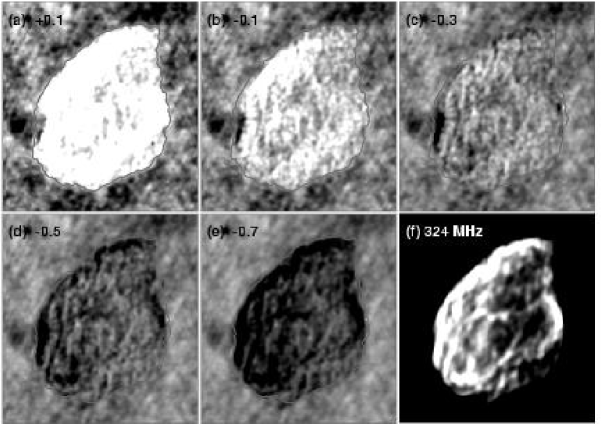
In Fig. 8 we present a tomographic gallery of 324 vs. 1442 MHz data, while the comparison between 74 and 324 MHz data is shown in Fig. 9. In both cases the tomographic images were generated for five test spectral index values: =+0.1, =0.1, =0.3, =0.5, and =0.7. In these maps the positive spatial components (seen as light regions) are steeper in spectral index than the assumed test value, while the negative (dark) residuals correspond to features having a spectrum flatter than the test value. In both figures, the bottom right frame displays the 324 MHz continuum image for comparison.
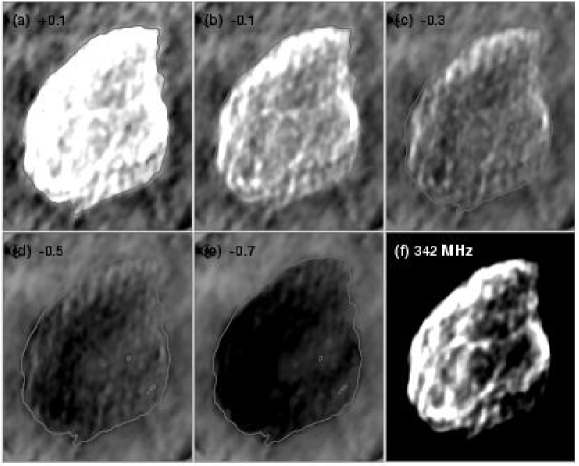
In the 74/324 MHz comparison (Fig. 9), the feature with positive spectrum noted earlier near , is strikingly revealed as a short, dark filament in the eastern border of all the tomographic images. It is especially evident in panels from =0.1 to =0.3 as a structure with flatter spectrum than these values. Also, the tomographies traced between 74 and 324 MHz emphasize the westernmost arc, that stands out as a flatter spectral index feature in the images traced at =0.5 and =0.7 and disappears against the background at =0.3, while for the tomographies traced between 324 and 1442 MHz (Fig. 8) the best fit is attained for between 0.5 and 0.7, thus confirming the negative (concave down) curvature of the spectrum recognized earlier.
In summary, all of the important radio continuum spectral index characteristics discussed in the previous section are confirmed through this alternative analysis.
An important conclusion from this new radio continuum spectral study is that neither spectral index maps nor tomographies reveal any trace of coupling between the pulsar and the surrounding plasma beyond the PWN; that is, there is no spectral signature, such as a smooth radial steepening, that would suggest a progressive aging of particles from their injection near the pulsar to their transport further out into the SNR shell. Moreover, the spectral index obtained for the shell (0.5), compatible with the diffusive shock acceleration mechanism in the test particle limit, confirms that the relativistic electrons responsible for the shell radio emission are accelerated right at the shock front, with no influence from the central neutron star. Also, no spectral signature is observed that can be related to the presence of the 95% confidence ellipse corresponding to the EGRET -ray source that covers most of the southeast corner of W44.
5 Multi-wavelength Comparisons
5.1 Radio, infrared and molecular emission
Recently, Reach et al. (2006) used Spitzer Space Telescope GLIMPSE data to resolve the mid-infrared structure of W44 between 3.6 and 8 m (Benjamin et al. 2003). To study the relationship between the infrared and radio features in the SNR W44 we have combined the data at 4.5 m with the new radio image at 324 MHz in a false color image (Fig. 10). In this figure, the mid-infrared emission is shown in orange and the radio emission in blue; magenta thus corresponds to regions where both spectral bands overlap. The distribution of compact OH (1720 MHz) maser spots (Claussen et al. 1997; Hoffman et al. 2005) are shown as plus signs.
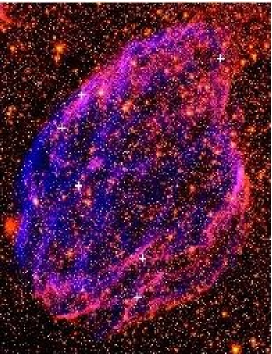
The mid-IR (MIR) image reveals extensive filamentary emission and some isolated bright clumps. This emission is particularly bright in the north and southwestern parts of W44, where bright near infrared H2 line (2.12 m) emission is also present (Reach et al. 2005). Figure 10 reveals the impressive agreement between the low frequency radio emission and the infrared 4.5 m emission to the north and southwest, where the brightest radio filaments are almost exactly coincident with the infrared radiation. In contrast, the central and eastern regions do not show much obvious correspondence with the exception of a few bright knots. The westernmost bright radio arc near , which is also bright in Hα, [SII] and [NII] lines (Giacani et al. 1997; Mavromatakis et al. 2003), has an infrared counterpart that mimics the appearance of the radio arc.
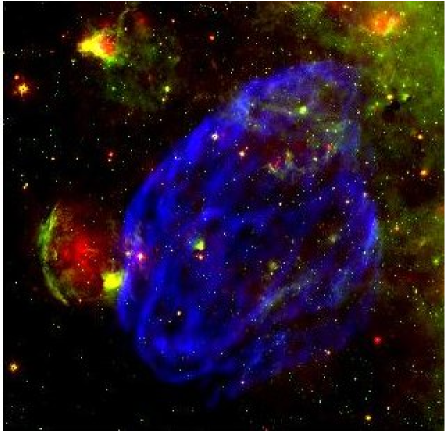
The mid-IR study is also useful for understanding W44 in the context of the surrounding interstellar medium. Figure 11 displays a three color image of W44 comparing the radio morphology at 324 MHz (blue) with Spitzer GLIMPSE and MIPSGAL images at 8 m (green) and 24 m (red), respectively (Carey et al., in preparation). These infrared bands are excellent tracers of the warm dust associated with star formation. The most conspicuous feature in Fig. 11 is the 10 arcmin region just outside the southeast limb of W44 (red nebula), identified by Paladini et al. (2003) as the HII region G034.7$-$00.6. In this case the combination of the 8 and 24 m images reveals with impressive detail the hot dust grains (in red) in the Strömgren sphere, limited to the east by an annular photo dissociation region (PDR) dominated by polycyclic aromatic hydrocarbon (PAH) emitting near 8 m (green). The bright yellow spot abuts the only portion of the eastern limb of W44 with a concave shape (near , ) coincident with the brightest radio filament and the region determined to have a positive (inverted) radio spectrum (as shown in §4.2). The IR point source is the IRAS source 18544+0112, proposed by Molinari et al. (1996) to be a young stellar object (YSO) in a primitive evolutionary stage.
As summarized in the introduction (§1), W44 is one of the few SNRs known to be physically interacting with its parent molecular cloud complex, with high-angular resolution molecular studies in different near-IR (NIR) and millimetric lines (see for example Seta et al. 2004; Reach et al. 2005) clearly indicating its evolution within a giant molecular cloud. In particular, one molecular cloud component has been detected adjacent and closely parallel to its bright eastern radio boundary (Reach et al. 2005, see for instance Fig. 3e in their paper), while another one is located near the very bright western arc. Seta et al. (2004) provide a useful schematic illustration of the various CO features discovered towards W44 (Fig. 3 in their paper). In particular, and near the radial velocity of 47 km s-1 approximately corresponding to the 2.9 kpc distance attributed to W44, they identify a CO “edge” feature exactly at the position of the YSO and the indentation of the eastern rim (E2 in their nomenclature). Based on the abrupt changes observed in the physical parameters, Seta et al. (2004) interpret the SNR as interacting with this particular molecular cloud component.
In this scenario involving molecular gas, an SNR, an HII region, and a YSO, it is worthwile to ask whether this may be a case of star formation triggered by the action of a SN shock on a coincident molecular cloud or, alternatively, whether it might illustrate a case of sequential star formation at the periphery of the HII region. This last case has been, for example, observed in the Sh~217 and Sh~219 HII regions (Deharveng et al. 2003). Although Molinari et al. (1996) proposed a kinematic distance of 3.7 kpc for the YSO, this distance might be an overestimate and the YSO is instead co-distant with W44, at about 2.9 kpc. The question then is whether the age of W44, of a few 104 yrs, is sufficient to have been responsible for the formation of new, massive stars. The timescale of star formation is currently under ample debate, but it is generally agreed that a few 106 yrs are necessary for the formation of protostars from condensed molecular matter (e.g. Tassis & Mouschovias 2004, and references therein). We are therefore led to the conclusion that if the YSO is related to W44, then the cloud collapse must have been initiated by the action of the precursor star’s wind and not directly by the SNR. Therefore we feel it is more plausible that the YSO is associated with the PDR around the HII region G034.7$-$00.6. Detailed NIR, MIR and millimeter studies are planned to further investigate the star formation in this complex region, with the goal of uncovering the underlying genetic links between the SN shock, the HII region, and the protostar.
From Fig. 11 regions of more nebulous infrared emission toward the north-northwestern sides of W44 are also apparent, and the yellow spot about 1 arcmin in size seen to the east of its geometrical center corresponds to the HII region G034.7$-$00.5 (centered at 18h 56m 26.5s, 01∘ 20 38, Paladini et al. 2003). Observations of radio recombination lines (RRL) would clearly be helpful to further elucidate the presence of thermally emitting gas in this area.
5.2 Radio and X-ray emission
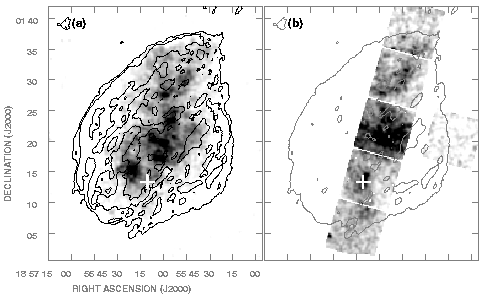
The X-ray emission from W44 has been investigated using the Einstein, EXOSAT, ROSAT, ASCA, and Chandra telescopes (Smith et al. 1985; Jones et al. 1993; Rho et al. 1994; Harrus et al. 1996; Shelton et al. 2004). In Fig. 12a we present a comparison between the 324 MHz radio image and the X-ray emission as observed with ROSAT in the energy range 0.2 to 2.4 keV (taken from ROSAT archives). As reported by Rho & Petre (1998), the brightest X-ray features are preferentially located in the center of the remnant, in a region of relatively low radio surface brightness. As expected, no correspondence is observed between the mostly thermal X-ray emission (Shelton et al. 2004) and the filamentary synchrotron radio emission. A number of physical processess such as cloud evaporation, electron thermal conduction, and entropy mixing have been proposed to explain the observed X-ray properties (see Shelton et al. 2004, for a review of the models). Reach et al. (2005) conclude that probably both, evaporating clumps and thermal conduction behind radiative shocks, are operating to produce the observed X-ray radiation.
Fig. 12b shows the Chandra image of W44 produced by Shelton et al. (2004) from the combination of 6 different pointings with the outer contour (traced at 4 level) of the 324 MHz radio emission plotted for comparison. Shelton et al. (2004) suggest that diffuse X-ray emission is observed extending slightly beyond the northwestern border of the radio synchrotron emission. The new high-sensitivity radio images presented here, however, do not support this conclusion.
6 Energetics of SNR W44
As W44 harbours a pulsar with a PWN and is spatially coincident with the GeV gamma-ray source 3EG~1856+0114, it is useful to calculate its total energy content and compare it with other Galactic SNRs with central compact objects. The total synchrotron energy is stored in the magnetic field as well as in the kinetic energy of the relativistic particles. Under the assumption of equipartition between particles and magnetic energy, the minimum energy content and the corresponding magnetic field can be obtained from the following relations (Moffet 1975)
| (1) |
| (2) |
where is the volume of the source, is a factor which depends on the assumed lower and upper cutoff frequencies and the spectral index, and is the total luminosity of the source. We note that electrons may not be the only energetic particles within the source; an appreciable amount of energy may also be stored in energetic baryons. The total particle energy can be described as =, where , the energy ratio between electrons and baryons is usually assumed to be 50 (Moffet 1975).
Using the integrated spectral index of 0.37 and assuming isotropic radiation, we derive a total luminosity for W44 of 7.8 1034 erg s-1. The volume of the source is estimated to be about 2 1059 cm3 by approximating W44 as a sphere of radius 11.6 pc. For typical lower and upper cutoff frequencies of 107 and 1011 MHz, the total minimum energy content is 5.8 1049 erg. Following the same procedure and with similar assumptions we also re-estimated the total energy content of the PWN based on the 324 MHz data. We derive its minimum energy as erg, in good agreement with Frail et al. (1996)’s results ( erg) estimated from higher radio frequencies observations.
The minimum energy derived for W44 is comparable to the value obtained for SNR CTB80 ( erg, Castelletti et al. 2003), another SNR containing a pulsar, and two orders of magnitude higher than the energy content of W28 ( erg, Dubner et al. 2000).
The corresponding minimum magnetic field in the SNR is =18 G, consistent with the compression of a typical ISM magnetic field (about 5 G, Wielebinski & Beck 2005) by a factor of three to four.
7 Conclusions
We have presented new high-sensitivity and high-resolution low frequency VLA radio images of the SNR W44. These images provide an unprecedented view of W44 with an angular resolution of 37′′ and 13′′ at 74 and 324 MHz, respectively, an improvement of over two orders of magnitude over the best, previous low-frequency image of this SNR.
Based on our 74 MHz image sensitive to structures with angular scales from a few arcseconds to half a degree, we measure an integrated flux density for W44 of S634 Jy. Similarly, from our 324 MHz image sensitive to spatial structures between 13 arcsec and 1 degree, we derive an integrated flux density S411 Jy. We have used these measurements, together with carefully considered flux densities present in the literature, to calculate an accurate global radio spectrum of the SNR. The best fit to the data yields an integrated spectral index =0.370.02, constant over four decades in frequency with no significant turnover down to 74 MHz. The straight power law spectrum is in contrast to a number of other SNRs that exhibit spectral turnovers at low frequencies, and is consistent with previous low frequency measurements of this object.
The new 74 and 324 MHz data, together with existing 1442 MHz data, were combined to perform the first careful, spatially resolved study of the synchrotron spectrum in W44. High-dynamic range observations at three well spaced frequencies are ideal for accurately constraining the variation of the spectrum within the source. Our results were obtained first from standard analysis of spectral index maps, and thereafter confirmed using spectral tomography techniques. The main findings of our radio continuum spectral index study are:
(i) The eastern limb, which is the brightest portion of W44 SNR, as well as the narrow filaments observed in total power across most of the surface of the source have a straight power law spectrum between 74 and 1442 MHz with 0.4, 0.5. This result is consistent with the predictions of a simple, diffusive shock acceleration model applied to the filamentary shell of W44.
(ii) From the 74/324 MHz comparison we have discovered a narrow feature with a positive spectrum (0.0 +0.4 ) located towards the southeast border of W44, coincident with an indentation in the limb of the SNR. At this location existing studies have shown that the SNR shock is interacting with an external molecular cloud. Also, flanking this portion of W44, mid-IR observations have revealed the presence of an almost circular HII region surrounded by a PDR region. Exactly at the interface between this HII region and W44, as seen in the plane of the sky, a young stellar object is present. A likely explanation of the inversion in the low frequency radio continuum spectrum in this region is free-free absorption from ionized gas in the post shock region at the SNR/molecular cloud interface. If this is the case, it marks the second case of spatially resolved low frequency radio observations tracing an SNR/molecular cloud interaction, following Brogan et al. (2005)’s detection of thermal absorption at the periphery of 3C~391. An alternative explanation is that the thermal absorption is occuring at the borders of the cavity carved by the collindant HII region, where the column density of thermal electrons might be highest. The spectral inversion is probably produced by a combination of both these effects. However this localized absorption is negligible compared to the total integrated flux and thus has no measurable influence on the integrated continuum spectrum. Further IR and millimeter observations are planned to investigate the 3-D distribution of the gas emitting in the different spectral regimes, and to elucidate the precise physical processes acting at this site. This should shed light on the complex chain of interconnected events that can tie together the evolution of W44, its parent molecular cloud, precursor star, and neighbouring HII region in a scenario consistent with the formation of a new generation of stars exactly at the interface SNR/molecular cloud.
(iii) The comparison of the spectrum between 74 and 324 MHz and between 324 and 1442 MHz revealed a spectral flattening ocurring on the westernmost arc of W44 at the lowest frequency pair (concave down spectrum). Our hypothesis is that this spectral flattening is related to the SNR shock colliding with a molecular cloud in this region, consistent with the bright optical filaments and IR emission observed there. In this scenario the spectral flattening could be a consequence of strong postshock densities and enhanced magnetic fields. If the electron energy spectrum hardens at lower frequencies, regions in which the magnetic field is higher than the surroundings will appear both brighter and with a flatter spectrum. A firm estimate of the distribution of magnetic field strength throughout the SNR would be important to test this hypothesis.
(iv) The present study revealed that there is no evidence in the radio continuum spectrum of any coupling between the associated pulsar PSR~B1853+01 and the surrounding SNR shell (that could, for example, have been observable as a gradual steepening from the pulsar to the shell). Furthermore, there is no spectral signature indicating any link to the EGRET -ray source whose 95% confidence ellipse covers most of the southeast corner of W44.
We have also used the new 324 MHz image to perform the first detailed low frequency radio/IR comparison for W44. Bright filamentary IR emission detected by Spitzer at 4.5 m shows an impressive correspondence with the radio emission towards the north and western portions of the remnant. To the central and eastern regions of W44, however, almost no IR counterpart is observed for the radio emission.
From the comparison of the new radio image at 324 MHz with the X-ray emission as seen by ROSAT between 0.2 and 2.4 keV and with a high-resolution Chandra image, we can confirm that the synchrotron radio emission appears to surround the thermal X-ray plasma. As determined from previous studies, the X-ray emission is probably related to a combination of the evaporation of clouds and thermal conduction occuring behind radiative shocks. In addition heavy absorption likely produced by foreground molecular clouds may explain the absence of X-ray radiation towards the southeast.
We have also investigated the energetics in W44 based on the new observations and accurate, re-derived integrated spectrum. We find that the total minimum energy content is 5.81049 erg, a value in agreement with the estimates for other SNRs containing central pulsars. The minimum, equipartition magnetic field estimate is 18 G.
Finally, we note that this study adds to a growing list of examples confirming the importance of high resolution, low frequency radio observations in providing an important new tool to demonstrate and understand the physical interaction between SNR shocks and the surrounding dense material. This also points to the great potential of an emerging generation of much more sensitive low frequency instruments.
Future work will involve a detailed comparison of the radio spectral index distribution and the molecular emission in order to refine the analysis of the interaction between W44 and its parent molecular cloud. New IR and optical studies are also planned in order to improve our understanding of the underlying genetic links and causal relationships between the evolution of the SNR and the adjacent YSO in this inner Galactic complex.
Acknowledgements.
We thank W. Reach for supplying us with the IR data in electronic form. We also acknowledge the referee for his constructive comments. This research has been funded by Argentina grants ANPCYT-PICT 04-14018, UBACYT A055/04, ANPCYT-PICT 03-11235 and PIP-CONICET 6433. Basic research in Radio Astronomy at the Naval Research Laboratory is supported by 6.1 base funding. Data processing was carried out using the HOPE PC cluster at IAFE.References
- Altenhoff et al. (1970) Altenhoff, W. J., Downes, D., Goad, L., Maxwell, A., & Rinehart, R. 1970, A&AS, 1, 319
- Anderson & Rudnick (1993) Anderson, M. C. & Rudnick, L. 1993, ApJ, 408, 514
- Baars et al. (1977) Baars, J. W. M., Genzel, R., Pauliny-Toth, I. I. K., & Witzel, A. 1977, A&A, 61, 99
- Beard & Kerr (1969) Beard, M. & Kerr, F. J. 1969, Australian Journal of Physics, 22, 121
- Benjamin et al. (2003) Benjamin, R. A., Churchwell, E., Babler, B. L., et al. 2003, PASP, 115, 953
- Bennett (1963) Bennett, A. S. 1963, MNRAS, 127, 3
- Brogan et al. (2005) Brogan, C. L., Lazio, T. J., Kassim, N. E., & Dyer, K. K. 2005, AJ, 130, 148
- Buckley et al. (1998) Buckley, J. H., Akerlof, C. W., Carter-Lewis, D. A., et al. 1998, A&A, 329, 639
- Castelletti et al. (2006) Castelletti, G., Dubner, G., Golap, K., & Goss, W. M. 2006, A&A, 459, 535
- Castelletti et al. (2003) Castelletti, G., Dubner, G., Golap, K., et al. 2003, AJ, 126, 2114
- Caswell et al. (1975) Caswell, J. L., Murray, J. D., Roger, R. S., Cole, D. J., & Cooke, D. J. 1975, A&A, 45, 239
- Clark et al. (1975) Clark, D. H., Green, A. J., & Caswell, J. L. 1975, Australian Journal of Physics Astrophysical Supplement, 75
- Claussen et al. (1997) Claussen, M. J., Frail, D. A., Goss, W. M., & Gaume, R. A. 1997, ApJ, 489, 143
- Condon et al. (1998) Condon, J. J., Cotton, W. D., Greisen, E. W., et al. 1998, AJ, 115, 1693
- Cornwell & Fomalont (1999) Cornwell, T. & Fomalont, E. B. 1999, in ASP Conf. Ser. 180: Synthesis Imaging in Radio Astronomy II, ed. G. B. Taylor, C. L. Carilli, & R. A. Perley, 187
- Cornwell & Perley (1992) Cornwell, T. J. & Perley, R. A. 1992, A&A, 261, 353
- Cotton et al. (2004) Cotton, W. D., Condon, J. J., Perley, R. A., et al. 2004, in Ground-based Telescopes. Edited by Oschmann, Jacobus M., Jr. Proceedings of the SPIE, Volume 5489, pp. 180-189 (2004)., ed. J. M. Oschmann, Jr., 180
- Davis et al. (1965) Davis, M. M., Gelato-Volders, L., & Westerhout, G. 1965, Bull. Astron. Inst. Netherlands, 18, 42
- de Jager & Mastichiadis (1997) de Jager, O. C. & Mastichiadis, A. 1997, ApJ, 482, 874
- Deharveng et al. (2003) Deharveng, L., Zavagno, A., Salas, L., et al. 2003, A&A, 399, 1135
- Dickel & Denoyer (1975) Dickel, J. R. & Denoyer, L. K. 1975, AJ, 80, 437
- Downes et al. (1980) Downes, D., Wilson, T. L., Bieging, J., & Wink, J. 1980, A&AS, 40, 379
- Dubner et al. (2000) Dubner, G. M., Velázquez, P. F., Goss, W. M., & Holdaway, M. A. 2000, AJ, 120, 1933
- Edge et al. (1958) Edge, D. O., Shakeshaft, J. R., McAdam, W. B., Baldwin, J. E., & Archer, S. 1958, Mem. R. Astr. Soc., 68, 37
- Eisenhauer et al. (2005) Eisenhauer, F., Genzel, R., Alexander, T., et al. 2005, ApJ, 628, 246
- Esposito et al. (1996) Esposito, J. A., Hunter, S. D., Kanbach, G., & Sreekumar, P. 1996, ApJ, 461, 820
- Fatuzzo & Melia (2005) Fatuzzo, M. & Melia, F. 2005, ApJ, 630, 321
- Feast & Whitelock (1997) Feast, M. & Whitelock, P. 1997, MNRAS, 291, 683
- Frail et al. (1996) Frail, D. A., Giacani, E. B., Goss, W. M., & Dubner, G. 1996, ApJ, 464, L165
- Gaensler (1998) Gaensler, B. M. 1998, ApJ, 493, 781
- Giacani et al. (1997) Giacani, E. B., Dubner, G. M., Kassim, N. E., et al. 1997, AJ, 113, 1379
- Harris (1962) Harris, D. E. 1962, ApJ, 135, 661
- Harrus et al. (1996) Harrus, I. M., Hughes, J. P., & Helfand, D. J. 1996, ApJ, 464, L161
- Hoffman et al. (2005) Hoffman, I. M., Goss, W. M., Brogan, C. L., & Claussen, M. J. 2005, ApJ, 627, 803
- Holden & Caswell (1969) Holden, D. J. & Caswell, J. L. 1969, MNRAS, 143, 407
- Hollinger & Hobbs (1966) Hollinger, J. P. & Hobbs, R. W. 1966, Science, 153, 1633
- Jones et al. (1993) Jones, L. R., Smith, A., & Angellini, L. 1993, MNRAS, 265, 631
- Kassim (1989a) Kassim, N. E. 1989a, ApJ, 347, 915
- Kassim (1989b) Kassim, N. E. 1989b, ApJS, 71, 799
- Kassim (1992) Kassim, N. E. 1992, AJ, 103, 943
- Kassim et al. (1993) Kassim, N. E., Perley, R. A., Erickson, W. C., & Dwarakanath, K. S. 1993, AJ, 106, 2218
- Katz-Stone & Rudnick (1997) Katz-Stone, D. M. & Rudnick, L. 1997, ApJ, 479, 258
- Kellermann et al. (1969) Kellermann, K. I., Pauliny-Toth, I. I. K., & Williams, P. J. S. 1969, ApJ, 157, 1
- Kesteven (1968) Kesteven, M. J. L. 1968, Australian Journal of Physics, 21, 369
- Kovalenko et al. (1994) Kovalenko, A. V., Pynzar’, A. V., & Udal’Tsov, V. A. 1994, Astronomy Reports, 38, 784
- Kundu & Velusamy (1967) Kundu, M. R. & Velusamy, T. 1967, Annales d’Astrophysique, 30, 723
- Kundu & Velusamy (1969) Kundu, M. R. & Velusamy, T. 1969, ApJ, 155, 807
- Kundu & Velusamy (1972) Kundu, M. R. & Velusamy, T. 1972, A&A, 20, 237
- Kuz’min (1962) Kuz’min, A. D. 1962, Soviet Astronomy, 5, 692
- Kuz’min et al. (1960) Kuz’min, A. D., Levchenko, M. T., Noskova, R. I., & Salomonovich, A. E. 1960, AZh, 37, 975
- Lacey et al. (2001) Lacey, C. K., Lazio, T. J. W., Kassim, N. E., et al. 2001, ApJ, 559, 954
- Large et al. (1961) Large, M. I., Mathewson, D. S., & Haslam, C. G. T. 1961, MNRAS, 123, 113
- Leslard (1995) Leslard, R. W. 1995, in Proceedings of the International Cosmic Ray Conference, Rome, 2, 475
- Leslie (1960) Leslie, P. R. R. 1960, The Observatory, 80, 23
- Mavromatakis et al. (2003) Mavromatakis, F., Boumis, P., & Goudis, C. D. 2003, A&A, 405, 591
- Mills et al. (1958) Mills, B. Y., Slee, O. B., & Hill, E. R. 1958, Australian Journal of Physics, 11, 360
- Milne (1969) Milne, D. K. 1969, Australian Journal of Physics, 22, 613
- Milne & Dickel (1974) Milne, D. K. & Dickel, J. R. 1974, Australian Journal of Physics, 27, 549
- Moffet (1975) Moffet, A. T. 1975, Strong Nonthermal Radio Emission from Galaxies: Galaxies and the Universe (ed. Sandage, A.,Sandage, M. and Kristian, J., Chicago:Univ.Chicago Press), 211
- Molinari et al. (1996) Molinari, S., Brand, J., Cesaroni, R., & Palla, F. 1996, A&A, 308, 573
- Moran (1965) Moran, M. 1965, MNRAS, 129, 447
- Paladini et al. (2003) Paladini, R., Burigana, C., Davies, R. D., et al. 2003, A&A, 397, 213
- Pauliny-Toth et al. (1966) Pauliny-Toth, I. I. K., Wade, C. M., & Heeschen, D. S. 1966, ApJS, 13, 65
- Petre et al. (2002) Petre, R., Kuntz, K. D., & Shelton, R. L. 2002, ApJ, 579, 404
- Radhakrishnan et al. (1972) Radhakrishnan, V., Goss, W. M., Murray, J. D., & Brooks, J. W. 1972, ApJS, 24, 49
- Reach et al. (2005) Reach, W. T., Rho, J., & Jarrett, T. H. 2005, ApJ, 618, 297
- Reach et al. (2006) Reach, W. T., Rho, J., Tappe, A., et al. 2006, AJ, 131, 1479
- Reich et al. (1990) Reich, W., Reich, P., & Fuerst, E. 1990, A&AS, 83, 539
- Reynolds & Ellison (1992) Reynolds, S. P. & Ellison, D. C. 1992, ApJ, 399, L75
- Rho & Petre (1998) Rho, J. & Petre, R. 1998, ApJ, 503, L167
- Rho et al. (1994) Rho, J., Petre, R., Schlegel, E. M., & Hester, J. J. 1994, ApJ, 430, 757
- Roger et al. (1986) Roger, R. S., Costain, C. H., & Stewart, D. I. 1986, A&AS, 65, 485
- Rowell et al. (2000) Rowell, G. P., Naito, T., Dazeley, S. A., et al. 2000, A&A, 359, 337
- Scheuer (1963) Scheuer, P. A. G. 1963, The Observatory, 83, 56
- Seta et al. (1998) Seta, M., Hasegawa, T., Dame, T. M., et al. 1998, ApJ, 505, 286
- Seta et al. (2004) Seta, M., Hasegawa, T., Sakamoto, S., et al. 2004, AJ, 127, 1098
- Shelton et al. (2004) Shelton, R. L., Kuntz, K. D., & Petre, R. 2004, ApJ, 611, 906
- Smith et al. (1985) Smith, A., Jones, L. R., Watson, M. G., et al. 1985, MNRAS, 217, 99
- Tassis & Mouschovias (2004) Tassis, K. & Mouschovias, T. C. 2004, ApJ, 616, 283
- Thompson et al. (1996) Thompson, D. J., Bertsch, D. L., Dingus, B. L., et al. 1996, ApJS, 107, 227
- Velusamy & Kundu (1974) Velusamy, T. & Kundu, M. R. 1974, A&A, 32, 375
- Westerhout (1958) Westerhout, G. 1958, Bull. Astron. Inst. Netherlands, 14, 215
- Wielebinski & Beck (2005) Wielebinski, R. & Beck, R. 2005, in LNP Vol. 664: Cosmic Magnetic Fields, ed. R. Wielebinski & R. Beck
- Willis (1973) Willis, A. G. 1973, A&A, 26, 237
- Wilson (1963) Wilson, R. W. 1963, AJ, 68, 181
- Wolszczan et al. (1991) Wolszczan, A., Cordes, J. M., & Dewey, R. J. 1991, ApJ, 372, L99