A CO () Outflow Survey of the Elias 29 Region
Abstract
We present a 5 integrated intensity map of 12CO () emission from the Ophiuchi cloud core that traces low-luminosity outflow emission from two protostars: Elias 29 and, most likely, LFAM 26. The morphology of the outflow from Elias 29 is bipolar and has a curved axis that traces the S-shaped symmetry seen in H2 emission. The outflow from LFAM 26 is a new detection and oriented in the east/west direction near the plane of the sky with most of the blue-shifted emission being absorbed by intervening clouds. The outflow axis of this object also appears to intersect a knot of H2 emission previously attributed to Elias 29. LFAM 26 is a low luminosity source () which, in combination with the observed outflow, makes it a candidate Very Low Luminosity Object (VeLLO). We derive lower limits to the gas column densities and energetics for both outflows. The mechanical luminosities for Elias 29 and LFAM 26 are 6.4 and 10.3 , respectively.
1 Introduction
We present 12CO () observations towards the (36 ) Class I protostar Elias 29 ( [J2000.0]) located in the Ophiuchi star forming region. The -Oph cloud complex is nearby (pc, Loinard 2006) and has a diverse (proto-)stellar environment that makes it a superb laboratory for studying the impact of molecular outflows on the surrounding environment. The region around Elias 29 is a particularly well-studied component of the cloud complex. Two foreground clouds at km s-1 and km s-1 account for the presence of cool ice along the line of sight and absorb much of the blue-shifted outflow emission in this region (Boogert et al. 2002). Furthermore, Boogert et al. (2002) identified a ridge of dense material at km s-1 within which both Elias 29 and LFAM 26 reside. Ceccarelli et al. (2002) obtained spectra of the 12CO () transition with the JCMT and the CO levels with the ISO SWS towards Elias 29. These authors found evidence for a super-heated surface disk layer with a temperature and mass similar to that found in Herbig AeBe stars (Thi et al. 2001), suggesting that Elias 29 may be a deeply embedded Herbig AeBe star or a transition object between the standard Class I and Class II types. Bontemps et al. (1996) reported the discovery of an outflow around Elias 29 and estimated its momentum rate. A larger map of the region was made in the 12CO () transition by Sekimoto et al. (1997).
In this paper, we present 12CO () observations that further expand the size of the mapped region and reaffirm the bipolar nature of the outflow, but find that it is more extended than previously thought. Furthermore, the map has sufficient size to identify a previously undiscovered outflow whose source appears to be LFAM 26. First discovered as a radio source (Leous et al. 1991), LFAM 26 was later identified as a low luminosity () Class I protostar based on ISOCAM photometry (Bontemps et al. 2001). The extreme faintness of this source, coupled with the detection of molecular outflows presented in this paper, make it a candidate VeLLO. However, detailed modeling of the infrared SED will be necessary to determine if this object meets the primary criterion of .
2 Observations
We made a 5 12CO () On-The-Fly map centered spectrally at 345.795975 GHz and spatially on Elias 29 using the 10m Heinrich Hertz Telescope (HHT) on Mt. Graham, Arizona during April 2001 and January 2006. A 256 channel filterbank spectrometer with 250 kHz resolution was used as the backend in 2001, and two 2048 channel Acousto-Optical Spectrometers (AOS) with 475 kHz resolution were used in 2006. The off-position for both maps was located at a clean offset (Kulesa et al. 2005) of from Elias 29. We obtained two rows of data per OFF, translating to 1 OFF observation per minute for a 10 per second scan rate. Each row is offset in declination by 10. At 345 GHz, the half-power telescope beamsize and main beam efficiency were measured to be 22 and 0.7, respectively. Pointing accuracy of a few arcseconds was maintained by observing planets approximately once per hour. The OTF data grid was convolved with an 11 beam to obtain a Nyquist-sampled map. System temperatures during the observing run were 500-1500 K. Line strengths were calibrated using hot and cold loads in conjunction with sky measurements at the off position (Stark et al. 2001). Calibration uncertainty is estimated to be %. For both datasets, the main beam temperature () showed a typical rms noise level of 0.7 K . The 2001 data are smoothed in velocity space to match the 0.4 km s-1 bins of the 2006 data. The final datacube used in the analysis is an rms-weighted average of the two datasets and has a typical rms noise temperature of K.
3 Results
3.1 Outflow Morphology
In Figure 1, we show spectra located at the driving sources as well as at the approximate peak of the integrated emission intensity in the blue and red lobes of both outflows. The vertical lines demarcate the position in velocity space of intervening absorption clouds along the line of sight at km s-1 and km s-1, as well as a ridge of material at km s-1 (Boogert et al. 2002). Each of the spectra show signs of significant absorption due to these intervening clouds.
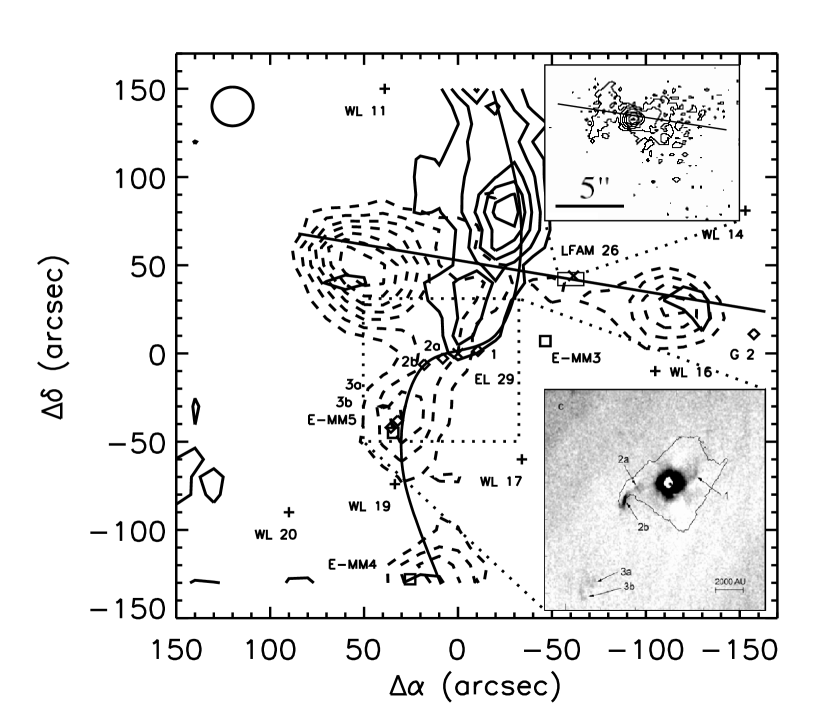
Figure 2 shows the integrated intensity map of the blue-shifted (solid contours, to 1 km s-1) and red-shifted (dashed contours, to 12 km s-1) outflow emission. The velocity ranges have been chosen to avoid the absorption features from the intervening clouds detected by Boogert et al. (2002). Crosses show the location of Elias 29 and LFAM 26, plus signs indicate the position of infrared sources (Wilking & Lada 1983), squares represent starless cores (Motte et al. 1998), and the diamonds show H2 emission knots observed by Gómez et al. (feature G2 2003) and by Ybarra et al. (features 1-3b 2006). Elias 29 is associated with emission towards the north (blue-shifted) and south (red-shifted), consistent with results from previous outflow surveys (Bontemps et al. 1996; Sekimoto et al. 1997) that have suggested a bipolar outflow with a mostly pole-on inclination (Hanner et al. 1995).
The large scale outflow morphology strongly resembles the S-shaped symmetry observed in H2 emission near the driving source (Ybarra et al. 2006), with the blue lobe bending to the northeast and the red lobe bending to the southwest. The solid curve through the peaks of the Elias 29 blue and red lobes represents our best estimate of the outflow axis and is weighted by eye towards the five H2 emission knots labelled as features 1, 2a, 2b, 3a, and 3b (Ybarra et al. 2006) in the main panel of Figure 2. The bottom right inset is reproduced from Ybarra et al. (2006) and shows the structure of the region as seen in H2 emission. Regions and appear to trace the peak of the red-shifted outflow emission. Ceccarelli et al. (2002) mapped CO () line emission over a field centered on Elias 29 with an effective beamsize of . Contour maps of their observed wing emission show evidence in support of an east-west outflow axis, consistent with the S-shaped symmetry found by Ybarra et al. (2006) and seen in the central regions of our map. Higher spatial resolution observations will be necessary to explore the detailed morphology of the central region of outflow emission from Elias 29 and provide a more precise comparison with the known H2 regions.
In addition to the well-studied outflow from Elias 29, we report a new outflow whose source appears to be LFAM 26, a Class I protostar (Greene et al. 1994; Bontemps et al. 2001) located 1 northwest of Elias 29. The morphology of this outflow—with lobes to the east and west both showing significant red-shifted emission—suggests that its axis lies near the plane of the sky, as shown by the solid line in Figure 2. The relatively low level of blue-shifted emission from this outflow is most likely due to the presence of the foreground absorbing clouds at km s-1 and km s-1 (Boogert et al. 2002). In particular, the km s-1 cloud is roughly spatially coincident with the eastern lobe of the LFAM 26 outflow. H2 emission detected within the contours of the integrated emission intensity to the east (Ybarra & Barsony 2004) lends further support to the notion of LFAM 26 as the driving source. The outflow axis as drawn lies nearly a full beamwidth away from [GSWC2003] 2, a knot of H2 emission detected by Gómez et al. (2003). These authors attributed the H2 knot to the Elias 29 outflow, but in our CO () wing map, the western lobe of the LFAM 26 outflow appears to lie between LFAM 26 and [GSWC2003] 2, suggesting that LFAM 26 is a more likely candidate than Elias 29 to be the powering source of the H2 knot.
It must be kept in mind that this is a particularly dense region of -Oph which makes the association of outflows with their driving sources particularly problematic. For this reason, additional evidence linking LFAM 26 and the observed outflows is desirable. This evidence comes in the form of nebulous emission seen in deep NIR imaging of LFAM 26 that has a distinct hourglass shape—shown in the top right inset of Figure 2 (taken from Fig. 4 in Duchêne et al. 2004)—with the nebulosity extending a few arcseconds away on either side of the central source. The orientation of the hourglass roughly coincides with the 100∘ outflow position angle we estimated above, serving as further evidence that LFAM 26 is the powering source of the observed outflow. The hourglass shape around LFAM 26 is consistent with the presence of an edge-on accretion disk. Whether or not LFAM 26 qualifies as a VeLLO must await detailed modeling of its IR SED, a task which is beyond the scope of this letter.
It should be noted that the integrated emission intensity peaks do not appear to lie directly on the outflow axis as shown in Figure 2. Due to the masking effect of foreground clouds, the redshifted emission components alone may not accurately portray the east-west spatial centroids of the outflow. Nevertheless, let us consider the possibility of alternative driving source(s). First, the object closest to LFAM 26 is E-MM3, located 15 east and 30 south of LFAM 26. This object was first labelled as a starless core (Motte et al. 1998), but subsequent VLT H and Ks observations showed a bipolar reflection nebulosity surrounding it in much the same manner as LFAM 26 (Brandner et al. 2000). However, the orientation of this reflection nebula is closer to north/south than east/west and is therefore an unlikely candidate for the driving source. Another possibility is that each of the outflows is driven by one of the other embedded objects either in this region (e.g. E-MM4 or E-MM5) or beyond. Given the highly obscured, complex structure of the region, this scenario is plausible. Finally, it is conceivable that Elias 29 is a binary system, with the other object producing the observed outflow. However, numerous searches using a wide variety of techniques from lunar occultations (Simon et al. 1995) to deep NIR imaging (Duchêne et al. 2004) have found no evidence for a companion.
3.2 Outflow Energetics
Physical parameters of each outflow are summarized in Table 1. From the integrated intensity map, we estimate the maximum radius () and area () of each outflow lobe centered on the position of peak flux. Here the characteristic velocity of each outflow, , is the maximum outflow velocity detected in the associated 12CO () spectra, . The dynamical timescale is . We assume the wings of the 12CO () emission are optically thin, so the values in Table 1 represent lower limits to the actual values. As mentioned in Section 3.1, however, there is evidence of strong absorption of the blue-shifted outflow emission from LFAM 26 due to the presence of foreground absorption clouds. Furthermore, the measured radial velocity underestimates the characteristic velocity by a factor of , where is the inclination angle. If the outflow axis of LFAM 26 is near the plane of the sky, then approaches 0∘ and the correction factor can increase significantly.
From the peak main beam temperature in the 12CO () spectrum, we estimate K. While is not constant across the map, the variations are small and do not significantly affect the results. For instance, if we assume a that is smaller by a factor of 2, we find average column densities that are roughly a factor of 2 larger. The total CO column density, , is calculated from Kulesa et al. (2005) under the assumption of LTE. Assuming dark cloud abundances of [H2]/[CO], we estimate the mass of each outflow lobe to be H2/[CO]), where is the mean atomic weight of the gas, 1.36 (Sekimoto et al. 1997). The mass outflow rate is , the outflow momentum is and the outflow force is . The mechanical luminosity is estimated as . The outflow to infall conversion efficiency is .
Sekimoto et al. (1997) and Bontemps et al. (1996) have obtained integrated intensity 12CO () emission maps centered on Elias 29. The 12CO () map shown here represents a significant enlargement of the surveyed area. Inside the mapped region, we find a larger radius for the blue lobe of Elias 29—0.058 pc compared to 0.024 pc in Sekimoto et al. (1997). We also find an average column density over the Elias 29 outflow that is a factor of lower than observed in 12CO (). The difference in column density estimates may be due to the 12CO () wing emission being optically thick. Our optically thin assumption would then underestimate the true column density by a factor of . Due to the extended size of the outflow region, the 12CO () derived outflow mass is comparable to that of Sekimoto et al. (1997). The outflow energetics are summarized in Table 1. The low values of the energetic parameters associated with Elias 29 suggest it is near the end of its outflow/accretion phase, consistent with the findings of Ceccarelli et al. (2002).
4 Summary
We present a 25 square arcminute map of 12CO () outflow emission centered on Elias 29. In the map, we see evidence suggesting the Elias 29 outflow is bipolar and has a curved flow that traces the same structure seen in H2 line emission. We report the first detection of a molecular outflow from LFAM 26, an object whose low luminosity makes it a candidate VeLLO. While the high density of protostellar objects in this region produces a complicated outflow structure that makes associating outflows with their driving sources somewhat problematic, we conclude LFAM 26 is the most likely driving source. Both the molecular outflow and the NIR scattered light cavity morphology suggests the associated outflow axis lies near the plane of the sky, in which case we are viewing the protostar through an edge-on accretion disk. We calculate lower limits on the mechanical luminosity of the outflows from Elias 29 and LFAM 26 to be 6.4 and 10.3 , respectively. The low value of for Elias 29 suggests this object is near the end of its outflow/accretion phase of evolution.
We wish to acknowledge the comments of the referee which were very helpful in refining the paper.
References
- Bontemps et al. (2001) Bontemps, S., André, P., Kaas, A. A., Nordh, L., Olofsson, G., Huldtgren, M., Abergel, A., Blommaert, J., Boulanger, F., Burgdorf, M., Cesarsky, C. J., Cesarsky, D., Copet, E., Davies, J., Falgarone, E., Lagache, G., Montmerle, T., Pérault, M., Persi, P., Prusti, T., Puget, J. L., & Sibille, F. 2001, A&A, 372, 173
- Bontemps et al. (1996) Bontemps, S., Andre, P., Terebey, S., & Cabrit, S. 1996, A&A, 311, 858
- Boogert et al. (2002) Boogert, A. C. A., Hogerheijde, M. R., Ceccarelli, C., Tielens, A. G. G. M., van Dishoeck, E. F., Blake, G. A., Latter, W. B., & Motte, F. 2002, ApJ, 570, 708
- Brandner et al. (2000) Brandner, W., Sheppard, S., Zinnecker, H., Close, L., Iwamuro, F., Krabbe, A., Maihara, T., Motohara, K., Padgett, D. L., & Tokunaga, A. 2000, A&A, 364, L13
- Ceccarelli et al. (2002) Ceccarelli, C., Boogert, A. C. A., Tielens, A. G. G. M., Caux, E., Hogerheijde, M. R., & Parise, B. 2002, A&A, 395, 863
- Duchêne et al. (2004) Duchêne, G., Bouvier, J., Bontemps, S., André, P., & Motte, F. 2004, A&A, 427, 651
- Gómez et al. (2003) Gómez, M., Stark, D. P., Whitney, B. A., & Churchwell, E. 2003, AJ, 126, 863
- Greene et al. (1994) Greene, T. P., Wilking, B. A., Andre, P., Young, E. T., & Lada, C. J. 1994, ApJ, 434, 614
- Hanner et al. (1995) Hanner, M. S., Brooke, T. Y., & Tokunaga, A. T. 1995, ApJ, 438, 250
- Kulesa et al. (2005) Kulesa, C. A., Hungerford, A. L., Walker, C. K., Zhang, X., & Lane, A. P. 2005, ApJ, 625, 194
- Leous et al. (1991) Leous, J. A., Feigelson, E. D., Andre, P., & Montmerle, T. 1991, ApJ, 379, 683
- Loinard (2006) Loinard, L. 2006, in American Astronomical Society Meeting Abstracts, 133.03–+
- Motte et al. (1998) Motte, F., Andre, P., & Neri, R. 1998, A&A, 336, 150
- Sekimoto et al. (1997) Sekimoto, Y., Tatematsu, K., Umemoto, T., Koyama, K., Tsuboi, Y., Hirano, N., & Yamamoto, S. 1997, ApJ, 489, L63+
- Simon et al. (1995) Simon, M., Ghez, A. M., Leinert, C., Cassar, L., Chen, W. P., Howell, R. R., Jameson, R. F., Matthews, K., Neugebauer, G., & Richichi, A. 1995, ApJ, 443, 625
- Stark et al. (2001) Stark, A. A., Bally, J., Balm, S. P., Bania, T. M., Bolatto, A. D., Chamberlin, R. A., Engargiola, G., Huang, M., Ingalls, J. G., Jacobs, K., Jackson, J. M., Kooi, J. W., Lane, A. P., Lo, K.-Y., Marks, R. D., Martin, C. L., Mumma, D., Ojha, R., Schieder, R., Staguhn, J., Stutzki, J., Walker, C. K., Wilson, R. W., Wright, G. A., Zhang, X., Zimmermann, P., & Zimmermann, R. 2001, PASP, 113, 567
- Thi et al. (2001) Thi, W. F., van Dishoeck, E. F., Blake, G. A., van Zadelhoff, G. J., Horn, J., Becklin, E. E., Mannings, V., Sargent, A. I., van den Ancker, M. E., Natta, A., & Kessler, J. 2001, ApJ, 561, 1074
- Wilking & Lada (1983) Wilking, B. A. & Lada, C. J. 1983, ApJ, 274, 698
- Ybarra & Barsony (2004) Ybarra, J. E. & Barsony, M. 2004, in Bulletin of the American Astronomical Society, 1568–+
- Ybarra et al. (2006) Ybarra, J. E., Barsony, M., Haisch, Jr., K. E., Jarrett, T. H., Sahai, R., & Weinberger, A. J. 2006, ApJ, 647, L159
| Parameter | Elias 29 | LFAM 26 |
|---|---|---|
| (pc) | 0.058 | 0.064 |
| (yr) | 7.1 | 7.8 |
| (cm-2) | 3.6 | 3.3 |
| (sq. arcsec) | 5100 | 6600 |
| () | 8.7 | 15.2 |
| ( yr-1) | 1.2 | 1.9 |
| () | 0.15 | 0.25 |
| (km s-1) | 69 | 121 |
| (km s-1 ) | 9.8 | 15.6 |
| () | 6.4 | 10.3 |