Direct probes of Dark Matter in the cluster 1ES0657-556 through microwave observations
Abstract
Aims. The cluster 1ES0657-556 is an ideal astrophysical laboratory to study the distribution and the nature of Dark Matter because this last component is spatially separated from the intracluster gas. We show that microwave observations can provide crucial probes of Dark Matter in this system.
Methods. We calculate the expected SZ effect from Dark Matter annihilation in the main mass concentrations of the cluster 1ES0657-556, and we estimate the sources of contamination, confusion and bias to asses its significance.
Results. We find that SZ observations at GHz can resolve both spatially and spectrally the SZDM signal and isolate it from the other SZ signals, and mainly from the thermal SZ effect which is null at GHz for the case of 1ES0657-556 . We conclude that SZ observations with arcmin resolution and K sensitivity of 1ES0657-556 are crucial, and maybe unique, to find direct astrophysical probes of the existence and of the nature of Dark Matter, or to set strong experimental limits.
Key Words.:
Cosmology; Dark Matter; Galaxies: clusters: 1ES0657-556; Cosmic Microwave Background1 Introduction
Dark Matter (DM) annihilations in the halo of galaxies and galaxy clusters have crucial
astrophysical implications. In fact, if DM is constituted by weakly interacting massive
particles (for which the leading candidate is the lightest supersymmetric particle,
plausibly the neutralino ), their annihilation produces secondary particles (e.g.,
neutral and charged pions, secondary electrons and protons, neutrinos) that give rise to
various astrophysical signals. These are, among others, observable fluxes of positrons,
antiprotons, gamma rays, neutrinos, as well as signals due to secondary electrons which
cover the whole e.m. spectrum (see, e.g., Colafrancesco et al. 2006 for details):
synchrotron radio emission (in the intra-cluster magnetic field), bremsstrahlung emission
(if there is co-spatial intra-cluster gas), inverse Compton emission due to the
up-scattering of CMB photons and hence a specific SZ effect (as first noticed and derived
by Colafrancesco 2004).
The spatial and spectral intensity of the astrophysical signals coming from
annihilation is expected, however, to be confused or even overcome by other astrophysical
signals originating from the intracluster (IC) gas and/or from the relativistic plasmas
present in the cluster atmospheres, especially when all these components are co-spatially
distributed with the DM component. This situation occurs in most galaxy clusters (see
discussion by Colafrancesco et al. 2006 for the case of Coma).
An ideal system to detect DM annihilation signals would, therefore, be a cluster with a
clear spatial separation between the various matter components. This is, indeed, the case
of the cluster 1ES0657-556 where the spatial distribution of DM is clearly offset w.r.t.
that of the IC gas (Clowe et al. 2006). The two baryonic clumps of hot gas emit X-rays by
(thermal) bremsstrahlung, as observed by Chandra (Markevitch et al. 2002, 2004). The
shock observed in the western-most region of the cluster (Markevitch et al. 2002) might
be the site of high energy emission from particles accelerated at the shock.
Hard X-ray emission from the direction of 1ES0657-556 has been marginally detected by
Rossi-XTE (Petrosian et al. 2006) but its angular resolution is not sufficient to give
any information on the spatial distribution of this emission. No gamma-ray emission has
been detected from this system with EGRET.
The extended radio halo associated to this cluster (Liang et al. 2000) has a surface
brightness slightly elongated along the direction of the two X-ray clumps, but without
clear signatures of radio-brightness enhancements at the DM clump locations.
Finally, the SZ maps of 1ES0657-556 obtained with ACBAR (with arcmin FWHM
resolution, Gomez et al. 2003) are quite smooth and regular with no evidence of
enhancement at both X-ray and/or DM clump locations.
In this Letter, we will compute the specific feature of the SZ effect (herefater SZE)
produced by DM annihilation, SZDM, in the cluster 1ES0657-556 and we will show that it
is possible to detect such SZDM signal with a specific observational strategy.
The relevant physical quantities are calculated using km s-1 Mpc-1
and a flat, CDM () cosmological
model.
2 The complex SZ effect in 1ES0657-556
The various SZ signals expected from the subsystems of the cluster 1ES0657-556 are: i) the SZDM effect, which is expected to be located at the two DM clumps; ii) the thermal SZ effect (SZth) which is expected to be located at the two X-ray clumps. We will compute in the following these two sources of SZE and we will also discuss the possible sources of contamination, bias and confusion. The general expression for the SZE which is valid in the Thomson limit for a generic electron population in the relativistic limit and includes also the effects of multiple scatterings and the combination with other electron population in the cluster atmospheres has been derived by Colafrancesco et al. (2003). This approach is the one that will be used for the derivation of the SZDM effect induced by the secondary electrons produced by annihilation (see the original derivation by Colafrancesco 2004) as well as for the SZth produced by the hot X-ray emitting gas. According to these results, the spectral distortion of the CMB spectrum induced by a population of electron with momentum distribution can be written as
| (1) |
where is the CMB temperature and
| (2) |
in terms of the pressure contributed by the specific electron population. The spectral function , with , can be written as
| (3) |
in terms of the photon redistribution function and of . Here is the optical depth of the electrons with number density , and is the average energy of the electronic plasma. The photon redistribution function with , in terms of the CMB photon frequency increase factor , depends on the electron momentum distribution , where the momentum is normalized to . The CMB temperature change produced by the SZE is finally given by
| (4) |
The specific SZDM and SZth effects for the various electronic components in the cluster 1ES0657-556 are computed following the approach previously described.
2.1 The SZDM effect in the cluster 1ES0657-556
The calculation of the secondary electron spectrum from annihilation in
galaxy clusters has been already presented in details by Colafrancesco & Mele (2001) and
Colafrancesco et al. (2006), and here we will only recall the relevant steps necessary
for the present purpouses.
We assume, for simplicity, a spherical DM halo model for each DM clump of the cluster
1ES0657-556 , as indicated by the lensing maps derived by Clowe et al. (2006), with DM density
profile given by , with . Values
and reproduce the Navarro, Frenk & White (1997) density profile.
The neutralino number density profiles of the two DM
clumps have been calculated following the approach described in Colafrancesco et al.
(2006) with a NFW DM density profile and the following structure parameters: , Mpc and (for the
larger East DM clump); , Mpc
and (for the ”bullet” West DM clump).
The annihilation rate in the DM clumps is where is the annihilation cross
section averaged over a thermal velocity distribution at freeze-out temperature.
The range of neutralino masses and pair annihilation cross sections in the most general
supersymmetric DM setup is extremely wide (see discussion in Colafrancesco et al. 2006,
2007).
We consider here, specifically, the neutralino models worked out in Colafrancesco et al.
(2006) with and GeV and with their specific values of .
The electron source functions for the specific neutralino model considered here have been derived in
Colafrancesco et al. (2006) and the time evolution of the electron spectrum is given by
the equation
| (5) |
where spatial diffusion can be safely neglected in cluster-size DM clumps (Colafrancesco et al. 2006). The function
| (6) | |||||
gives the energy loss per unit time at energy where is the mean number density of thermal electrons in , and , , , , all in units of . The equilibrium spectrum obtained solving eq.(5) allows to calculate the SZDM effect. Fig.1 shows the CMB temperature change evaluated at the centers of the two DM clumps for different values of .
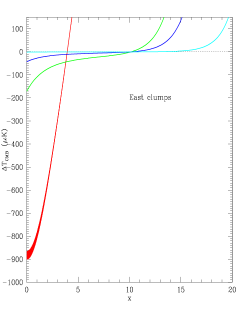
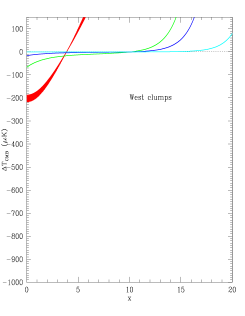
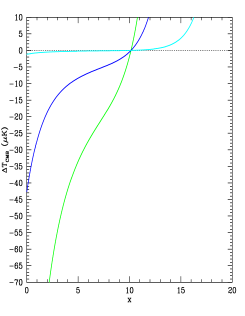
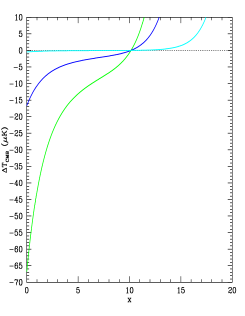
The SZDM signals are overcome by the SZth signals at low ( GHz) and high ( GHz) frequencies, while they dominate in the frequency range where the zero of SZth is found, i.e. at GHz for the East clump and at GHz for the West clump. At such frequencies the SZDM temperature decrement takes values K (East clump) and values K (West clump) for GeV, respectively.
2.2 The SZth effect in the cluster 1ES0657-556
The SZth from the two X-ray clumps of the cluster 1ES0657-556 is also computed from the
general approach delineated in eqs.(1-4). Following Markevitch et al. (2002, 2004) and
Tucker et al. (1998), we use the simplifying assumption that the IC gas distribution can
be described by isothermal spheres fitted by a -profile.
For the East X-ray clump we adopt keV (Markevitch et al. 2002, 2004) and a
-profile with kpc, and a central IC gas density
cm-3 (Tucker et al. 1998).
For the West X-ray clump we adopt keV and a -profile with
kpc, and a central IC gas density cm-3,
neglecting the additional central power-law density profile induced by the presence of
the shock (Markevitch et al. 2002, 2004). Thus, SZth from this last X-ray clump
should be considered as slightly underestimated.
The possible non-equilibrium and non-thermal effects induced by the merging shock are not
crucial for the aims of this paper since the shock is located outside the two X-ray
clumps and at a large angular distance from the two DM clumps (see Markevitch et al.
2002, 2004). Possible non-thermal SZE produced by shocks is, however, expected to be at
most at a level of a few K (see Colafrancesco et al. 2003), and therefore it could
be, at most, a source of bias for the thermal SZE at the location of the X-ray clumps.
The SZth temperature change for the two X-ray clumps is also shown in
Fig.1.
A major difference between the SZth and SZDM spectral functions is the
different position of the zero of the SZE which is moved to higher frequencies in the
case of the DM produced electrons with respect to the case of the thermal distribution.
As a consequence, the SZDM effect appears as a negative contribution to the
overall SZE at all the frequencies which are relevant for the SZ experiments, .
2.3 Contamination, bias and confusion
Possible sources of confusion for the microwave search for DM in 1ES0657-556 are: CMB
anisotropy, emission of the IC medium, emission of galaxies and AGNs along the line of
sight, thermal and kinematic SZE from the X-ray clumps. For the estimates of the
foreground contamination we consider as peaks of the DM distribution producing SZE the
regions included in the contour of Fig.1 in Clowe et al. (2006). These are
roughly 1.3′ in diameter, and are separated by .
The measurement we propose must be carried out with an instrument with angular resolution
of 1′ FWHM, able to resolve the two SZDM peaks, and to distinguish
them from the thermal and kinematic SZE of the two X-ray clumps. Larger scales are not
significant for the measurement, and must be removed either in the measurement or in the
data analysis. This will remove most of the CMB anisotropy. In fact, integrating over the
power spectrum of CMB anisotropy best fitting current measurements (including lensing
effects), we find that an angular high-pass filter removing scales
will cut multipoles , leaving a residual rms fluctuation of primary
CMB anisotropy of 0.8 K rms. This is further reduced by the finite angular
resolution of the telescope.
In the two SZDM peaks we find 14 galaxies in the area of the East peak and 6
galaxies in the area of the West peak (see Barrena et al. 2002). To obtain an estimate of
the mm-wave emission of these galaxies, we take the mm-wave spectrum of an ”average”,
”normal” galaxy (like M99) and redshift it to z=0.3 . Then we compute the flux in the
bands centered at 90, 145, 217, 270, 345, 545 GHz and we find the total flux by
multiplying it by the number of galaxies counted in the West and East SZDM peaks. In
the West peak, we obtain a total flux of 0.2, 0.4, 1.0, 1.6, 3.4, 19 mJy, respectively,
in the bands quoted above. These signals correspond to a CMB anisotropy of 4.0, 4.8, 8.0,
13, 40, and 760 for a 1′ FWHM beam. These are comparable in size to
expected SZDM signal, at least in the 90, 145, and 217 GHz bands, but are positive
signals, while the SZDM signal is negative at the same frequencies. The same holds
for AGNs: there is only one known radio source (SUMSS J065837-555718) listed in the NED
database in the area of the East peak, and none in the area of the West peak.
This source has been observed with the MOST radio telescope, and features a power law
SED, with slope . If the same SED is used to extrapolate to the
frequencies of interest here, the total flux is safely negligible with respect to the
expected SZDM in all the bands considered here: for a 1′ FWHM beam the
signal is below 1 in the 145, 217, 270 and 345 GHz bands.
Unresolved background galaxies produce a flux with positive and negative fluctuations
with respect to the average. For a 1′ beam at 220 GHz, we get a rms signal of
, estimated using the model of Lagache et al. (2004).
The SZth emission from the IC gas is offset with respect to the DM peaks, so that
only the tail of the signal is present in the SZDM peaks.
The SZth emission is certainly affected by the complex temperature distribution of
the X-ray clumps (see Markevitch et al. 2002) producing fluctuations in the SZ maps
(since ).
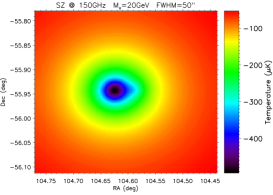
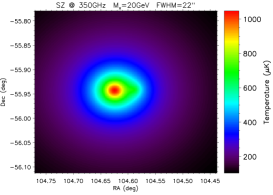
This makes the maps at low (150 GHz) and high (350 GHz) frequency shown in Fig.2 as only
indicative of the observable SZ signal.
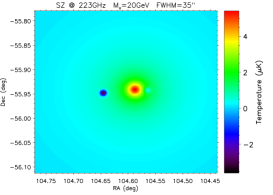
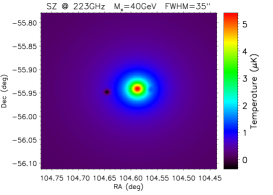
However, we stress that the SZ maps at GHz are quite realistic
because at 223 (219) GHz for the East (West) X-ray peak, the SZth is null, and
temperature uncertainties do not sensitively alter this result (see Fig.1):
this is, henceforth, the privileged band for this measurement.
The at the clump centers is and is maximum at 217 GHz. Small values of are found at the location of the two DM clumps because: i) the optical depth of
the secondary electrons is small ; ii) the optical depth of
the residual IC gas at the DM peak locations is small , and
iii) the peculiar velocity of the X-ray clumps and DM clumps along the line of sight is
relatively small (Markevitch 2004), since the major merging event occurs almost
completely on the plane of the sky, i.e. mostly perpendicular to the line of sight. Even
an extreme value km/s (well above the rms value
km/s found for galaxy clusters, see Giovanelli et al. 1998) would produce a total K ( K) in the East (West) DM clump. In conclusion,
being the two DM peaks offset with respect to the SZth peaks, the kinetic SZ effect
is at most a marginal residual signal at the location of the two DM peaks of the cluster
1ES0657.
In these conditions the detectability of SZDM is limited mainly by the fluctuations
of the unresolved galaxies background. Negative or positive fluctuations can be found at
the locations of the peaks, affecting its detection. From realistic scan
simulations at 220 GHz with a FWHM beam, we estimate that a 2-
(3-) detection has a likelihood if the in the beam is
K (K). These limits are comparable to the expected
signal estimated in Sect 2.1. Complementary observations at higher and lower
frequencies should confirm the nature of the signal, which in the case of the unresolved
galaxies increases strongly with frequency, while is basically constant for the
There are several instruments expected to provide SZ surveys from the southern hemisphere
in the near future. The 10-m South Pole Telescope (SPT, Ruhl et al. 2004) will exploit
the excellent environmental conditions of the antarctic winter to produce deep surveys of
SZ clusters at 90, 150, 220 and 270 GHz. With a FWHM of this instrument
is ideally suited to perform the DM search outlined here. The sensitivity of the SZ
survey will be for each 1′ pixel at 150 GHz: we suggest deeper
observations for 1E0657-558. A sensitivity of per 1′ pixel at
150 GHz can be obtained in 4 days of integration.
Increasing atmospheric and bolometer noise prevents reaching the same sensitivity in the
220 and 270 GHz bands (see also Gomez et al. 2003, Runyan et al. 2003 for the case of
experiments working at larger angular scales). Still, the sensitivity should be good
enough to see the two negative signals of SZDM.
Similar considerations apply to the Atacama Cosmology Telescope (Kosowsky 2003), to the
APEX bolometer arrays (Lee et al. 2004) and to the BOLOCAM instrument at the CSO (Glenn
et al. 1998).
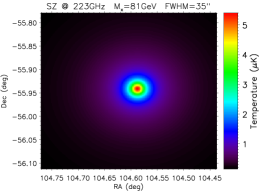
Fig.2 shows the CMB maps expected from an observation of 1ES0657-556 at
150, 223 and 350 GHz (with bandwidths of ) with the SPT. The SZDM
effect clearly emerges localized at the two DM clumps for GHz where SZth
vanishes for the brighter X-ray clump with keV. This is the optimal frequency
to detect the SZDM from the cluster 1ES0657-556 .
Such an experiment is able to set strong constraints on DM particle mass in the range
GeV, while the SZ signals for GeV is
unobservable.

Higher frequency measurements are needed to monitor foreground contamination. Observations of 1E0657-558 with the OLIMPO experiment (Masi et al. 2005), using bolometer arrays at 145, 217, 345 and 545 GHz, with beam FWHM of 3.3′, 2.2′, 2.2′, 2.2′ respectively, will be able to resolve the two SZE peaks, and will not be hampered by atmospheric fluctuations even in the highest frequency bands. In 10 hours of integration over the cluster area, the sensitivity of OLIMPO in the 217 (345) GHz band will be 1.5 (3.0) K per pixel (with a pixel side of 1′). These measurements will nicely complement those of the ground based instruments, allowing an effective separation of the different astrophysical components, with special sensitivity to the fluctuating background from unresolved galaxies. An exciting perspective is the upgrade of a space-borne telescope with a Fourier Transform Spectrometer. This can provide the combination of high throughput and spectral resolution needed to compare the SZth null to the surrounding frequencies, thus providing convincing evidence to distinguish between the different signal components (see Fig.1). A first test can be carried out already with the OLIMPO experiment, preparing the way for a future satellite mission.
3 Conclusions
The SZDM effect is an inevitable consequence of the presence and of the nature of DM
in large-scale structures. Its analysis in the special case of 1ES0657-556 can provide a direct
physical probe for the presence and for the nature of DM in cosmic structures.
How these observations compare to other possible DM signal detections?
In general, both gamma-ray and radio observations of DM annihilation are quite powerful
to set constraints on the neutralino mass and composition (see, e.g. Colafrancesco et al.
2006, 2007).
However, in the case of 1ES0657-556 the expected gamma-ray emission associated to the DM clumps
is too low ( count vs. background counts at GeV) and cannot
be resolved by GLAST from other possible sources of gamma-ray emission, both from the
cluster 1ES0657-556 and from AGNs in the field. In addition, the GLAST spatial resolution ( arcmin at 10 and 1 GeV, respectively) cannot provide any clear spatial separation
between the DM gamma-ray signals (expected to be concentrated at the DM clumps) and other
possible gamma-ray signals originating within the atmosphere of 1ES0657-556 .
Radio telescopes have, in principle, excellent resolution and sensitivity to probe the
different spectra and brightness distribution of the DM-induced synchrotron emission.
For the sake of illustration, we evaluated that the DM-induced synchrotron emission from
the East DM clump is mJy (for a smooth or smooth plus mass clumpiness
NFW DM profile, GeV, model used by Colafrancesco et al. 2006 for Coma, with a G magnetic
field) at MHz, still marginally detectable by LOFAR.
Theoretical uncertainties associated to the amplitude of the magnetic field in the DM
clumps of 1ES0657-556 render, however, the prediction of the expected signals quite uncertain.
In such a context, the possible detection of the SZDM effect will provide an
important complementary, and maybe unique, probe of the nature of DM.
Acknowledgements.
The author thanks the Referee for useful comments and suggestions.References
- (1) Barrena R. et al., 2002, A&A, 386, 816
- (2) Clowe, et al. 2006, preprint astro-ph/0608407
- (3) Colafrancesco, S. & Mele, B. 2001, ApJ, 562, 24
- (4) Colafrancesco, S. et al. 2003, A&A, 397, 27
- (5) Colafrancesco, S. 2004, A&A, 422, L23
- (6) Colafrancesco, S. Profumo, S. & Ullio, P. 2006, A&A, 455, 21
- (7) Colafrancesco, S. Profumo, S. & Ullio, P. 2007, PRD, in press
- (8) Giovanelli, R. et al. 1998, AJ, 116, 2632
- (9) Glenn J. et al. 1998, Proc. SPIE 3357, 326, Advanced Technology MMW, Radio, and Terahertz Telescopes
- (10) Gomez P., Romer A.K., Peterson J.B. 2003, astro-ph/0311263
- (11) Kosowsky, A. 2003, New Astron. Rev., 47, 939
- (12) Lagache, G., Dole, H., Puget, J.L. 2004, ApJS, 154, 112
- (13) Lee A. et al. http://bolo.berkeley.edu/apexsz/instrument.html
- (14) Liang, H. et al. 2000, ApJ, 544, 686
- (15) Markevitch, M. et al. 2002, ApJ, 567, L27
- (16) Markevitch, M. et al. 2004, ApJ, 606, 819
- (17) Masi S., Calvo M., Conversi L., et al., 2005, in Proc. of the Intern. School of Physics E. Fermi, Course CLIX, F.Melchiorri & Y.Rephaeli Eds., SIF, IOS press, p.359.
- (18) Navarro, J., Frenk, C. & White, S.D.M. 1997 ApJ, 490, 493
- (19) Petrosian, V., Madejski, G. and Luli, K. 2006, ApJ, 652, 948
- (20) Ruhl J., et al., 2004, Proc. SPIE, 5498, p. 11
- (21) Runyan M.C. et al., 2003, New Astron. Rev., 47, 915