ESC observations of SN 2005cf
II. Optical Spectroscopy
and the high velocity features.
The ESC-RTN optical spectroscopy data-set for SN 2005cf is presented and analyzed. The observations range from and days with respect to B-band maximum light. The evolution of the spectral energy distribution of SN 2005cf is characterized by the presence of high velocity Si ii and Ca ii features. SYNOW synthetic spectra are used to investigate the ejecta geometry of silicon. Based on the synthetic spectra the Si ii high velocity feature appears detached at 19500 km s-1. We also securely establish the presence of such feature in SN 1990N, SN 1994D, SN 2002er and SN 2003du. On a morphological study both the Ca ii IR Triplet and H&K absorption lines of SN 2005cf show high velocity features centered around 24000 km s-1. When compared with other Type Ia SNe based on the scheme presented in Benetti et al. (2005) SN 2005cf definitely belongs to the LVG group.
1 Introduction
Type Ia supernovae (Type Ia SNe) are the best standardizable candles currently known and have proved extremely useful for cosmological studies. In the last decade Type Ia SNe have been used to compute the energy budget of the Universe and to establish the presence of dark energy (Perlmutter et al. 1998; Garnavich et al. 1998; Schmidt et al. 1998; Riess et al. 1998; Perlmutter et al. 1999; Knop et al. 2003; Tonry et al. 2003; Riess et al. 2004; Astier et al. 2006). The observational evidence that brighter/dimmer supernovae have light curves declining slower/faster (Phillips 1993) allows their use as cosmology lighthouses. Light curve decline rate parameters (for example ) have been extensively used to divide Type Ia SNe in sub-groups. Their observed spectroscopical diversity however, can not be understood using only one parameter. Multi-parameter representations of such diversity based on the spectral morphology (Benetti et al. 2005) or on spectral modeling (Branch et al. 2006, 2005) have been proposed. These allow an overview of supernova parameter space but fail to be exhaustive. Supernova examples such as SN 1999ac (Garavini et al. 2005) or SN 2002cx (Jha et al. 2006) do not fit in the proposed classifications and require a deeper knowledge of supernova physics to be understood. Careful studies of early SN spectroscopic and polarimetric data have highlighted that the external structure of the supernova ejecta could be more complex than once believed. Three-dimensional effects such as explosion asymmetries and local density inhomogeneity could be at the origin of the non-spherically symmetric distribution of the intermediate mass elements sometimes found inspecting the data. The discovery of high velocity absorption features (HVFs) in many of the early supernova spectra recently observed (see for example Mazzali et al. (2005a)) have pushed the development of more complex fully 3-dimensional numerical simulations of supernova explosions (see for example Röpke et al. (2006)).
In this work we present and analyze the optical spectroscopy data set of SN 2005cf acquired by the European Supernova Collaboration part of the Type Ia SNe Research Training Network (ESC-RTN111http://www.mpa-garching.mpg.de/rtn/). The almost daily spectroscopic follow-up discloses the evolution of strong high velocity features both in Si ii and Ca ii absorption lines. This data set represents a unique opportunity to study the properties of high velocity features and to investigate their origin.
2 Observations and data-set
SN 2005cf was discovered in the nearby galaxy MCG-01-39-003 on a KAIT unfiltered image taken on May 2005, 28.36 UT (Puckett et al. 2005). A spectrum taken on May 31.22 UT (Modjaz et al. 2005) showed it to be a type Ia SN about ten days before maximum light. Its host galaxy recession heliocentric velocity is 1937 km s-1(source NED, de Vaucouleurs (1991)).
The ESC extensively followed SN 2005cf both photometrically and spectroscopically in the optical and in the near infrared. The photometry data set is discussed in Pastorello et al. (2007). The optical spectroscopy data set presented here covers the time interval from 11.6 days before B-band maximum light up to 77.3 days after.
All the data (except those observed with the IFU PMAS) were reduced according to the standard procedure. Using standard IRAF routines the two-dimensional images were bias-subtracted and flat-fielded.
Wavelength and flux calibration were applied to the one-dimensional optimal extracted spectra (Horne 1986) using calibration observations usually taken with the same instrumental setting and during the same night as science observations. Atmospheric extinction correction was applied via tabulated extinction coefficients for each telescope used. PMAS data were reduced using R3D222http://www.caha.es/sanchez/r3d/, a package for reducing IFS data (Sánchez 2006).
All the spectra were observed at parallactic angle. Synthetic spectrophotometry was computed to adjust the overall accuracy of the flux calibration to photometric data and no substantial flux correction was required. Pastorello et al. (2007) found that the host galaxy reddening was negligible and thus no host galaxy reddening correction was performed. According to Schlegel et al. (1998) galactic reddening in the direction of SN 2005cf is . i.e. mag.
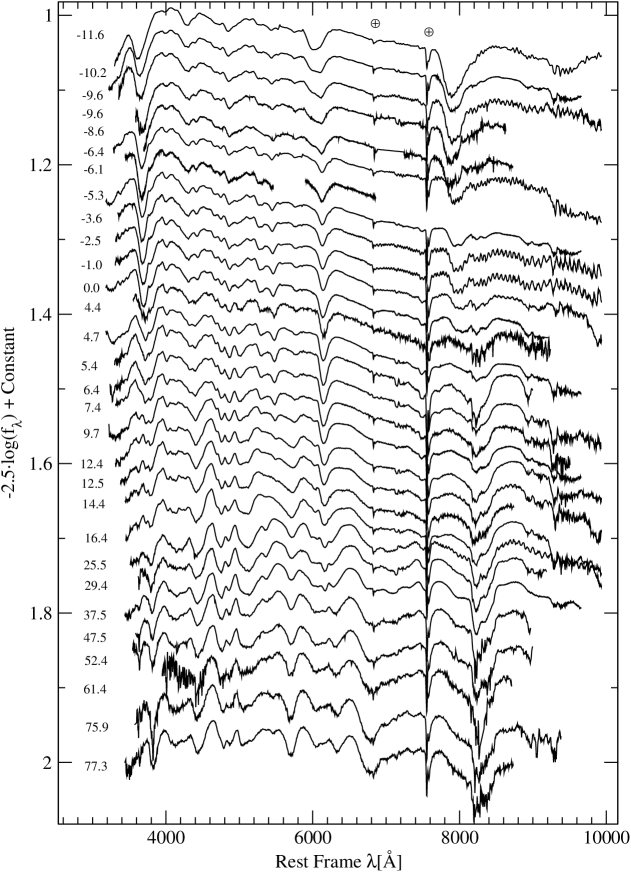
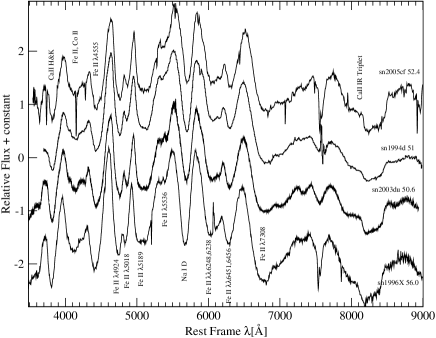
The obtained spectral time sequence is shown in Fig. 1 and the details of the data set are in Table 1.
| JD | Epoch | Telescope | Instrument | Range | Exp. Time | Airmass | Resolution |
|---|---|---|---|---|---|---|---|
| -2400000 | ref | [Å] | [sec] | [Å] | |||
| 53522.4 | -11.6 | TNG | DOLORES | 3182-9935 | 1000 | 1.3 | 10 |
| 53523.8 | -10.2 | ESO-NTT | EMMI | 3180-9658 | 1580 | 1.5 | 6 |
| 53524.4 | -9.6 | CA-3.5 | PMAS | 3587-8950 | 1380 | 1.6 | 7 |
| 53524.4 | -9.6 | NOT | ALFOSC | 3357-9933 | 900 | 1.4 | 13 |
| 53525.4 | -8.6 | CA-3.5 | PMAS | 3698-8730 | 2000 | 1.5 | 6 |
| 53527.6 | -6.4 | TNG | DOLORES | 3282-9935 | 1300 | 1.3 | 11 |
| 53527.9 | -6.1 | SSO-2.3m | DBSB | 3445-6858 | 300 | 1.5 | 5 |
| 53528.7 | -5.3 | ESO-NTT | EMMI | 3180-9658 | 600 | 1.3 | 5 |
| 53530.4 | -3.6 | NOT | ALFOSC | 3344-9934 | 900 | 1.3 | 13 |
| 53531.5 | -2.5 | NOT | ALFOSC | 3314-9936 | 900 | 1.3 | 13 |
| 53533.0 | -1.0 | NOT | ALFOSC | 3181-9936 | 900 | 1.3 | 13 |
| 53534.0 | 0.0 | SSO-2.3m | DBSB | 3181-9158 | 600 | 1.1 | 5 |
| 53538.4 | +4.4 | CA-2.2 | CAFOS | 3552-9936 | 1200 | 1.4 | 12 |
| 53538.7 | +4.7 | ESO-NTT | EMMI | 3180-9659 | 600 | 1.2 | 5 |
| 53539.4 | +5.4 | CA-2.2 | CAFOS | 3552-9936 | 1800 | 1.4 | 10 |
| 53540.4 | +6.4 | CA-2.2 | CAFOS | 3238-9932 | 1800 | 1.4 | 10 |
| 53541.4 | +7.4 | CA-2.2 | CAFOS | 3314-9932 | 1800 | 1.4 | 10 |
| 53543.7 | +9.7 | ESO-NTT | EMMI | 3215-9658 | 600 | 1.7 | 4 |
| 53546.4 | +12.4 | CA-2.2 | CAFOS | 3313-9933 | 1800 | 1.5 | 12 |
| 53546.5 | +12.5 | NOT | ALFOSC | 3380-9934 | 1200 | 1.2 | 13 |
| 53558.4 | +14.4 | CA-2.2 | CAFOS | 3454-9933 | 2400 | 1.5 | 11 |
| 53550.4 | +16.4 | CA-2.2 | CAFOS | 3454-9933 | 2400 | 1.4 | 10 |
| 53559.5 | +25.5 | NOT | ALFOSC | 3510-9936 | 1200 | 1.6 | 12 |
| 53563.4 | +29.4 | CA-2.2 | CAFOS | 3430-9935 | 1800 | 1.6 | 12 |
| 53571.5 | +37.5 | ESO-NTT | EMMI | 3180-9658 | 1650 | 1.1 | 5 |
| 53581.4 | +47.4 | CA-2.2 | CAFOS | 3587-9932 | 2700 | 1.7 | 10 |
| 53586.4 | +52.4 | CA-2.2 | CAFOS | 3545-9932 | 2700 | 2 | 10 |
| 53595.4 | +61.4 | CA-2.2 | CAFOS | 3897-8709 | 3600 | 2.2 | 12 |
| 53609.9 | +75.9 | CA-2.2 | CAFOS | 3572-9932 | 2700 | 2.2 | 12 |
| 53611.3 | +77.3 | CA-2.2 | CAFOS | 3439-8731 | 2700 | 2.6 | 13 |
3 Data analysis
3.1 Spectral Time Sequence
The ESC spectroscopically followed SN 2005cf for a period of about 3 months starting from 11.6 days before B-band maximum light. Figure 1 shows the complete time sequence. The first spectrum at day 11.6 shows deep absorptions due to Si ii , Mg ii , Fe iii , and Ca ii typical of Type Ia SNe. From a first inspection of this spectrum Si ii and Ca ii lines appear to be exceptionally broad. Si ii 6355 has a flat bottom which develops to a narrower feature by one week before maximum light. Both the IR triplet and the H&K components of Ca ii show broad absorptions evolving with time toward the appearing of an extra trough on their red side. The morphological evolution of these absorptions will be matter of analysis and discussion in the following sections.
A weak S ii ’W-shaped’ line is visible around 5500 Å. It strengthens with time and by day 16.4 has completely merged with S ii 5972 and with the strong emerging Na i line forming the characteristic wide absorption with long and straight blue edge at around 5700 Å. The Fe ii blend absorption feature profile below 5000 at day 11.6 is broad and almost featureless. On the red edge of this absorption two small notches are visible and develop into a deep trough by one week prior to maximum light. From day +25.5 on SN 2005cf enters the nebular phase and the spectra show the typical Fe ii and Co ii emission lines.
Besides the exceptionally broad Si ii and Ca ii absorption features the spectral evolution of SN 2005cf goes along the line of normal Type Ia SNe.
3.2 Type Ia SNe Spectra Comparison
The spectral time sequence of SN 2005cf (shown in Fig. 1) highlights the peculiar line profile of some absorption features which is interesting to compare to those of other normal Type Ia SNe with similar .
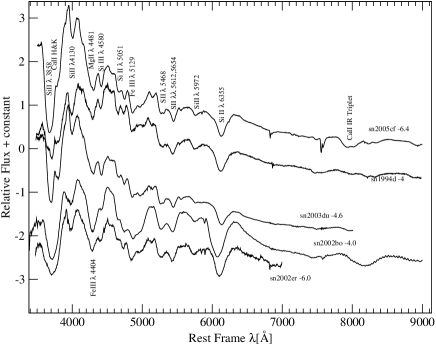
In Fig. 2 the spectrum of SN 2005cf at day 11.6 is compared with those of other Type Ia SNe at similar epochs. Early time supernova spectroscopy discloses the physical properties of the ejecta’s outermost layers where Type Ia SNe show the highest degree of heterogeneity. The spectral absorption features are those of normal Type Ia SNe before maximum light. Ca ii H&K, and Si ii 4130 absorptions have similar line profile and location as in the other shown SNe. Fe iii 4404, Mg ii 4481 and Si iii 4580 form the typical trough near 4300 Å. SN 2005cf and SN 2002bo are very similar in this region while the other shown spectra have different line profiles. SN 2003du has a shallower profile probably due to a weaker Mg ii component, SN 1990N and SN 1994D have a stronger Si iii line. In the region 4500-5200 Å SN 2005cf shows a narrower absorption than the other shown Type Ia SNe with two well distinguished minima due to Si iii 5051 and Fe iii 5129. This is due to a shallower Fe ii -blend component which in the other objects contributes to making the absorption wider. The S ii ’W’-shaped absorption and the Si ii 5972 are present in all the spectra shown in Fig. 2. The main difference in the five spectra compared are around the 6000 Å and 8000 Å regions. The Si ii 6355 of SN 2005cf appears broad and deep with a flat bottom similar to that of SN 1990N. In SN 1994D at 10 days prior to maximum light this feature is as wide but less deep and without a flat bottom. The line profile in SN 2003du is different. The minimum of the absorption feature appears to lie at longer wavelength than in SN 2005cf but the trough spans approximately the same wavelength range. The blue edge appears less steep. SN 2002er and SN 2002bo have similar line profile but different depths. The Ca ii triplet region is not covered in all the spectra shown in Fig. 2. In SN 2005cf this feature appears to be at shorter wavelength and it is deeper and wider than in SN 2003du.

In Fig. 3 the comparison between the spectrum of SN 2005cf at about 6.4 days and those of other SNe is shown. The spectrum of SN 2005cf has evolved maintaining some of the characteristics already shown in the earlier epochs. Most of the absorption features developed along the lines of normal Type Ia SNe and the spectrum now looks very similar to that of SN 2003du at about 5 days before maximum light. The main differences stand out on Si ii 6355, Ca ii H&K and IR Triplet. While Ca ii H&K on SN 2005cf has just a hint of a second minimum on the red side of the absorption SN 1994D and SN 2003du show a well developed one. SN 2002bo and SN 2002er instead, present a broad feature with a single minimum trough. The absorption feature around 6100 Å (i.e Si ii 6355) in SN 2005cf appears less deep and wide than in SN 2002bo and SN 2002er, but similar to SN 2003du. On its blue edge a small notch remains visible as residual of the blue component. The Ca ii IR Triplet in SN 2005cf now shows a weaker blue feature which developed a double-minimum line profile and a red component which is gaining strength. In comparison with the other Type Ia SNe both components appear deeper than in SN 1994D. SN 2002bo instead has a stronger blue but a weaker red component. The spectra of the other objects shown in Fig. 3 do not cover this wavelength region.
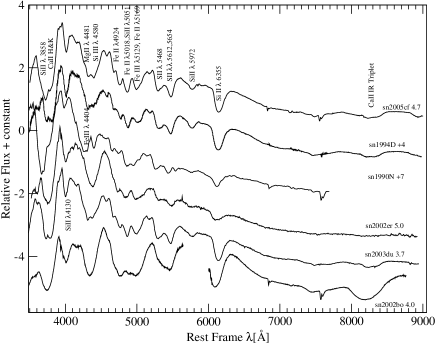
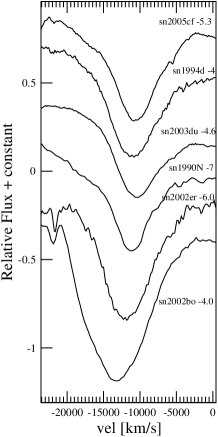
About 5 days after maximum light the spectra of SN 2005cf (shown in Fig. 4), SN 2003du and SN 1994D appear to be very similar while SN 2002bo shows wider absorption features all across the wavelength span and a deep Ca ii IR Triplet at high velocity (i.e on the blue side of the feature). SN 2003du is the closest match to SN 2005cf in this region. The absorptions on the blue edge of Si ii 6355 and in Ca ii IR Triplet have faded away in SN 2005cf.
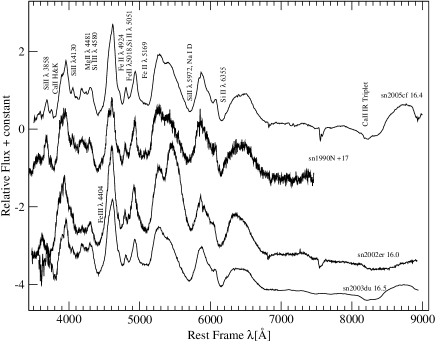
At +16.4 days after maximum light Type Ia SNe generally show a smaller degree of spectral diversity. In Fig. 5 the compared spectra appear to be all similar. Stronger Fe ii lines have appeared in the wavelength region around 5000 Å and the Na i D line now dominates over the ”W”-shaped S ii absorption. Some degree of diversity is still visible in the intensity of the Ca ii IR Triplet. SN 2005cf has a deep absorption with a pronounced emission component while SN 2002er shows a much weaker feature. SN 2002er shows also a unique emission peak at around 5500 Å.
In the early nebular phase, at about +52 days, the spectra compared in Fig. 6 look very homogeneous. All the spectra show similar line profiles and intensities in all their emission features.
3.3 Ejecta Velocity Structure
The analysis carried out in the previous sections highlights that SN 2005cf is overall a normal Type Ia SNe with two peculiarities. During the first week of our observations, Si ii 6355 appears to be broader than in most of the other Type Ia SNe. Ca ii absorption lines are also broader and shifted toward bluer wavelength. These characteristics are usually interpreted as signs of the presence of high velocity material.
3.3.1 A high velocity silicon feature?
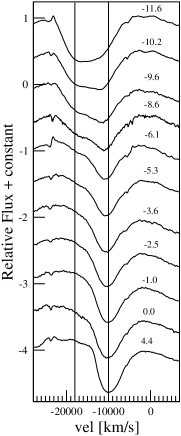
In Fig. 7 the time scan of approximately the first three weeks of spectral evolution of SN 2005cf is shown, highlighting the Doppler blueshift of Si ii 6355. At day 11.6 the line profile is wide and with a flat bottom ranging between 12000 and 18000 km s-1. As the spectra evolve the blue side of the absorption loses strength and by day the feature shows a single minimum at about 11000 km s-1. The line profile is still affected by the blue component until around maximum light when Si ii 6355 appears as a single-minimum line at 10000 km s-1with a steep blue edge.
An interpretation of the peculiar time-evolution of the line profile of Si ii 6355 can be given modeling the spectra with the use of the parametrized code for supernova synthetic spectroscopy SYNOW (Fisher 2000). SYNOW is a direct analysis code that generates spectra based on a simple, conceptual model of a SN appropriate during the first few weeks to months after explosion. This model consists of a blackbody-emitting, sharply defined photosphere surrounded by an extended line-forming, pure scattering homologously expanding atmosphere. For each ion introduced, the Sobolev optical depth as a function of velocity for a “reference line” (usually a strong optical line) is specified. Optical depths in other lines of the ion are set assuming Boltzmann excitation of the levels at temperature . The parameters and set the velocity and blackbody continuum temperature of the photosphere, respectively. For each ion, the optical depth at the minimum ejection velocity is specified. Optical depth scales exponentially with velocity according to the -folding velocity parameter , and is considered to be zero for velocity greater than . If for an ion, we refer to the ion as “detached.”
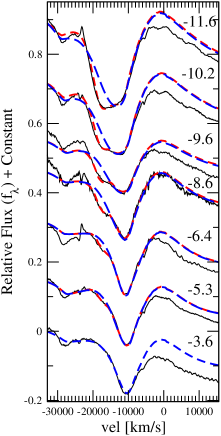
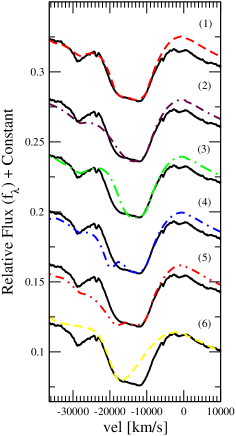
In our analysis we are interested in constraining the velocity distribution of Si ii which appears to be unusual for Type Ia SNe. The Si ii line visible at about 6150 Å is probably the only SN Ia feature unaffected by line blending. To constrain the Si ii velocity distribution within the ejecta of SN 2005cf it is thus sufficient to simulate the time evolution of only Si ii . We then used SYNOW to produce synthetic spectroscopy with only this ion. In Fig. 8 the synthetic spectra are compared with the data obtained during the first week. Short dashed red lines show the synthetic spectrum with high velocity Si ii , long dashed blue lines show the synthetic spectrum without high velocity Si ii . Table 2 reports the parameters used for the simulation. The HVF appears to be detached at about 19500 km s-1 with the optical depth decreasing with time. Fig. 8 shows that including a detached high velocity layer to match the HVF in addition to a photospheric velocity layer can accurately reproduce the time evolution of this region line profile.
We reached this conclusion by varying the key parameters through their plausible ranges. We reasoned as follows. The observed broad line profile of Si ii 6355 could be obtained by simultaneously varying the parameters , and for a single or a double component of Si ii . Figure 9 shows six of the synthetic spectra we obtained varying these parameters (and setting all the others as for the best fit, i.e. fit number 1 in Fig. 9) while looking for best match the spectrum of SN 2005cf at days.
The only way to cover the Si ii whole wavelength span with only one component (i.e. the PVC) is to increase its e-folding velocity, . Fit number in Fig. 9 shows the result of setting for the PVC. The blue steep profile and the flat bottom can not be accurately reproduce. Introducing a HVC helps in reproducing the steep blue edge and to cover the whole wavelength span. Fits number and show the effect of setting the parameter for the HVC, respectively to =17.5 and to . Varying on the HVC changes the position of the HVC minimum and the profile of its blue edge (as shown in fit number , =6.3). The best fit (fit number 1 in Fig. 9) is the result of fine tuning both and for both Si ii components (in addition to matching the optical depths ). If PVC is removed and increased to 21000 km s-1only the blue part of the line profile can be accurately reproduced (fit number ).
.
| PVF | HVF | |||||||||
| day | ||||||||||
| km | km | K | km | km | K | km | K | |||
| -11.6 | 12 | 19.5 | 5.5 | 10 | 3.8 | 19.5 | 2.5 | 10 | 2 | 11 |
| -10.2 | 11 | 19.5 | 6.2 | 10 | 3.8 | 19.5 | 1.64 | 10 | 2.2 | 11 |
| -9.6 | 10.8 | 19.5 | 5 | 10 | 3.2 | 19.5 | 1.02 | 10 | 2 | 14 |
| -8.6 | 10.8 | 19.3 | 3 | 10 | 3 | 19.3 | 0.5 | 10 | 2 | 9.5 |
| -6.4 | 11.3 | 19.5 | 3 | 10 | 2 | 19.5 | 0.22 | 10 | 1 | 9.7 |
| -5.3 | 10.5 | 19.5 | 5 | 10 | 2 | 19.5 | 0.2 | 10 | 1 | 11 |
| -3.6 | 10.5 | - | 3 | 10 | 2.15 | - | - | - | - | 11 |
The evolution of the relative strength of the two components of Si ii in SN 2005cf appears qualitatively similar to the example reported in Fig. 12 of Tanaka et al. (2006). These authors explored the effect of different photosphere covering factors due to high velocity material applyed to a spectrum at maximum light. The same evolution could be in principle due to the effect of the decreasing optical depth of a high velocity silicon blob due to the expansion of the supernova ejecta. In order to validate this hypothesis a detailed reconstruction of the three dimensional ejecta geometry of the SN 2005cf will be carried out in a forthcoming work (Mazzali et al. in preparation).
3.3.2 High velocity Si ii features in other Type Ia SNe
The presence of an HVF in the Si ii 6355 absorption line has been suggested (see for example Mazzali (2001); Mattila et al. (2005); Mazzali et al. (2005b); Stanishev et al. (2007)) but it could not yet be securely established for other nearby Type Ia SNe. As we have seen in the case of SN 2005cf a daily follow up of the pre-maximum spectra can highlight the HVF evolution making the identification possible. Inspecting publicly available early spectra of Type Ia SNe we found a variety of different Si ii 6355 line profiles. We selected the ones that deviated most from the average profile and used SYNOW to simulate their shape.
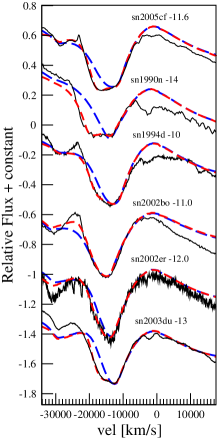
Figure 10 shows the comparison in velocity space of six Type Ia SNe at day in the wavelength region around 6100 Å together with the corresponding SYNOW fits. Short dashed red lines show the synthetic spectra with high velocity Si ii , long dashed blue lines represent the syntethic spectra without high velocity Si ii . The details of the fits are reported in Table 3.
The intensity and position of the high velocity component of Si ii varies among the different Type Ia SNe.
| PVF | HVF | ||||||||||
| SN | Day | ||||||||||
| km | km | K | km | km | K | km | K | ||||
| 1990N | -14 | 14.6 | 21.9 | 1.15 | 4 | 10 | 21.9 | 0.72 | 10 | 3 | 11.5 |
| 1994D | -11 | 12 | 20 | 7 | 8 | 3 | 20 | 1.2 | 8 | 2 | 12.5 |
| 2002bo | -11 | 15 | 24.5 | 7.5 | 10 | 3 | 24.5 | 0.3 | 10 | 1 | 7.5 |
| 2002er | -12 | 14 | 20 | 7 | 10 | 2.4 | 20 | 1.1 | 10 | 1.8 | 8 |
| 2003du | -13 | 12.8 | 20 | 10 | 10 | 2 | 20 | 2.1 | 10 | 1 | 16 |
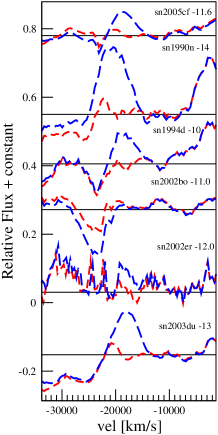
The improvement in the fit achieved introducing a Si ii layer at high velocity is evident in all the cases presented in Fig. 10 with the exception of SN 2002bo for which the contribution of the high velocity component is marginal. Therefore, we regard the presence of high velocity silicon as highly probable in these spectra. However, for a positive identification it would be ideal to densely follow the time evolution of this feature, which requires daily spectroscopic observations within the first ten days from the supernova explosion. As it is visible in Fig. 11, by one week before maximum light the optical depth of Si ii in the high velocity layer has dropped to a level which does not have an evident impact on the line profile of Si ii 6355. The degree of homogeneity in this line has greatly increased by day around . However, SN 2002bo still has a different line profile due to its overall (i.e in all its spectral features) exceptionally broad absorpsion features and SN 1990N still preserves a hint of the HVF.
3.3.3 High velocity Ca ii features
As highlighted by Mazzali et al. (2005a) the presence of high velocity features in the Ca ii IR triplet is common in many Type Ia SNe during the pre maximum light phase. In all the cases explored in Mazzali et al. (2005a) Ca ii IR triplet HVF loses strength with time and by around maximum light the absorption at 8000 is dominated by the photospheric component.
We could expect to see a similar behavior also in the H&K absorption feature. However, this wavelength region is affected by strong line blending (mainly heavy elements and Si ii ) and it is therefore more complicated to surely assess the presence of HVFs by synthetic spectroscopy.
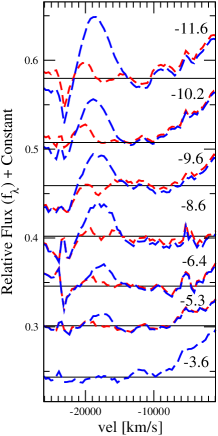
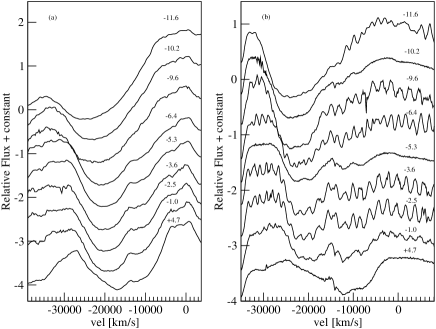
In the case of SN 2005cf a simple morphological comparison shows similarities between the two absorption features. Figure 12 (a) and (b) show the time scan of Ca ii H&K and IR Triplet respectively, between day 11.6 and day 4.7 in Doppler blue-shift velocity space.
In the first spectrum both features show high velocity minima at about 24000 km s-1. The subsequent evolution of the two wavelength regions is similar. A second minimum gradually develops at lower velocity (at about 10000 km s-1) and the corresponding absorption features strengthens with time.
By maximum light the IR triplet photospheric velocity feature reaches the same depths as the high velocity one. The same is true one week later for Ca ii H&K.
3.3.4 Si ii and Ca ii Velocity Time Evolution
The time evolution of Si ii 6355 and Ca ii H&K is interesting to look at in more detail, investigating the expansion velocity as a function of time at which these absorption features are formed.

.
Figure 13 shows the Ca ii H&K expansion velocity as a function of time with respect to the B-band maximum light for SN 2005cf and other Type Ia SNe. The plotted values marked with filled circles are the result of fitting a Gaussian profile to the whole Ca ii H&K absorption line profile. Between 6 days before and about 10 days after maximum the values measured for SN 2005cf appear higher than the average. This is due to the persistent presence of the Ca ii H&K HVF in SN 2005cf which offsets the measured velocities toward higher values. At a given phase the relative strength of the high and low velocity Ca ii H&K features for different Type Ia SNe can differ and so can its time evolution. In the case of SN 2005cf the Ca ii H&K HVF dominates the Ca ii H&K region for an unusually long period of time up to one week after maximum light and remains visible up to approximately three weeks after maximum. Therefore comparing the velocity measured by fitting the whole Ca ii H&K line profile can be difficult and only qualitative conclusions should be derived from such comparison.
In Fig. 13 the filled squares show the result of fitting the Ca ii H&K profile with a double Gaussian model identifying when possible the two visible minima. These values are however, only indicative of the position of the two Ca ii H&K components. Only an accurate synthetic spectroscopy study of the Ca ii H&K absorption feature including all the ions contributing to the region could constrain the velocity distribution of the high and low velocity component of Ca ii H&K.
Figure 14 shows the Si ii expansion velocity as a function of time since the B-band maximum light for SN 2005cf and other Type Ia SNe. The time evolution of the Si ii velocity appears to be similar to that of SN 1999ee showing values on the lower edge of normal Type Ia SNe.

.
| Epoch | Ca ii H&K | Si ii |
|---|---|---|
| days | [km s-1] | [km s-1] |
| -11.6 | 24403 | 15304 |
| -10.2 | 22920 | 14218 |
| -9.6 | – | 11339 |
| -9.6 | 22137 | 11716 |
| -8.6 | – | 11103 |
| -6.4 | 19780 | 10772 |
| -6.1 | 19400 | 10810 |
| -5.3 | 19476 | 10585 |
| -3.5 | 19476 | 10583 |
| -2.6 | 18867 | 10395 |
| -0.5 | 18183 | 10111 |
| -0. | 17499 | 10159 |
| 4.4 | 16586 | 9663 |
| 4.7 | 16130 | 9923 |
| 5.4 | 15856 | 9781 |
| 6.4 | 15902 | 9781 |
| 7.4 | 15141 | 9734 |
| 9.7 | 14229 | 9639 |
| 12.4 | 13696 | 9356 |
| 12.5 | 13316 | 9309 |
| 14.4 | 13267 | 9064 |
| 16.4 | 12708 | 9167 |
| 25.5 | 12023 | 8936 |
| 29.4 | 11187 | 8978 |
| 37.5 | 10122 | 8884 |
3.4 High Velocity Features Possible Interpretation
Garavini et al. (2004) have shown that the presence of HVFs of Ca ii , C ii and Fe ii can be reproduced via an artificial detached line strength in the framework of SYNOW. In the present work we have produced evidence that in SN 2005cf as well as in other Type Ia SNe the same is true for Si ii .
The physical interpretation of such high velocity absorption features in terms of the supernova progenitor system evolution and explosion mechanism and dynamics is still under investigation.
The additional line strength in the external layer of the ejecta can be interpreted as abundance or density enhancements. However, Mazzali et al. (2005b) have shown that it is not possible to reproduce strong HVFs just letting Si and Ca dominate the outermost layers of the supernova ejecta. Density enhancements must also be involved. Three-dimensional explosion models show that it is possible to create local density enhancements in the form of blobs of incomplete silicon burning material at high velocity (Röpke et al. 2006). This scenario is supported by the strong polarization of some of the HVFs observed in some Type Ia SNe, see for example Wang et al. (2003). Alternatively Quimby et al. (2006) and Gerardy et al. (2004) proposed that high velocity density enhancement could be the result of an interaction of the ejecta with a circumstellar shell of solar composition.
To disentangle between these different scenarios or understanding their interplay is beyond the scope of this analysis. Eventually, only daily spectropolarimetric follow up observations from the very first days of the explosion will provide the necessary data set to disclose the origin of HVFs.
3.5 Supernova Parameter Space
Type Ia supernovae are currently believed to be a multi-parameter class of objects. Several parameters have been proposed with the goal of exploring Type Ia SNe diversity. However, the exact number of parameters needed to describe the observational evidence is however not yet known.
In the following we make use of the parametrization proposed by Benetti et al. (2005) to quantitatively compare SN 2005cf with other observed Type Ia SNe.
The parameters used for such comparison are: Si ii (Nugent et al. 1995), Si ii (Branch & van den Bergh 1993), (Benetti et al. 2005) and (Phillips 1993). The measured values for SN 2005cf are reported in Table 5. The symbols used in the following figures are chosen to match those in Benetti et al. (2005) to maintain the same distinction among the three clusters found in their analysis. According to this parameterization Type Ia SNe can be divided in three groups (see Benetti et al. (2005) for details): FAINT (low luminosity and high ), HVG (high velocity gradient ) and LVG (low velocity gradient ).

In Fig. 15 the value of versus Si ii is shown in comparison to other Type Ia SNe. According to these parameters SN 2005cf could be identified belonging to both the HVG or LVG groups.

The comparison (shown in Fig. 16) between the values of the light curve decline rate and the Si ii velocity at 10 days past maximum light (i.e Si ii ) positions SN 2005cf at the lower edge of the LVG group showing a lower velocity value.

Also in the plane versus (Fig. 17) SN 2005cf belongs to LVG group showing a low velocity gradient.

In the versus Si ii plane (Fig. 18) SN 2005cf seems to belong the LVG group showing a low velocity gradient value as well as a low silicon velocity at 10 days past maximum light.
In conclusion in the classification scheme identified in Benetti et al. (2005) SN 2005cf is definitively a LVG SN Ia. The presence of the HVFs does not seem to affect the classification scheme defined in Benetti et al. (2005) since it is mostly defined trough the properties of spectra at or after maximum, when the HVFs are less important.
| RJD | 53534.0**As measure in Pastorello et al. (2007) |
|---|---|
| M | -19.39 (0.33)**As measure in Pastorello et al. (2007) |
| 1.12 (0.03)**As measure in Pastorello et al. (2007) | |
| Si ii | 0.27 (0.03) |
| Si ii | 9939 (300) |
| 35 (5) |
4 Summary and Conclusions
We have presented the optical spectroscopy of SN 2005cf. The data collected by the ESC-RTN collaboration range from to days with respect to B-band maximum light. Based on the analysis presented in this paper SN 2005cf appears to be a normal Type Ia SNe with two interesting peculiarities.
The early supernova spectra show the presence of high velocity features of both Ca ii IR Triplet and H&K detached around 24000 km s-1. The appearance of a HVF in the Ca ii IR Triplet is common to many Type Ia SNe (Mazzali et al. 2005a) but the corresponding visibility of a Ca ii H&K component at high velocity is not equally widespread.
The second rare characteristic is the clear presence of a detached layer or blob of Si ii at about 19500 km s-1. We establish the occurrence of the corresponding high velocity features by means of SYNOW synthetic spectra.
Moreover, we also securely identify the presence of such feature in SN 1990N, SN 1994D, SN 2002er and SN 2003du. This shows that the presence of high velocity Si ii features is not uncommon in early Type Ia SNespectra. However, in order to observe its time evolution, daily early time spectroscopic follow up must be acquired.
We carry out a quantitative comparison between SN 2005cf and other Type Ia SNe based on the parameterization presented by (Benetti et al. 2005). SN 2005cf appears to belong to the LVG group, showing a slow expansion velocity at 10 days after maximum light as well as a low velocity gradient.
Abundance or density enhancements, and the interaction of the expanding ejecta with a circumstellar shell with solar composition have been proposed to interpret the peculiar ejecta structure found in Type Ia SNe similar to SN 2005cf. Disentangle among these explanations will shed light on the Type Ia SNe explosion physics and will be the topic of a forthcoming work.
Acknowledgements.
This work has been partially supported by the European Union’s Human Potential Programme “The Physics of Type Ia Supernovae”, under contract HPRN-CT-2002-00303. G.G, A.G. and V.S. would also like to thank the Göran Gustafsson Foundation for financial support.This paper is based on observations collected at the Centro Astronómico Hispano Alemán (Calar Alto, Spain), Siding Spring Observatory (Australia), Telescopio Nazionale Galileo, Nordic Optical Telescope (La Palma, Spain), ESO-NTT Telescope (La Silla, Chile). We thank the support astronomers for performing the observations. We thank Thomas Augusteijn, Eija Laurikainen, Karri Muinonen and Pasi Hakala for giving up part of their time at the Nordic Optical Telescope (NOT), and Jyri Näränen, Thomas Augusteijn, Heiki Salo, Panu Muhli, Tapio Pursimo, Kalle Torstensson and Danka Parafcz for performing the observations. We are also grateful to P. Sackett for the help in observing SN 2005cf from Siding Spring.
This research has made use of the NASA/IPAC Extragalactic Database (NED) which is operated by the Jet Propulsion Laboratory, California Institute of Technology, under contract with the National Aeronautics and Space Administration. We also made use of the Lyon-Meudon Extragalactic Database (LEDA), supplied by the LEDA team at the Centre de Recherche Astronomique de Lyon, Observatoire de Lyon.
References
- Astier et al. (2006) Astier, P., Guy, J., Regnault, N., et al. 2006, A&A, 447, 31
- Benetti et al. (2005) Benetti, S., Cappellaro, E., Mazzali, P. A., et al. 2005, ApJ, 623, 1011
- Benetti et al. (2004) Benetti, S., Meikle, P., Stehle, M., et al. 2004, MNRAS, 348, 261
- Branch et al. (2005) Branch, D., Baron, E., Hall, N., Melakayil, M., & Parrent, J. 2005, PASP, 117, 545
- Branch et al. (2006) Branch, D., Dang, L. C., Hall, N., et al. 2006, PASP, 118, 560
- Branch & van den Bergh (1993) Branch, D. & van den Bergh, S. 1993, AJ, 105, 2231
- de Vaucouleurs (1991) de Vaucouleurs, G. 1991, Science, 254, 1667
- Fisher (2000) Fisher, A. K. 2000, Ph.D. Thesis
- Garavini et al. (2005) Garavini, G., Aldering, G., Amadon, A., et al. 2005, AJ, 130, 2278
- Garavini et al. (2004) Garavini, G., Folatelli, G., Goobar, A., et al. 2004, AJ, 128, 387
- Garnavich et al. (2004) Garnavich, P. M., Bonanos, A. Z., Krisciunas, K., et al. 2004, ApJ, 613, 1120
- Garnavich et al. (1998) Garnavich, P. M., Kirshner, R. P., Challis, P., et al. 1998, ApJ, 493, L53+
- Gerardy et al. (2004) Gerardy, C. L., Höflich, P., Fesen, R. A., et al. 2004, ApJ, 607, 391
- Horne (1986) Horne, K. 1986, PASP, 98, 609
- Jha et al. (2006) Jha, S., Branch, D., Chornock, R., et al. 2006, AJ, 132, 189
- Jha et al. (1999) Jha, S., Garnavich, P. M., Kirshner, R. P., et al. 1999, ApJS, 125, 73
- Kirshner et al. (1993) Kirshner, R. P., Jeffery, D. J., Leibundgut, B., et al. 1993, ApJ, 415, 589
- Knop et al. (2003) Knop, R. A., Aldering, G., Amanullah, R., et al. 2003, ApJ, 598, 102
- Kotak et al. (2005) Kotak, R., Meikle, W. P. S., Pignata, G., et al. 2005, A&A, 436, 1021
- Leibundgut et al. (1991) Leibundgut, B., Kirshner, R. P., Filippenko, A. V., et al. 1991, ApJ, 371, L23
- Li et al. (2001) Li, W., Filippenko, A. V., Gates, E., et al. 2001, PASP, 113, 1178
- Li et al. (1999) Li, W. D., Qiu, Y. L., Qiao, Q. Y., et al. 1999, AJ, 117, 2709
- Mattila et al. (2005) Mattila, S., Lundqvist, P., Sollerman, J., et al. 2005, A&A, 443, 649
- Mazzali (2001) Mazzali, P. A. 2001, MNRAS, 321, 341
- Mazzali et al. (2005a) Mazzali, P. A., Benetti, S., Altavilla, G., et al. 2005a, ApJ, 623, L37
- Mazzali et al. (2005b) Mazzali, P. A., Benetti, S., Stehle, M., et al. 2005b, MNRAS, 357, 200
- Modjaz et al. (2005) Modjaz, M., Kirshner, R., Challis, P., & Berlind, P. 2005, IAU Circ., 8534, 3
- Nugent et al. (1995) Nugent, P., Phillips, M., Baron, E., Branch, D., & Hauschildt, P. 1995, ApJ, 455, L147+
- Pastorello et al. (2007) Pastorello et al., A. 2007, accepted for publication in MNRS
- Patat et al. (1996) Patat, F., Benetti, S., Cappellaro, E., et al. 1996, MNRAS, 278, 111
- Perlmutter et al. (1998) Perlmutter, S., Aldering, G., della Valle, M., et al. 1998, Nature, 391, 51
- Perlmutter et al. (1999) Perlmutter, S., Aldering, G., Goldhaber, G., et al. 1999, ApJ, 517, 565
- Phillips (1993) Phillips, M. M. 1993, ApJ, 413, L105
- Puckett et al. (2005) Puckett, T., Langoussis, A., Chen, Y.-T., et al. 2005, IAU Circ., 8534, 1
- Quimby et al. (2006) Quimby, R., Höflich, P., Kannappan, S. J., et al. 2006, ApJ, 636, 400
- Riess et al. (1998) Riess, A. G., Filippenko, A. V., Challis, P., et al. 1998, AJ, 116, 1009
- Riess et al. (2004) Riess, A. G., Strolger, L.-G., Tonry, J., et al. 2004, ApJ, 607, 665
- Röpke et al. (2006) Röpke, F. K., Gieseler, M., Reinecke, M., Travaglio, C., & Hillebrandt, W. 2006, A&A, 453, 203
- Salvo et al. (2001) Salvo, M. E., Cappellaro, E., Mazzali, P. A., et al. 2001, MNRAS, 321, 254
- Sánchez (2006) Sánchez, S. F. 2006, Astronomische Nachrichten, 327, 850
- Schlegel et al. (1998) Schlegel, D. J., Finkbeiner, D. P., & Davis, M. 1998, ApJ, 500, 525
- Schmidt et al. (1998) Schmidt, B. P., Suntzeff, N. B., Phillips, M. M., et al. 1998, ApJ, 507, 46
- Stanishev et al. (2007) Stanishev et al. 2007, to be published
- Tanaka et al. (2006) Tanaka, M., Mazzali, P. A., Maeda, K., & Nomoto, K. 2006, ArXiv Astrophysics e-prints
- Tonry et al. (2003) Tonry, J. L., Schmidt, B. P., Barris, B., et al. 2003, ApJ, 594, 1
- Wang et al. (2003) Wang, L., Baade, D., Höflich, P., et al. 2003, ApJ, 591, 1110
- Wells et al. (1994) Wells, L. A., Phillips, M. M., Suntzeff, B., et al. 1994, AJ, 108, 2233