PEBS - Positron Electron Balloon Spectrometer
Abstract
The best measurement of the cosmic ray positron flux available today was performed by the
HEAT balloon experiment more than 10 years ago.
Given the limitations in weight and power consumption for balloon experiments, a novel approach was needed
to design a detector which could increase the existing data by more than a factor of 100.
Using silicon photomultipliers for the readout of a scintillating fiber tracker and of an imaging electromagnetic calorimeter,
the PEBS detector features a large geometrical
acceptance of for positrons,
a total weight of and a power consumption of . The experiment is
intended to measure cosmic ray particle spectra for a period of up to 20 days at an altitude of circulating the North or South Pole.
A full Geant 4 simulation of the detector concept has been developed and key elements have
been verified in a testbeam in October 2006 at CERN.
1 Introduction
Among the most intriguing open questions in modern physics is the nature of the dark matter, that has been shown to contribute around 22 % to the total energy density of the universe. Certain models, such as supersymmetric extensions to the standard model of particle physics, predict a new particle, the neutralino, which has all the properties required of a dark matter candidate. It will form halos around galaxies and annihilate pairwise into known particles. At the end of their decay chains, positrons and electrons will be produced in equal numbers. Since there is no other known primary source of positrons in the Galaxy, positrons provide an excellent probe for the indirect detection of dark matter. The observation of an excess over the expected secondary flux by the HEAT[1] and AMS-01[2] experiments has sparked some excitement but it needs to be confirmed by a precise measurement.
2 Detector description
An experiment designed to measure the positron component in the cosmic rays has to fulfill several crucial requirements:
-
•
The geometrical acceptance needs to be larger than due to the small flux of positrons.
-
•
A suppression of the predominant proton background of has to be achieved.
-
•
A good momentum resolution is necessary for charge sign determination and subsequent electron suppression.
The PEBS detector has been designed to meet these requirements. We have conducted a full simulation of the behavior of the experiment using the Geant4 package[3]. In addition, key elements have been verified in a testbeam in October 2006 at CERN.
A mechanical drawing of the PEBS detector including support structure, electronics crates and solar panels can be seen in figure 1. The apparatus has an overall height of , a length of and a width of .
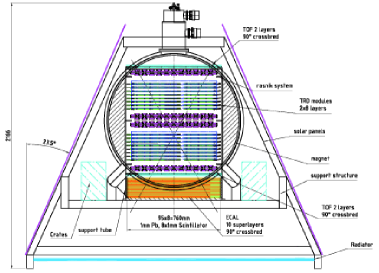
A magnetic field of mean flux density is created by two superconducting Helmholtz coils, located in a helium cryostat. The curvature of a charged particle’s trajectory in this field is measured by a scintillating fiber tracker with silicon photomultiplier readout. A transition radiation detector(TRD), located between the tracker super-layers, and an electromagnetic calorimeter at the bottom of the experiment provide rejection power against protons. The performance of these components is evaluated in this section.
Scintillator panels above and below the tracker act as a time-of-flight system (TOF) and are used for triggering purposes.
2.1 Mission parameters
Earth’s atmosphere prohibits a measurement of -range cosmic rays on the ground. As an interesting alternative to space-based measurements, a high-altitude balloon is chosen. Mission durations of around 40 days can be reached by traveling with the circular arctic winds around the North or South Pole[4].
The geometrical acceptance of the detector is limited by the weight and power constraints imposed by the carrier system. The most important contributions to the overall weight are the magnet weight and the weight of the calorimeter with and respectively. The power consumption is dominated by the needed for the tracker which has roughly 50000 individual readout channels.
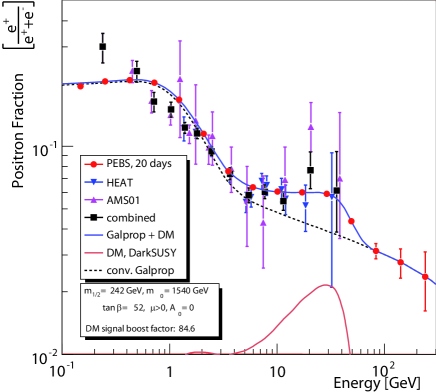
The magnet dimensions of allow for a maximum acceptance of [5]. For an overall detector length of and an effective tracker width of , an acceptance of is calculated. Figure 2 shows the statistical errors on the positron fraction achievable with the PEBS acceptance in a 20-day campaign, as compared to the currently available data.
2.2 Tracker
The tracking device will consist of scintillating fibers grouped into modules and read out by silicon photomultipliers (SiPMs). A module comprises two stacks of round fibers of diameter, 128 fibers wide and four fibers high, in the tightest arrangement. The stacks are held apart by two carbon fiber skins with Rohacell foam in between. Using scintillating fibers, the material budget in the particles’ flight path through the tracker does not exceed of a radiation length, while the TRD will contribute another . The modules will be grouped into eight layers, two of those being located at the entrance and exit of the tracking device respectively, and four in the center. In this arrangement, the uncertainty in momentum determination is minimized[7].
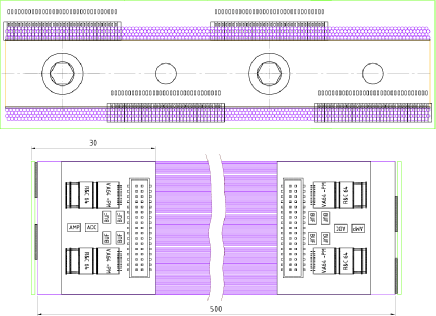
Silicon photomultipliers[8] have the virtues of being insensitive to magnetic fields, having high quantum efficiency, as well as compactness and auto-calibration. They will therefore be used to detect the photons trapped in the scintillating fibers and will be read out by a dedicated VA chip. Figure 3 illustrates the readout scheme. Arrays containing 32 silicon photomultiplier columns each are located at alternating ends of the fiber bundles. The remaining end of each fiber is covered by a reflective foil to increase the light yield by a factor of roughly . Four fibers in one column are then optically connected to one SiPM column. The weighted cluster mean from amplitudes in adjacent SiPMs columns will be calculated to pinpoint the intersection of a trajectory with a fiber module.
A prototype of the tracking device, built of two fiber bunches, each consisting of ten stacks of three square fibers of width, has been subjected to a proton testbeam at the CERN T9 beamline. The detailed analysis of the data gathered is presented elsewhere[9].
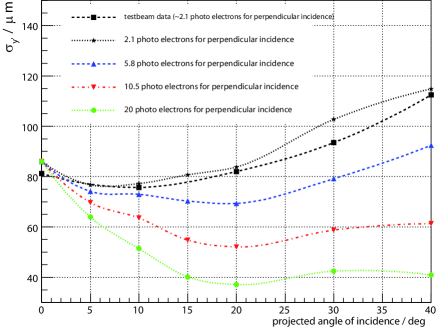
A dedicated Monte Carlo simulation, again using the Geant4 package, has been developed for comparison to and generalization of the testbeam results. A key question to be answered was the spatial resolution obtained with a fiber module as a function of the mean photo electron yield of the fiber-SiPM chain. Figure 4 shows the result. The spatial resolution is plotted for different values of and depending on the angle of incidence of a particle, projected into the bending plane of the magnet. is the resolution along the axis perpendicular to the fibers. Since the beam telescope used in the testbeam measured the coordinate perpendicular to the direction of incidence , is calculated from the measured and the positioning accuracy as follows:
| (1) |
For the photo electron yield achieved in the testbeam, a spatial resolution of is obtained at the mean projected angle of incidence, which is for the PEBS geometry.
The full PEBS detector simulation was then used to determine the momentum resolution, achievable with the tracker design for a photo electron yield corresponding to the one reached in the testbeam. Muons in the momentum range up to were simulated and the reconstructed momentum resolution was parameterized as
| (2) |
where and denote generated and reconstructed momentum respectively. In the current configuration, the simulation yields values of and .
2.3 Electromagnetic calorimeter
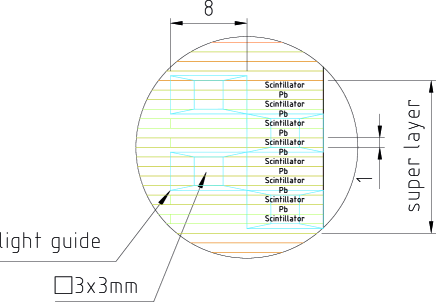
A sandwich calorimeter for three-dimensional shower reconstruction has been designed to provide rejection power against the predominant proton component in the cosmic rays. It comprises 80 layers consisting of lead interleaved with layers of scintillating bars. They are read out by SiPMs with 8100 pixels which are connected to the fibers using light-guides as sketched in figure 5. Ten layers are grouped into a super-layer and super-layers are placed with alternating direction. The total depth of the calorimeter is radiation lengths.
A preliminary cut-based analysis has been performed to study the proton rejection of this setup. For each event, a shower fit using a standard Gamma function parameterization has been performed and the following variables have been used to distinguish positrons from protons:
-
•
-matching: The fitted shower energy has to match the reconstructed momentum in the tracker.
-
•
: The fitted shower maximum must be at an appropriate depth in the calorimeter.
-
•
The ratio of shower energy within one Molière radius from the shower axis has to be characteristic for an electromagnetic shower.
-
•
The angle between the reconstructed track and shower axis must be small.
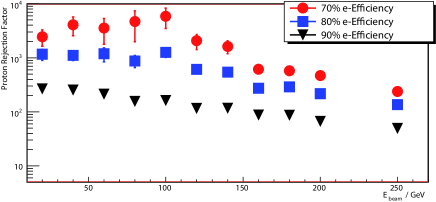
The resulting proton rejection and positron efficiencies are depicted in figure 6.
Proton rejections of the order of 5000 can easily be achieved already with this rather coarse method. The corresponding electron efficiency is around .
2.4 Transition radiation detector
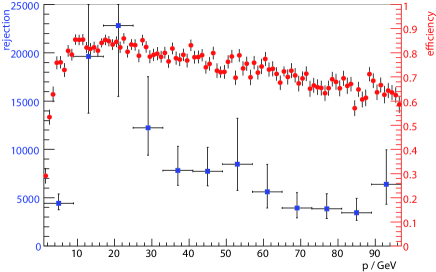
The design of the transition radiation detector is based on the one constructed for the AMS-02 experiment on the International Space Station[10]. The TR x-ray photons are generated in a thick irregular fleece radiator made of polyethylene and polypropylene. They are subsequently detected in proportional wire chambers in the form of straw tubes made of aluminized kapton foils which have an inner diameter of and are filled with an mixture of Xe/CO2. The straw tubes are grouped into modules and eight layers each are placed in the gaps above and below the central tracking layers.
Detailed performance studies using both Monte Carlo and testbeam data have been conducted. The proton rejection yielded by the TRD is depicted in figure 7. It reaches a value of 1000 at electron efficiency in the interesting energy range.
More information on the design and performance of the TRD can be found elsewhere[11].
3 Conclusion
We have presented a design study to construct a balloon-borne cosmic ray spectrometer to measure the positron fraction. Scintillating fibers with SiPM readout are used as key components for the tracker. This large high-resolution tracker inside a magnetic field of will allow a precise measurement of the positron spectrum, thus providing valuable information for the indirect search for dark matter. The necessary proton rejection of the order of can be achieved by the combination of a 3D-imaging calorimeter and a 16-layer transition radiation detector.
References
-
[1]
M. DuVernois et al., ApJ 559 (2001), 296-303
J. Beatty et al., Phys. Rev. Lett. 93 (2004), 241102 - [2] M. Aguilar et al., Phys. Lett. B (2007) in press, doi: 10.1016/j.physletb.2007.01.024
- [3] S. Agostinelli et al., NIM A 506 (2003), 250-303
- [4] E. S. Seo et al., 29th ICRC Pune (2005) 3, 101-104
- [5] J. D. Sullivan, Nucl. Inst. Meth. 95 (1971), 5-11
- [6] P. Gondolo et al., JCAP 0407 (2004) 008
- [7] R. L. Gluckstern, Nucl. Inst. Meth. 24 (1963), 381-389
-
[8]
B. Dolgoshein et al., NIM A 563 (2006), 368-376
M. McClish et al., NIM A 567 (2006), 36-40
P. Buzhan et al., NIM A 567 (2006), 353-355 - [9] G. Roper, this conference
- [10] Ph. v.Doetinchem et al., NIM A 558 (2006), 526-535
- [11] T. Kirn, this conference
-
[12]
L. Desorgher, PLANETOCOSMICS User’s Manual, Universität Bern
http://cosray.unibe.ch/laurent/planetocosmics/