ESC and KAIT Observations of the Transitional Type Ia SN 2004eo
Abstract
We present optical and infrared observations of the unusual Type Ia supernova (SN) 2004eo. The light curves and spectra closely resemble those of the prototypical SN 1992A, and the luminosity at maximum () is close to the average for a SN Ia. However, the ejected 56Ni mass derived by modelling the bolometric light curve (about 0.45 M⊙) lies near the lower limit of the 56Ni mass distribution observed in normal SNe Ia. Accordingly, SN 2004eo shows a relatively rapid post–maximum decline in the light curve (), small expansion velocities in the ejecta, and a depth ratio Si II 5972 / Si II 6355 similar to that of SN 1992A. The physical properties of SN 2004eo cause it to fall very close to the boundary between the faint, low velocity gradient, and high velocity gradient subgroups proposed by Benetti et al. (2005). Similar behaviour is seen in a few other SNe Ia. Thus, there may in fact exist a few SNe Ia with intermediate physical properties.
keywords:
supernovae: general — supernovae: individual: SN 2004eo — supernovae: individual: SN 1992A — galaxies: NGC 6928 — photometry — spectroscopy1 Introduction
Thermonuclear supernovae (SNe) are among the most important cosmological distance indicators; see Filippenko (2005) for a recent review. Consequently, over the course of the last few years, much effort has been invested in obtaining extensive datasets. The modelling of such high–quality data, particularly in three dimensions, should help improve our understanding of the thermonuclear explosion mechanisms.
This work adds to the database of observations of nearby Type Ia supernovae (SNe Ia), obtained by the European Supernova Collaboration (ESC)111http://www.mpa-garching.mpg.de/rtn/ as part of a European Research Training Network (RTN). The first supernova targeted by the collaboration was SN 2002bo [2004]. Since then, 15 other nearby SNe Ia (see Pastorello et al. 2007 and references therein) and one peculiar SN Ic (SN 2004aw, initially misclassified as a SN Ia; Taubenberger at al. [2006]) have been monitored by the ESC. In addition, three papers based on ESC data and discussing systematic properties of SNe Ia have been published. Benetti et al. [2005] found evidence that thermonuclear SNe cluster in three different subgroups on the basis of the observed spectrophotometric properties [faint, low velocity gradient (LVG), and high velocity gradient (HVG) SNe Ia]. In an effort to find clues to explain this diversity, Hachinger, Mazzali, Benetti [2006] explored the behaviour of a number of other spectroscopic parameters of SNe Ia. They found that the equivalent width ratios of some spectral lines (mainly Si II 5972 and 6355, S II, and Fe II) correlate with (as defined by Phillips 1993). Also, using the spectra of a number of SNe followed by the ESC, Mazzali et al. [2005] showed that high–velocity features, whose existence was first proposed by Hatano et al. [1999] in early–time spectra of SN 1994D, are actually a common characteristic of SNe Ia.
The discovery of SN 2004eo provided an ideal opportunity for increasing the sample of well–monitored, apparently normal SNe Ia. It fulfilled the selection criteria specified by the ESC — it was a relatively nearby ( km s-1) SN discovered well before maximum light. Moreover, because of its proximity to the celestial equator, SN 2004eo was observable from both hemispheres, allowing us to exploit all telescopes accessible to the various nodes of the collaboration. Finally, the location of SN 2004eo at the outskirts of its host galaxy allowed for accurate photometric measurements and suggested minimal internal extinction.
In this paper, we present the spectroscopic and photometric observations of SN 2004eo, ranging from 11 d before maximum light to more than one year after maximum. Most of the data have been collected by the ESC, with additional contributions (generally photometry) from the SN groups of the University of California (Berkeley) and of the Osservatorio Astronomico di Collurania (Italy).
The paper is organised as follows. In Sect. 2 we describe the observations, including instrument details and data reduction techniques. In Sect. 3 we show the optical and infrared (IR) light curves of SN 2004eo, present the colour evolution and bolometric light curve, and analyse the parameters derived from the photometry. Sect. 4 is devoted to the study of the optical and IR spectroscopic evolution of SN 2004eo. A discussion and a short summary follow in Sect. 5 and Sect. 6, respectively.
2 Observations
2.1 SN 2004eo and NGC 6928
| NGC 6928 | ||
| Galaxy type | SB(s)ab | 1 |
| (J2000.0) | 20h32m5022 | 1 |
| (J2000.0) | 1 | |
| Btot | 13.40 | 2 |
| Diameter | 1 | |
| 4707 km s-1 | 3 | |
| 4809 km s-1 | 2 | |
| ‡ | 2 | |
| SN 2004eo | ||
| (J2000.0) | 20h32m5419 | 5 |
| (J2000.0) | +095542.7 | 5 |
| Offset SN–Galaxy | 59′′.1E, 6′′.5N | 5 |
| SN Type | Ia | 6 |
| 0 | 7 | |
| 0.109 | 4 | |
| Discovery date (UT) | 2004 Sep. 17.5 | 5 |
| Discovery mag. | 17.8 | 5 |
| Predisc. limit date (UT) | 2004 Sep. 12 | 5 |
| Limit mag. | 18.5 | 5 |
| epoch (UT) | 2004 Sep. 30.7 | 7 |
| epoch (JD) | 2,453,279.2 | 7 |
| 15.51 | 7 | |
| 7 | ||
| 1.45 | 7 | |
| 1.46 | 7 | |
| 1.12 | 7 | |
| 0.49 | 7 | |
| 17.7 | 7 | |
| (M⊙) | 0.45 | 7 |
‡ computed with H0 = 72 km
s-1 Mpc-1
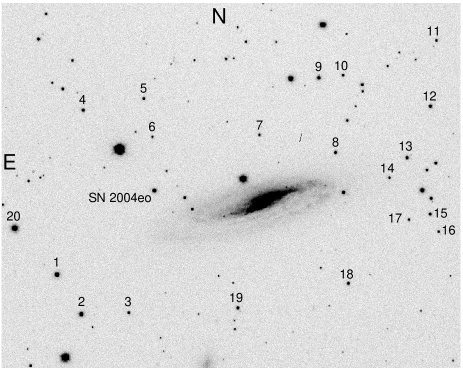
SN 2004eo was discovered by K. Itagaki [2004] on 17.5 September 2004 (UT dates are used throughout this paper) at a magnitude of 17.8. The SN coordinates are , . It lies E and N of the nucleus of the host galaxy, NGC 6928 (cf. Tab. 1). The location of the SN (Fig. 1) suggests small host-galaxy extinction. This is supported by spectroscopic evidence (see Sect. 4).
The SN 2004eo early–time spectrum is dominated by Si II and S II lines, showing that the SN was a Type Ia event [2004]. The relatively high velocities in the classification spectrum indicate that the SN was discovered soon after explosion. Indeed, the SN was not detected on 12 September (limiting magnitude 18.5), only a few days before discovery [2004]. This, together with subsequent observations, means that the light curve of SN 2004eo is one of the most complete of any known SN.
2.2 ESC and KAIT Observations
SN 2004eo was monitored extensively, especially in , , , and photometry and optical spectroscopy. Observations cover a period from about 11 d before -band maximum to about 3 months after maximum. Henceforth, we adopt as reference the epoch of the -band maximum (see below). The and IR bands were less densely sampled, with the observations only starting after maximum light. Due to the seasonal gap, the SN was not observed for three months, between about 100 and 190 d past maximum. In view of the slow evolution at late (nebular) phases, subsequent observations were less frequent than near maximum. On day +228 a high-quality nebular spectrum of SN 2004eo was obtained with the VLT. The log of all optical and IR spectra is given in Tab. 2. The photometric data are presented in Sect. 3.
During the optical monitoring of SN 2004eo, 12 different instruments were employed, as follows:
-
•
2.3-m telescope of the Siding Spring Observatory (Australia), MSSSO11 imager ( pixel-1); for spectroscopy the Double Beam Spectrograph was used ( pixel E2V CCD4210 detector in the blue arm; Site pixel detector in the red arm).
-
•
0.76-m Katzman Automatic Imaging Telescope (KAIT; Filippenko et al. 2001) of the Lick Observatory (Mt. Hamilton, California, USA) (SITe AP7 CCD, pixel-1);
-
•
Liverpool Telescope (La Palma, Canary Islands, Spain), RATCAM (optical CCD, pixel-1);
-
•
Nordic Optical Telescope (La Palma), ALFOSC (E2V pixel CCD42-40 detector, pixel-1);
-
•
1-m telescope of the Siding Spring Observatory (Australia), Wide Field Camera (Eight pixel CCDs, pixel-1);
-
•
Calar Alto 2.2-m telescope (Spain), CAFOS (Site CCD, pixel-1);
-
•
Tenagra II 0.81-m telescope (Arizona, US) (Site CCD, pixel-1);
-
•
Copernico 1.82-m telescope of Mt. Ekar (Asiago, Italy), AFOSC (TEK pixel thinned CCD, pixel-1);
-
•
ESO/MPI 2.2-m telescope (La Silla, Chile), Wide Field Imager (mosaic of eight pixel CCDs, pixel-1);
-
•
VLT-Antu telescope (Cerro Paranal, Chile), FORS1 ( pixel CCD detector, pixel-1);
-
•
Telescopio Nazionale Galileo (TNG) (La Palma), DOLORES ( pixel Loral CCD, pixel-1);
-
•
William Herschel Telescope (WHT) (La Palma), ISIS ( pixel EEV12 CCD, pixel-1 in the blue arm; pixel Marconi2 CCD, pixel-1 in the red arm); and
-
•
Shane 3-m telescope (Lick Observatory), Kast Double Spectrograph (two UV-flooded Reticon pixel devices (one per arm), pixel-1).
In addition, six different instrumental configurations were used to collect the IR data, as follows:
-
•
AZT–24 1.08-m telescope of Campo Imperatore (Italy) SWIRCAM ( pixel-1);
-
•
3.58-m Telescopio Nazionale Galileo (TNG) (La Palma), NICS (HgCdTe Hawaii pixel array, pixel-1);
-
•
Anglo–Australian Telescope (AAT) of the Siding Spring Observatory, IRIS2 ( pixel HgCd Te array, pixel-1);
-
•
WHT (La Palma), LIRIS (Hawaii pixel HgCdTe array, pixel-1);
-
•
Calar Alto 3.5-m telescope, Omega2000 ( pixel HAWAII-2 CCD, pixel-1); and
-
•
the VLT-Antu module, ISAAC ( pixel InSb Aladdin array, pixel-1).
| Date | JD– | Phase† | Instrumental | Grism or | Resolution | Exptime | Range | Standard |
| 2,400,000 | (days) | configuration | grating | (Å) | (s) | (Å) | star | |
| 19/09/04 | 53268.05 | -11.3 | SSO2.3m+DBS | B+R | 4.8,4.8 | 1200(x2)+1200(x2) | 3500–9200 | Feige110 |
| 24/09/04 | 53272.74 | -6.6 | Lick-Shane3m+Kast | ‡ | 6.2,9.6 | 1000+1000 | 3340–10700 | BD+284211,BD+174708 |
| 27/09/04 | 53276.39 | -2.9 | WHT+ISIS | R300B+R158R | 3.6,6.5 | 900(x2)+900(x2) | 3070–10670 | BD+284211 |
| 02/10/04 | 53281.45 | +2.2 | NOT+ALFOSC | gm4+5 | 21,20 | 1500+1500 | 3360–9810 | BD+284211 |
| 07/10/04 | 53286.36 | +7.1 | CAHA2.2m+CAFOS | B+R200 | 12,11 | 1800+1800 | 3180–10240 | Feige110 |
| 11/10/04 | 53290.35 | +11.1 | CAHA2.2m+CAFOS | B+R200 | 12,11 | 1800+1800 | 3500–10280 | Feige110 |
| 13/10/04 | 53291.79 | +12.5 | Lick-Shane3m+Kast | 4.9,9.6 | 1500+1500 | 3330–10400 | BD+284211,BD+174708 | |
| 14/10/04 | 53293.40 | +14.1 | CAHA2.2m+CAFOS | B+R200 | 12,11 | 1800+1800 | 3420–10300 | Feige110 |
| 21/10/04 | 53300.37 | +21.1 | NOT+ALFOSC | gm4 | 14.5 | 1200(x2) | 3290–9230 | BD+174708 |
| 22/10/04 | 53300.95 | +21.7 | SSO2.3m+DBS | B+R | 4.8,4.8 | 1200+1200 | 3390–9200 | Feige110 |
| 24/10/04 | 53302.95 | +23.7 | SSO2.3m+DBS | B+R | 4.8,4.8 | 1200(x2)+1200(x2) | 3380–9200 | Feige110 |
| 30/10/04 | 53309.38 | +30.1 | NOT+ALFOSC | gm4 | 14.5 | 1200x2 | 3460–9230 | BD+174708 |
| 15/11/04 | 53325.32 | +46.0 | CAHA2.2m+CAFOS | B200 | 12 | 2700 | 3380–8760 | Feige110 |
| 18/11/04 | 53328.32 | +49.0 | Ekar1.82m+AFOSC | gm4 | 24 | 3600 | 3710–7800 | – |
| 19/11/04 | 53329.35 | +50.1 | NOT+ALFOSC | gm4 | 14.5 | 1800 | 3480–8910 | – |
| 23/11/04 | 53333.31 | +54.0 | CAHA2.2m+CAFOS | B+R200 | 12,11 | 2700+2700 | 3170–9810 | Feige110 |
| 07/12/04 | 53347.24 | +67.9 | Ekar1.82m+AFOSC | gm4 | 24 | 3600 | 3730–7800 | BD+284211 |
| 11/12/04 | 53351.37 | +72.1 | NOT+ALFOSC | gm4 | 19 | 3600 | 3440–8900 | BD+174708 |
| 16/05/05 | 53506.89 | +227.6 | VLT-UT2+FORS1 | 300V+GG375 | 11.5 | 2280+2280 | 3630–8900 | LTT7987 |
| Date | MJD | Phase | Instrumental | Grism or | Resolution | DITxNDITxN(ABBA) | Range | Standard |
| (days) | configuration | grating | (Å) | Tot. exptime (s) | (Å) | star | ||
| 02/10/04 | 53280.91 | +2.1 | TNG+NICS | Amici prism | – | 2400 | 7500–25000 | BD+472802 |
| 22/10/04 | 53300.45 | +21.7 | AAT+IRIS2 | gmJs+Hs+K | – | 1440+1440+1440 | 10430–24800 | BS7793 |
| 05/11/04 | 53314.84 | +36.0 | WHT+LIRIS | gmzJ+HK | – | 2400+960 | 8900–23950 | HD194012 |
† The phase is with respect to the B-band maximum (JD=2,453,279.2); ‡ Grt300/7500+Gm600/4310
The use of a large number of different instruments required careful homogenisation of our dataset. This is discussed in Sect. 3
2.3 Data Reduction
All optical photometric images were pre–reduced (i.e., overscan, bias, flatfield corrected, and trimmed) using standard IRAF444IRAF is distributed by the National Optical Astronomy Observatories, which are operated by the Association of Universities for Research in Astronomy, Inc, under contract to the National Science Foundation. procedures. Because of the high brightness of the night sky in the IR, both imaging and spectroscopy required some additional data processing, including the creation of clean sky images and their subtraction from the target frames. Finally, the resulting images were spatially registered and combined in order to improve the signal–to–noise ratio (S/N).
The SN lies in a region only marginally contaminated by the host-galaxy light, as well as being clear of stars in the field. Consequently, point–spread function (PSF) fitting is well suited to provide excellent estimates of the SN magnitudes. A detailed description of the photometric data reduction techniques can be found in Pastorello et al. [2007]. The PSF measurements were performed using SNOoPY555SNOoPY, originally presented in Patat [1996], has been implemented in IRAF by E. Cappellaro. The package is based on DAOPHOT, but optimised for SN magnitude measurements.. The SN magnitudes were then measured with reference to a local sequence of 20 stars in the field of NGC 6928 (Fig. 1). These, in turn, were calibrated by comparison with photometric standard stars from the Landolt [1992] catalogue. The , , , , and magnitudes of the local sequence stars, obtained averaging the measurements of 20 photometric nights, are in Tab. 3.
The IR photometry was calibrated using 2MASS magnitudes for a number of local standards in the field of NGC 6928, together with additional calibrations from standard fields [1998] observed on the same nights as the SN. The magnitudes of NICS and Omega2000 were converted to magnitudes using the relations derived by Wainscoat Cowie [1992].
The first steps of the spectroscopic data reduction (overscan and bias corrections, flatfielding, and trimming) are the same as for the photometry. For the IR spectroscopy, the contribution of the night sky was subtracted from the 2D IR spectrum using as reference a spectrum from a different position along the slit. Further data processing was performed using standard IRAF procedures, in particular some tasks from the package CTIOSLIT. After the optimised extraction performed with the task APALL, the 1D spectra were wavelength–calibrated by comparison with spectra of arc lamps obtained during the same night and with the same instrumental configuration. In addition, the wavelength calibration was checked against bright night–sky emission lines.
The SN spectra were then flux–calibrated using response curves derived from the spectra of standard stars [1994, 1988] possibly observed during the same night. The spectra of the standard stars were also used to remove telluric features. The flux calibration of the spectra was finally checked against the photometry and, in case of discrepancy, the spectral fluxes were rescaled to match the photometry. This step is particularly important for the IR spectra, where flux tables for spectroscopic standard stars are usually not available. The typical deviation from the photometric values was less than 10 (but it can be up to 20 in the IR spectra).
| ID star | |||||
|---|---|---|---|---|---|
| 1 | 16.506 (0.011) | 16.505 (0.007) | 15.873 (0.006) | 15.472 (0.007) | 15.132 (0.008) |
| 2 | 16.907 (0.006) | 16.729 (0.016) | 16.051 (0.005) | 15.624 (0.005) | 15.266 (0.006) |
| 3 | 18.903 (0.018) | 18.491 (0.008) | 17.690 (0.007) | 17.197 (0.008) | 16.770 (0.008) |
| 4 | 18.244 (0.019) | 18.009 (0.008) | 17.283 (0.009) | 16.829 (0.008) | 16.437 (0.011) |
| 5 | 18.751 (0.009) | 18.581 (0.007) | 17.877 (0.007) | 17.433 (0.010) | 17.056 (0.011) |
| 6 | 18.812 (0.018) | 18.998 (0.016) | 18.473 (0.009) | 18.061 (0.011) | 17.716 (0.010) |
| 7 | 18.899 (0.016) | 18.647 (0.010) | 17.957 (0.011) | 17.513 (0.012) | 17.150 (0.010) |
| 8 | 18.885 (0.008) | 18.278 (0.016) | 17.427 (0.012) | 16.840 (0.010) | 16.349 (0.009) |
| 9 | 18.896 (0.016) | 17.720 (0.010) | 16.622 (0.009) | 15.918 (0.010) | 15.312 (0.008) |
| 10 | 18.828 (0.021) | 18.637 (0.007) | 17.920 (0.011) | 17.501 (0.013) | 17.103 (0.011) |
| 11 | 18.663 (0.025) | 18.734 (0.017) | 18.038 (0.009) | 17.682 (0.015) | 17.340 (0.017) |
| 12 | 17.907 (0.013) | 17.819 (0.012) | 17.095 (0.011) | 16.684 (0.012) | 16.301 (0.010) |
| 13 | 18.809 (0.030) | 18.115 (0.011) | 17.196 (0.010) | 16.695 (0.011) | 16.236 (0.011) |
| 14 | 19.410 (0.029) | 19.096 (0.012) | 18.311 (0.008) | 17.800 (0.014) | 17.373 (0.011) |
| 15 | 18.232 (0.013) | 18.274 (0.006) | 17.650 (0.011) | 17.235 (0.014) | 16.829 (0.012) |
| 16 | 19.666 (0.035) | 19.591 (0.020) | 18.802 (0.012) | 18.334 (0.014) | 17.916 (0.016) |
| 17 | 19.757 (0.022) | 19.241 (0.016) | 18.348 (0.012) | 17.780 (0.013) | 17.289 (0.009) |
| 18 | 18.618 (0.008) | 18.350 (0.007) | 17.562 (0.011) | 17.101 (0.011) | 16.684 (0.008) |
| 19 | 18.408 (0.019) | 18.248 (0.009) | 17.553 (0.008) | 17.084 (0.009) | 16.699 (0.007) |
| 20 | 15.597 (0.014) | 15.562 (0.007) | 14.923 (0.005) | 14.544 (0.005) | 14.215 (0.010) |
3 Photometry
3.1 S–Correction
Owing to the large number of different instruments used during the optical follow–up observations of SN 2004eo, it was prudent to reduce the photometry to a standard system applying a well-tested procedure called “S–correction,” a technique which has already been applied to a number of SNe Ia (see, e.g., Stritzinger et al. [2002], Pignata et al. [2004], Krisciunas et al [2003, 2004], Elias–Rosa et al. [2006], Pastorello et al. [2007], Stanishev et al. [2007]).
Actually, despite the large number of instrumental configurations used, the , , photometry of SN 2004eo appeared to be fairly homogeneous even without S–correction. In contrast, the original -band and, in particular, -band light curves show large scatter owing to differences in the filter transmission curves between the various instruments, especially for data obtained with CAFOS and ALFOSC. For details of the filter transmission curves, see Pastorello et al. [2007] and Li et al. [2001].
Application of the S–correction to the and -band data reduced significantly the scatter in the light curves. Only S–corrected , , , and light curves are considered in our analysis. However, for the and IR , , and bands, S–corrections were not feasible because of the incomplete spectroscopic wavelength coverage and/or sparse temporal sampling. The original optical magnitudes of SN 2004eo are listed in Tab. LABEL:opt_photometry, while the S–corrections applied to the , , , and magnitudes of Tab. LABEL:opt_photometry are in Tab. LABEL:S_corr.
3.2 K–Correction
The redshift of the host galaxy of SN 2004eo, , is sufficiently large to produce a significant effect on the observed magnitudes. In order to compare the intrinsic luminosities and colours of different SNe Ia, it is necessary to correct the photometry to the rest frame. This can be done comparing the fluxes of unredshifted and redshifted spectra of the same event through standard spectral bandpasses. In the literature this technique is usually referred to as “K correction,” and detailed descriptions of the application to SNe Ia can be found in Leibundgut [1990], Hamuy et al. [1993], Kim et al. [1996], and Nugent et al. [2002].
| Date | JD–2,400,000 | Instrument | |||||
| 19/09/04 | 53268.07 | 16.751 (0.010) | 16.484 (0.013) | 0 | |||
| 20/09/04 | 53268.76 | 16.689 (0.021) | 16.485 (0.023) | 16.238 (0.033) | 16.226 (0.037) | 1 | |
| 21/09/04 | 53269.68 | 16.447 (0.012) | 16.282 (0.010) | 16.025 (0.013) | 16.034 (0.013) | 1 | |
| 21/09/04 | 53270.33 | 16.309 (0.016) | 16.133 (0.015) | 15.978 (0.012) | 15.833 (0.024) | 2 | |
| 22/09/04 | 53270.52 | 16.286 (0.014) | 16.141 (0.010) | 15.902 (0.014) | 15.839 (0.010) | 2 | |
| 22/09/04 | 53270.67 | 16.188 (0.042) | 16.050 (0.016) | 15.807 (0.016) | 15.825 (0.020) | 1 | |
| 23/09/04 | 53271.69 | 16.029 (0.014) | 15.897 (0.012) | 15.621 (0.014) | 15.676 (0.016) | 1 | |
| 23/09/04 | 53272.36 | 15.966 (0.013) | 15.858 (0.009) | 15.556 (0.013) | 15.549 (0.011) | 2 | |
| 25/09/04 | 53273.66 | 15.759 (0.016) | 15.625 (0.018) | 15.392 (0.018) | 15.465 (0.031) | 1 | |
| 26/09/04 | 53274.69 | 15.662 (0.018) | 15.532 (0.016) | 15.272 (0.019) | 15.384 (0.032) | 1 | |
| 26/09/04 | 53275.37 | 15.616 (0.012) | 15.552 (0.011) | 15.301 (0.014) | 15.402 (0.011) | 2 | |
| 27/09/04 | 53275.70 | 15.597 (0.019) | 15.451 (0.012) | 15.237 (0.015) | 15.398 (0.017) | 1 | |
| 27/09/04 | 53276.33 | 15.588 (0.013) | 15.476 (0.010) | 15.264 (0.013) | 15.403 (0.010) | 2 | |
| 28/09/04 | 53276.70 | 15.536 (0.024) | 15.426 (0.014) | 15.179 (0.014) | 15.383 (0.019) | 1 | |
| 28/09/04 | 53277.37 | 15.514 (0.015) | 15.445 (0.009) | 15.198 (0.017) | 15.424 (0.009) | 2 | |
| 29/09/04 | 53277.70 | 15.519 (0.015) | 15.370 (0.015) | 15.185 (0.010) | 15.398 (0.017) | 1 | |
| 29/09/04 | 53278.36 | 15.534 (0.012) | 15.453 (0.010) | 15.193 (0.012) | 15.430 (0.010) | 2 | |
| 30/09/04 | 53278.71 | 15.504 (0.017) | 15.351 (0.020) | 15.160 (0.013) | 15.426 (0.012) | 1 | |
| 01/10/04 | 53279.66 | 15.506 (0.021) | 15.339 (0.014) | 15.167 (0.014) | 15.473 (0.015) | 1 | |
| 02/10/04 | 53280.69 | 15.545 (0.015) | 15.329 (0.014) | 15.147 (0.025) | 15.492 (0.020) | 1 | |
| 02/10/04 | 53281.37 | 15.387 (0.010) | 3 | ||||
| 02/10/04 | 53281.38 | 15.425 (0.018) | 15.385 (0.008) | 15.217 (0.010) | 15.613 (0.009) | 3 | |
| 02/10/04 | 53281.39 | 15.439 (0.018) | 15.569 (0.010) | 15.391 (0.009) | 15.205 (0.012) | 15.617 (0.012) | 3 |
| 03/10/04 | 53281.63 | 15.594 (0.018) | 15.338 (0.012) | 15.171 (0.016) | 15.534 (0.021) | 1 | |
| 03/10/04 | 53282.43 | 15.624 (0.011) | 15.358 (0.013) | 15.145 (0.013) | 15.587 (0.009) | 2 | |
| 04/10/04 | 53282.68 | 15.634 (0.055) | 15.337 (0.012) | 15.160 (0.015) | 15.527 (0.011) | 1 | |
| 04/10/04 | 53282.98 | 15.663 (0.019) | 15.404 (0.013) | 15.222 (0.015) | 15.509 (0.035) | 4 | |
| 05/10/04 | 53283.66 | 15.712 (0.011) | 15.386 (0.009) | 15.204 (0.011) | 15.569 (0.016) | 1 | |
| 05/10/04 | 53283.94 | 15.721 (0.011) | 15.421 (0.009) | 15.273 (0.011) | 15.565 (0.011) | 4 | |
| 05/10/04 | 53284.36 | 15.780 (0.018) | 15.224 (0.013) | 15.626 (0.018) | 2 | ||
| 05/10/04 | 53284.39 | 15.777 (0.011) | 15.434 (0.009) | 15.211 (0.010) | 15.653 (0.009) | 2 | |
| 06/10/04 | 53285.33 | 15.895 (0.011) | 15.473 (0.010) | 15.267 (0.013) | 15.722 (0.012) | 2 | |
| 06/10/04 | 53285.34 | 15.512 (0.130) | 5‡ | ||||
| 07/10/04 | 53286.30 | 15.946 (0.018) | 15.925 (0.011) | 15.490 (0.009) | 15.420 (0.014) | 15.570 (0.013) | 6 |
| 10/10/04 | 53288.63 | 16.182 (0.013) | 15.577 (0.013) | 15.459 (0.020) | 15.766 (0.035) | 1 | |
| 10/10/04 | 53288.92 | 16.243 (0.016) | 15.675 (0.009) | 15.777 (0.012) | 4 | ||
| 11/10/04 | 53290.30 | 16.492 (0.018) | 16.492 (0.016) | 15.726 (0.047) | 15.677 (0.038) | 15.648 (0.022) | 6 |
| 12/10/04 | 53290.63 | 16.446 (0.012) | 15.747 (0.013) | 15.611 (0.012) | 15.825 (0.011) | 1 | |
| 12/10/04 | 53290.92 | 16.509 (0.011) | 15.804 (0.011) | 15.811 (0.011) | 4 | ||
| 14/10/04 | 53292.63 | 16.738 (0.015) | 15.902 (0.013) | 15.702 (0.011) | 15.817 (0.016) | 1 | |
| 14/10/04 | 53293.42 | 17.282 (0.019) | 16.906 (0.016) | 15.959 (0.011) | 15.832 (0.022) | 15.683 (0.013) | 6 |
| 15/10/04 | 53294.42 | 16.962 (0.011) | 16.036 (0.013) | 15.665 (0.011) | 15.919 (0.011) | 2 | |
| 16/10/04 | 53294.62 | 16.961 (0.027) | 16.057 (0.014) | 15.782 (0.015) | 15.766 (0.015) | 1 | |
| 20/10/04 | 53298.61 | 18.125 (0.074) | 17.488 (0.029) | 16.334 (0.014) | 15.826 (0.017) | 15.768 (0.016) | 7 |
| 21/10/04 | 53299.63 | 17.563 (0.235) | 1 | ||||
| 21/10/04 | 53300.32 | 18.092 (0.021) | 17.529 (0.011) | 16.406 (0.011) | 15.984 (0.013) | 15.853 (0.011) | 3 |
| 22/10/04 | 53300.90 | 16.525 (0.008) | 0 | ||||
| 22/10/04 | 53300.92 | 18.165 (0.068) | 17.681 (0.014) | 16.530 (0.009) | 16.040 (0.011) | 15.827 (0.016) | 0 |
| 22/10/04 | 53301.37 | 17.710 (0.041) | 16.511 (0.024) | 15.936 (0.012) | 15.907 (0.015) | 2 | |
| 23/10/04 | 53301.60 | 17.681 (0.070) | 16.522 (0.022) | 16.031 (0.031) | 15.785 (0.035) | 1 | |
| 24/10/04 | 53302.90 | 17.869 (0.031) | 16.654 (0.025) | 16.102 (0.067) | 15.782 (0.088) | 0 | |
| 25/10/04 | 53303.64 | 17.912 (0.066) | 16.675 (0.022) | 16.090 (0.016) | 15.766 (0.026) | 1 | |
| 25/10/04 | 53303.96 | 17.917 (0.041) | 16.689 (0.022) | 16.176 (0.015) | 15.846 (0.013) | 4 | |
| 28/10/04 | 53306.92 | 18.159 (0.072) | 4 | ||||
| 28/10/04 | 53306.94 | 18.145 (0.059) | 16.918 (0.018) | 16.392 (0.021) | 16.001 (0.013) | 4 | |
| 29/10/04 | 53307.93 | 18.224 (0.096) | 16.973 (0.024) | 16.447 (0.031) | 16.042 (0.018) | 4 | |
| 29/10/04 | 53307.95 | 18.240 (0.105) | 4 | ||||
| Date | JD–2,400,000 | Instrument | |||||
| 30/10/04 | 53308.61 | 18.200 (0.032) | 16.977 (0.018) | 16.415 (0.016) | 16.092 (0.017) | 1 | |
| 30/10/04 | 53309.33 | 18.623 (0.023) | 18.308 (0.011) | 17.012 (0.009) | 16.548 (0.010) | 16.228 (0.011) | 3 |
| 31/10/04 | 53309.90 | 17.091 (0.050) | 4 | ||||
| 31/10/04 | 53309.91 | 17.104 (0.017) | 16.616 (0.026) | 4 | |||
| 01/11/04 | 53310.60 | 18.218 (0.023) | 17.127 (0.017) | 16.601 (0.019) | 16.207 (0.030) | 1 | |
| 02/11/04 | 53311.59 | 18.328 (0.110) | 17.115 (0.060) | 16.694 (0.044) | 16.259 (0.115) | 7 | |
| 03/11/04 | 53312.60 | 18.327 (0.025) | 17.194 (0.047) | 16.722 (0.021) | 16.316 (0.034) | 1 | |
| 05/11/04 | 53314.59 | 18.544 (0.029) | 17.256 (0.015) | 16.876 (0.059) | 16.507 (0.028) | 7 | |
| 07/11/04 | 53316.60 | 18.608 (0.060) | 17.411 (0.028) | 16.965 (0.026) | 16.603 (0.028) | 1 | |
| 08/11/04 | 53318.33 | 18.649 (0.070) | 17.455 (0.029) | 17.024 (0.036) | 16.651 (0.035) | 8 | |
| 11/11/04 | 53320.58 | 17.497 (0.020) | 17.095 (0.021) | 16.935 (0.042) | 7 | ||
| 12/11/04 | 53322.36 | 18.729 (0.210) | 2 | ||||
| 15/11/04 | 53325.27 | 18.810 (0.050) | 17.659 (0.019) | 17.243 (0.016) | 17.005 (0.033) | 6 | |
| 15/11/04 | 53325.32 | 18.813 (0.048) | 2 | ||||
| 16/11/04 | 53326.21 | 17.656 (0.029) | 8 | ||||
| 16/11/04 | 53326.23 | 18.778 (0.054) | 17.676 (0.045) | 17.320 (0.050) | 16.972 (0.110) | 8 | |
| 17/11/04 | 53327.24 | 18.786 (0.240) | 17.732 (0.045) | 17.375 (0.017) | 17.072 (0.016) | 8 | |
| 18/11/04 | 53328.32 | 17.738 (0.135) | 17.364 (0.155) | 8 | |||
| 19/11/04 | 53328.59 | 18.794 (0.100) | 17.740 (0.050) | 17.341 (0.020) | 17.145 (0.036) | 1 | |
| 19/11/04 | 53329.31 | 18.814 (0.240) | 17.766 (0.220) | 8 | |||
| 19/11/04 | 53329.32 | 17.775 (0.105) | 17.363 (0.130) | 17.217 (0.130) | 8 | ||
| 22/11/04 | 53331.59 | 18.809 (0.500) | 17.826 (0.300) | 17.370 (0.220) | 17.263 (0.180) | 1 | |
| 25/11/04 | 53334.53 | 19.109 (0.260) | 18.833 (0.275) | 9 | |||
| 25/11/04 | 53334.59 | 18.812 (0.215) | 17.889 (0.065) | 17.505 (0.070) | 17.309 (0.200) | 1 | |
| 25/11/04 | 53335.27 | 19.130 (0.043) | 18.913 (0.017) | 17.943 (0.016) | 17.560 (0.013) | 17.452 (0.022) | 6 |
| 28/11/04 | 53337.59 | 18.944 (0.082) | 17.946 (0.027) | 17.666 (0.024) | 17.540 (0.037) | 1 | |
| 30/11/04 | 53339.58 | 18.987 (0.145) | 18.014 (0.031) | 17.653 (0.054) | 17.673 (0.130) | 7 | |
| 01/12/04 | 53340.56 | 18.023 (0.046) | 7 | ||||
| 06/12/04 | 53346.32 | 18.117 (0.023) | 17.937 (0.014) | 17.793 (0.040) | 8 | ||
| 07/12/04 | 53347.24 | 18.184 (0.016) | 8 | ||||
| 10/12/04 | 53350.19 | 18.264 (0.057) | 8 | ||||
| 10/12/04 | 53350.20 | 19.133 (0.048) | 18.272 (0.023) | 18.064 (0.032) | 18.014 (0.033) | 8 | |
| 13/12/04 | 53353.20 | 19.239 (0.080) | 18.369 (0.014) | 18.156 (0.017) | 18.087 (0.018) | 8 | |
| 14/12/04 | 53353.59 | 19.238 (0.280) | 18.359 (0.080) | 18.161 (0.125) | 18.086 (0.215) | 1 | |
| 04/01/05 | 53375.22 | 18.717 (0.550) | 8 | ||||
| 09/04/05 | 53469.89 | 22.181 (0.210) | 9 | ||||
| 15/04/05 | 53475.88 | 20.702 (0.025) | 21.207 (0.048) | 20.914 (0.135) | 9 | ||
| 18/04/05 | 53478.89 | 20.478 (0.018) | 9 | ||||
| 12/05/05 | 53502.90 | 21.354 (0.013) | 9 | ||||
| 13/05/05 | 53503.91 | 21.662 (0.014) | 21.340 (0.011) | 21.730 (0.018) | 21.063 (0.023) | 10 | |
| 14/05/05 | 53504.65 | 21.688 (0.300) | 21.354 (0.460) | 21.60 | 21.16 | 6 | |
| 16/05/05 | 53506.64 | 21.543 (0.050) | 21.335 (0.060) | 22.011 (0.087) | 21.448 (0.285) | 6 | |
| 29/06/05 | 53551.49 | 22.260 (0.100) | 21.957 (0.092) | 22.619 (0.135) | 22.009 (0.197) | 6 | |
| 02/08/05 | 53584.52 | 24.24 | 22.793 (0.190) | 22.368 (0.044) | 23.219 (0.120) | 22.518 (0.180) | 11 |
| 10/08/05 | 53592.69 | 22.842 (0.093) | 22.582 (0.124) | 23.23 | 22.14 | 9 | |
| 23/08/05 | 53605.53 | 23.337 (0.059) | 10 | ||||
| 11/09/05 | 53624.55 | 23.521 (0.045) | 23.217 (0.044) | 23.633 (0.080) | 22.578 (0.075) | 10 |
0 = SSO2.3-m + imager, 1 = KAIT + CCD, 2 = LT, 3 = NOT+ALFOSC, 4 = SSO1-m + WFI, 5 = Nw41-cm + CCD, 6 = CAHA2.2-m + CAFOS, 7 = Ten0.81-m + CCD, 8 = Ekar1.82-m + AFOSC, 9 = ESO/MPI2.2-m + WFI, 10 = VLT-Antu + FORS1, 11 = TNG + DOLORES
‡ This -band observation was kindly provided by M. Fiaschi, and obtained using the 0.41-m Newton/Cassegrain Telescope of the Gruppo Astrofili di Padova, Italy, equipped with a pixel E2V CCD.
| Date | JD–2,400,000 | Instrument | ||||
| 19/09/04 | 53268.07 | 0.005 | -0.004 | 0 | ||
| 20/09/04 | 53268.76 | -0.015 | 0 | 0.006 | -0.001 | 1 |
| 21/09/04 | 53269.68 | -0.014 | 0 | 0.006 | -0.002 | 1 |
| 21/09/04 | 53270.33 | -0.006 | -0.014 | 0.017 | -0.035 | 2 |
| 22/09/04 | 53270.52 | -0.006 | -0.014 | 0.017 | -0.036 | 2 |
| 22/09/04 | 53270.67 | -0.013 | 0 | 0.006 | -0.004 | 1 |
| 23/09/04 | 53271.69 | -0.012 | 0 | 0.007 | -0.005 | 1 |
| 23/09/04 | 53272.36 | -0.007 | -0.015 | 0.019 | -0.044 | 2 |
| 25/09/04 | 53273.66 | -0.011 | -0.001 | 0.008 | -0.008 | 1 |
| 26/09/04 | 53274.69 | -0.011 | -0.001 | 0.008 | -0.009 | 1 |
| 26/09/04 | 53275.37 | -0.007 | -0.017 | 0.024 | -0.059 | 2 |
| 27/09/04 | 53275.70 | -0.010 | -0.002 | 0.008 | -0.011 | 1 |
| 27/09/04 | 53276.33 | -0.006 | -0.018 | 0.025 | -0.062 | 2 |
| 28/09/04 | 53276.70 | -0.010 | -0.002 | 0.008 | -0.012 | 1 |
| 28/09/04 | 53277.37 | -0.006 | -0.018 | 0.026 | -0.067 | 2 |
| 29/09/04 | 53277.70 | -0.009 | -0.002 | 0.008 | -0.013 | 1 |
| 29/09/04 | 53278.36 | -0.005 | -0.018 | 0.027 | -0.072 | 2 |
| 30/09/04 | 53278.71 | -0.008 | -0.003 | 0.009 | -0.014 | 1 |
| 01/10/04 | 53279.66 | -0.008 | -0.003 | 0.009 | -0.015 | 1 |
| 02/10/04 | 53280.69 | -0.007 | -0.004 | 0.010 | -0.016 | 1 |
| 02/10/04 | 53281.38 | -0.001 | -0.011 | 0.014 | -0.047 | 3 |
| 03/10/04 | 53281.63 | -0.007 | -0.004 | 0.010 | -0.017 | 1 |
| 03/10/04 | 53282.43 | -0.002 | -0.017 | 0.037 | -0.085 | 2 |
| 04/10/04 | 53282.68 | -0.006 | -0.004 | 0.010 | -0.017 | 1 |
| 04/10/04 | 53282.98 | -0.012 | -0.004 | -0.006 | -0.020 | 4 |
| 05/10/04 | 53283.66 | -0.005 | -0.004 | 0.011 | -0.017 | 1 |
| 05/10/04 | 53283.94 | -0.010 | -0.006 | -0.006 | -0.019 | 4 |
| 05/10/04 | 53284.36 | -0.001 | -0.017 | 0.043 | -0.094 | 2 |
| 06/10/04 | 53285.33 | 0 | -0.017 | 0.045 | -0.099 | 2 |
| 06/10/04 | 53285.34 | -0.028 | 5 | |||
| 07/10/04 | 53286.30 | -0.006 | -0.032 | 0.005 | 0.117 | 6 |
| 10/10/04 | 53288.63 | -0.001 | -0.003 | 0.010 | -0.016 | 1 |
| 10/10/04 | 53288.92 | -0.002 | -0.009 | -0.015 | 4 | |
| 11/10/04 | 53290.30 | -0.008 | -0.034 | 0.006 | 0.111 | 6 |
| 12/10/04 | 53290.63 | 0 | -0.001 | 0.008 | -0.015 | 1 |
| 12/10/04 | 53290.92 | 0.002 | -0.009 | -0.011 | 4 | |
| 14/10/04 | 53292.63 | -0.001 | 0.002 | 0.007 | -0.013 | 1 |
| 14/10/04 | 53293.42 | -0.018 | -0.034 | 0.007 | 0.096 | 6 |
| 15/10/04 | 53294.42 | 0.002 | -0.013 | 0.071 | -0.109 | 2 |
| 16/10/04 | 53294.62 | -0.004 | 0.007 | 0.005 | -0.011 | 1 |
| 20/10/04 | 53298.61 | -0.004 | -0.001 | 0.003 | -0.025 | 7 |
| 21/10/04 | 53299.63 | -0.012 | 1 | |||
| 21/10/04 | 53300.32 | -0.013 | -0.009 | 0.001 | -0.044 | 3 |
| 22/10/04 | 53300.91 | 0.009 | -0.001 | -0.010 | 0.001 | 0 |
| 22/10/04 | 53301.37 | 0.002 | -0.005 | 0.086 | -0.112 | 2 |
| 23/10/04 | 53301.60 | -0.015 | 0.020 | -0.001 | -0.006 | 1 |
| 24/10/04 | 53302.90 | 0.008 | 0.001 | -0.012 | 0.002 | 0 |
| 25/10/04 | 53303.64 | -0.020 | 0.023 | -0.002 | -0.005 | 1 |
| 25/10/04 | 53303.96 | 0.007 | 0.002 | -0.013 | 0.003 | 4 |
| 28/10/04 | 53306.93 | 0.005 | 0.004 | -0.014 | 0.005 | 4 |
| 29/10/04 | 53307.93 | 0.004 | 0.005 | -0.014 | 0.006 | 4 |
| 30/10/04 | 53308.61 | -0.027 | 0.025 | -0.004 | -0.002 | 1 |
| 30/10/04 | 53309.33 | -0.026 | -0.008 | -0.004 | -0.026 | 3 |
| 31/10/04 | 53309.91 | 0.006 | -0.015 | 4 | ||
| 01/11/04 | 53310.60 | -0.028 | 0.025 | -0.005 | 0 | 1 |
| 02/11/04 | 53311.59 | -0.010 | 0.005 | -0.003 | -0.013 | 7 |
| 03/11/04 | 53312.60 | -0.028 | 0.024 | -0.005 | 0.001 | 1 |
| 05/11/04 | 53314.59 | -0.011 | 0.007 | -0.001 | -0.011 | 7 |
| Date | JD–2,400,000 | Instrument | ||||
| 07/11/04 | 53316.60 | -0.030 | 0.023 | -0.005 | 0.004 | 1 |
| 08/11/04 | 53318.33 | -0.009 | 0.009 | -0.027 | 0.032 | 8 |
| 11/11/04 | 53320.58 | 0.005 | 0.002 | -0.006 | 7 | |
| 12/11/04 | 53322.36 | -0.008 | 2 | |||
| 15/11/04 | 53325.27 | -0.074 | -0.039 | 0.005 | -0.005 | 6 |
| 15/11/04 | 53325.32 | -0.006 | 2 | |||
| 16/11/04 | 53325.61 | -0.001 | 0.011 | 1 | ||
| 16/11/04 | 53326.22 | -0.007 | 0.009 | -0.020 | 0.037 | 8 |
| 17/11/04 | 53327.24 | -0.006 | 0.009 | -0.019 | 0.037 | 8 |
| 18/11/04 | 53328.32 | 0.008 | -0.018 | 8 | ||
| 19/11/04 | 53328.59 | -0.016 | 0.016 | 0.001 | 0.013 | 1 |
| 19/11/04 | 53329.32 | -0.005 | 0.008 | -0.017 | 0.039 | 8 |
| 22/11/04 | 53331.59 | -0.012 | 0.014 | 0.002 | 0.014 | 1 |
| 25/11/04 | 53334.53 | -0.061 | 9 | |||
| 25/11/04 | 53334.59 | -0.007 | 0.013 | 0.004 | 0.015 | 1 |
| 25/11/04 | 53335.27 | -0.041 | -0.045 | 0.002 | -0.036 | 6 |
| 28/11/04 | 53337.59 | -0.003 | 0.012 | 0.004 | 0.016 | 1 |
| 30/11/04 | 53339.58 | 0.001 | -0.018 | 0.015 | 0.001 | 7 |
| 01/12/04 | 53340.56 | -0.018 | 7 | |||
| 06/12/04 | 53346.32 | -0.003 | -0.006 | 0.039 | 8 | |
| 07/12/04 | 53347.24 | -0.004 | 8 | |||
| 10/12/04 | 53350.20 | 0.002 | -0.005 | -0.004 | 0.047 | 8 |
| 13/12/04 | 53353.20 | 0.003 | -0.006 | -0.001 | 0.057 | 8 |
| 14/12/04 | 53353.59 | 0.003 | -0.006 | -0.001 | 0.059 | 8 |
| 04/01/05 | 53375.22 | -0.007 | 8 | |||
| 15/04/05 | 53475.88 | 0.055 | 0.059 | 0.126 | 9 | |
| 18/04/05 | 53478.89 | 0.198 | 9 | |||
| 12/05/05 | 53502.90 | 0.198 | 9 | |||
| 13/05/05 | 53503.91 | -0.028 | -0.110 | 0.007 | 0.037 | 10 |
| 14/05/05 | 53504.65 | 0.168 | 0.072 | -0.013 | 0.103 | 6 |
| 16/05/05 | 53506.64 | 0.168 | 0.072 | -0.013 | 0.103 | 6 |
| 29/06/05 | 53551.49 | 0.168 | 0.072 | -0.013 | 0.103 | 6 |
| 02/08/05 | 53584.52 | 0.111 | 0.163 | 0.214 | 0.100 | 11 |
| 10/08/05 | 53592.69 | 0.198 | 0.055 | 0.059 | 0.126 | 9 |
| 23/08/05 | 53605.53 | -0.028 | 10 | |||
| 11/09/05 | 53624.55 | -0.028 | -0.110 | 0.007 | 0.037 | 10 |
0 = SSO2.3-m + imager, 1 = KAIT + CCD, 2 = LT + RATCAM, 3 = NOT+ALFOSC, 4 = SSO1-m + WFI, 5 = Nw41-cm GAP + CCD, 6 = CAHA2.2-m + CAFOS, 7 = Ten0.81-m + CCD, 8 = Ekar1.82-m + AFOSC, 9 = ESO/MPI2.2-m + WFI, 10 = VLT-Antu + FORS1, 11 = TNG + DOLORES
| Date | JD–2,400,000 | Instrument | |||||
| 19/09/04 | 53268.07 | 0.020 | 0.050 | 0 | |||
| 20/09/04 | 53268.76 | 0.047 | 0.022 | 0.050 | 0.058 | 1 | |
| 21/09/04 | 53269.68 | 0.043 | 0.023 | 0.050 | 0.057 | 1 | |
| 21/09/04 | 53270.33 | 0.040 | 0.025 | 0.050 | 0.055 | 2 | |
| 22/09/04 | 53270.52 | 0.039 | 0.025 | 0.050 | 0.055 | 2 | |
| 22/09/04 | 53270.67 | 0.039 | 0.026 | 0.050 | 0.054 | 1 | |
| 23/09/04 | 53271.69 | 0.034 | 0.028 | 0.050 | 0.052 | 1 | |
| 23/09/04 | 53272.36 | 0.032 | 0.029 | 0.050 | 0.050 | 2 | |
| 25/09/04 | 53273.66 | 0.027 | 0.027 | 0.050 | 0.040 | 1 | |
| 26/09/04 | 53274.69 | 0.025 | 0.025 | 0.050 | 0.029 | 1 | |
| 26/09/04 | 53275.37 | 0.023 | 0.023 | 0.050 | 0.021 | 2 | |
| 27/09/04 | 53275.70 | 0.022 | 0.022 | 0.050 | 0.018 | 1 | |
| 27/09/04 | 53276.33 | 0.020 | 0.020 | 0.050 | 0.011 | 2 | |
| 28/09/04 | 53276.70 | 0.019 | 0.020 | 0.051 | 0.009 | 1 | |
| 28/09/04 | 53277.37 | 0.018 | 0.020 | 0.054 | 0.008 | 2 | |
| 29/09/04 | 53277.70 | 0.017 | 0.020 | 0.055 | 0.007 | 1 | |
| 29/09/04 | 53278.36 | 0.016 | 0.020 | 0.058 | 0.006 | 2 | |
| 30/09/04 | 53278.71 | 0.015 | 0.020 | 0.059 | 0.005 | 1 | |
| 01/10/04 | 53279.66 | 0.014 | 0.020 | 0.063 | 0.004 | 1 | |
| 02/10/04 | 53280.69 | 0.012 | 0.020 | 0.067 | 0.002 | 1 | |
| 02/10/04 | 53281.37 | 0.020 | 3 | ||||
| 02/10/04 | 53281.38 | 0.059 | 0.020 | 0.070 | 0 | 3 | |
| 02/10/04 | 53281.39 | 0.059 | 0.010 | 0.020 | 0.070 | 0 | 3 |
| 03/10/04 | 53281.63 | 0.010 | 0.020 | 0.070 | 0.001 | 1 | |
| 03/10/04 | 53282.43 | 0.008 | 0.018 | 0.070 | 0.008 | 2 | |
| 04/10/04 | 53282.68 | 0.008 | 0.017 | 0.070 | 0.010 | 1 | |
| 04/10/04 | 53282.98 | 0.007 | 0.017 | 0.070 | 0.012 | 4 | |
| 05/10/04 | 53283.66 | 0.006 | 0.015 | 0.070 | 0.018 | 1 | |
| 05/10/04 | 53283.94 | 0.005 | 0.015 | 0.070 | 0.020 | 4 | |
| 05/10/04 | 53284.36 | 0.003 | 0.070 | 0.024 | 2 | ||
| 05/10/04 | 53284.39 | 0.003 | 0.014 | 0.070 | 0.024 | 2 | |
| 06/10/04 | 53285.33 | 0.001 | 0.012 | 0.070 | 0.032 | 2 | |
| 06/10/04 | 53285.34 | 0.012 | 5 | ||||
| 07/10/04 | 53286.30 | -0.118 | -0.002 | 0.010 | 0.070 | 0.040 | 6 |
| 10/10/04 | 53288.63 | -0.007 | 0.004 | 0.059 | 0.034 | 1 | |
| 10/10/04 | 53288.92 | -0.009 | 0.004 | 0.034 | 4 | ||
| 11/10/04 | 53290.30 | -0.135 | -0.020 | 0 | 0.050 | 0.030 | 6 |
| 12/10/04 | 53290.63 | -0.022 | 0 | 0.050 | 0.028 | 1 | |
| 12/10/04 | 53290.92 | -0.024 | 0 | 0.026 | 4 | ||
| 14/10/04 | 53292.63 | -0.020 | 0 | 0.045 | 0.025 | 1 | |
| 14/10/04 | 53293.42 | -0.100 | -0.010 | 0 | 0.040 | 0.030 | 6 |
| 15/10/04 | 53294.42 | -0.016 | -0.006 | 0.040 | 0.029 | 2 | |
| 16/10/04 | 53294.62 | -0.017 | -0.007 | 0.040 | 0.028 | 1 | |
| 20/10/04 | 53298.61 | -0.078 | -0.040 | -0.030 | 0.040 | 0.023 | 7 |
| 21/10/04 | 53299.63 | -0.046 | 1 | ||||
| 21/10/04 | 53300.32 | -0.070 | -0.050 | -0.040 | 0.040 | 0.020 | 3 |
| 22/10/04 | 53300.90 | -0.031 | 0 | ||||
| 22/10/04 | 53300.92 | -0.089 | -0.041 | -0.031 | 0.049 | 0.020 | 0 |
| 22/10/04 | 53301.37 | -0.038 | -0.032 | 0.052 | 0.018 | 2 | |
| 23/10/04 | 53301.60 | -0.037 | -0.033 | 0.053 | 0.017 | 1 | |
| 24/10/04 | 53302.90 | -0.030 | -0.040 | 0.060 | 0.010 | 0 | |
| 25/10/04 | 53303.64 | -0.031 | -0.040 | 0.058 | 0.010 | 1 | |
| 25/10/04 | 53303.96 | -0.032 | -0.040 | 0.057 | 0.010 | 4 | |
| 28/10/04 | 53306.92 | -0.036 | 4 | ||||
| 28/10/04 | 53306.94 | -0.036 | -0.040 | 0.048 | 0.010 | 4 | |
| 29/10/04 | 53307.93 | -0.038 | -0.040 | 0.045 | 0.010 | 4 | |
| 29/10/04 | 53307.95 | -0.038 | 4 | ||||
| 30/10/04 | 53308.61 | -0.039 | -0.040 | 0.042 | 0.010 | 1 | |
| Date | JD–2,400,000 | Instrument | |||||
| 30/10/04 | 53309.33 | -0.140 | -0.040 | -0.040 | 0.040 | 0.010 | 3 |
| 31/10/04 | 53309.90 | -0.040 | 4 | ||||
| 31/10/04 | 53309.91 | -0.040 | 0.040 | 4 | |||
| 01/11/04 | 53310.60 | -0.040 | -0.040 | 0.040 | 0.014 | 1 | |
| 02/11/04 | 53311.59 | -0.040 | -0.040 | 0.040 | 0.017 | 7 | |
| 03/11/04 | 53312.60 | -0.040 | -0.040 | 0.040 | 0.020 | 1 | |
| 05/11/04 | 53314.59 | -0.040 | -0.040 | 0.040 | 0.026 | 7 | |
| 07/11/04 | 53316.60 | -0.040 | -0.040 | 0.040 | 0.033 | 1 | |
| 08/11/04 | 53318.33 | -0.040 | -0.040 | 0.040 | 0.038 | 8 | |
| 11/11/04 | 53320.58 | -0.040 | 0.040 | 0.045 | 7 | ||
| 12/11/04 | 53322.36 | -0.040 | 2 | ||||
| 15/11/04 | 53325.27 | -0.040 | -0.040 | 0.040 | 0.060 | 6 | |
| 15/11/04 | 53325.32 | -0.040 | 2 | ||||
| 16/11/04 | 53326.21 | -0.037 | 8 | ||||
| 16/11/04 | 53326.23 | -0.043 | -0.037 | 0.047 | 0.053 | 8 | |
| 17/11/04 | 53327.24 | -0.046 | -0.034 | 0.053 | 0.046 | 8 | |
| 18/11/04 | 53328.32 | -0.030 | 0.060 | 8 | |||
| 19/11/04 | 53328.59 | -0.042 | -0.027 | 0.055 | 0.036 | 1 | |
| 19/11/04 | 53329.31 | -0.021 | -0.020 | 8 | |||
| 19/11/04 | 53329.32 | -0.020 | 0.041 | 0.030 | 8 | ||
| 22/11/04 | 53331.59 | -0.037 | -0.026 | 0.04 | 0.053 | 1 | |
| 25/11/04 | 53334.53 | -0.093 | -0.048 | 9 | |||
| 25/11/04 | 53334.59 | -0.048 | -0.028 | 0.042 | 0.071 | 1 | |
| 25/11/04 | 53335.27 | -0.047 | -0.027 | 0.043 | 0.072 | 6 | |
| 28/11/04 | 53337.59 | -0.044 | -0.024 | 0.046 | 0.075 | 1 | |
| 30/11/04 | 53339.58 | -0.041 | -0.021 | 0.049 | 0.077 | 7 | |
| 01/12/04 | 53340.56 | -0.020 | 7 | ||||
| 06/12/04 | 53346.32 | -0.011 | 0.059 | 0.084 | 8 | ||
| 07/12/04 | 53347.24 | -0.010 | 8 | ||||
| 10/12/04 | 53350.19 | -0.010 | 8 | ||||
| 10/12/04 | 53350.20 | -0.038 | -0.010 | 0.038 | 0.089 | 8 | |
| 13/12/04 | 53353.20 | -0.040 | -0.009 | 0.029 | 0.090 | 8 | |
| 14/12/04 | 53353.59 | -0.040 | -0.008 | 0.029 | 0.090 | 1 | |
| 04/01/05 | 53375.22 | 0.007 | 8 | ||||
| 09/04/05 | 53469.89 | N | 9 | ||||
| 15/04/05 | 53475.88 | 0.078 | -0.010 | 0.106 | 9 | ||
| 18/04/05 | 53478.89 | -0.070 | 9 | ||||
| 12/05/05 | 53502.90 | -0.070 | 9 | ||||
| 13/05/05 | 53503.91 | -0.070 | 0.100 | -0.020 | 0.110 | 10 | |
| 14/05/05 | 53504.65 | -0.070 | 0.100 | -0.020 | 0.110 | 6 | |
| 16/05/05 | 53506.64 | -0.070 | 0.100 | -0.020 | 0.110 | 6 | |
| 29/06/05 | 53551.49 | -0.070 | 0.100 | -0.020 | 0.110 | 6 | |
| 02/08/05 | 53584.52 | N | -0.070 | 0.100 | -0.020 | 0.110 | 11 |
| 10/08/05 | 53592.69 | -0.070 | 0.100 | -0.020 | 0.110 | 9 | |
| 23/08/05 | 53605.53 | -0.070 | 10 | ||||
| 11/09/05 | 53624.55 | -0.070 | 0.100 | -0.020 | 0.110 | 10 |
N = the K–correction in the band was not computed for these two epochs.
0 = SSO2.3-m + imager, 1 = KAIT + CCD, 2 = LT + RATCAM, 3 = NOT+ALFOSC, 4 = SSO1-m + WFI, 5 = Nw41-cm GAP + CCD, 6 = CAHA2.2-m + CAFOS, 7 = Ten0.81-m + CCD, 8 = Ekar1.82-m + AFOSC, 9 = ESO/MPI2.2-m + WFI, 10 = VLT-Antu + FORS1, 11 = TNG + DOLORES.
| Date | JD–2,400,000 | Instrument | |||||
| 19/09/04 | 53268.07 | 16.776 (0.014) | 16.530 (0.014) | 0 | |||
| 20/09/04 | 53268.76 | 16.721 (0.024) | 16.507 (0.025) | 16.293 (0.034) | 16.283 (0.039) | 1 | |
| 21/09/04 | 53269.68 | 16.476 (0.016) | 16.305 (0.013) | 16.081 (0.015) | 16.089 (0.019) | 1 | |
| 21/09/04 | 53270.33 | 16.342 (0.020) | 16.144 (0.018) | 16.045 (0.019) | 15.853 (0.033) | 2 | |
| 22/09/04 | 53270.52 | 16.319 (0.018) | 16.152 (0.014) | 15.969 (0.020) | 15.858 (0.025) | 2 | |
| 22/09/04 | 53270.67 | 16.214 (0.043) | 16.076 (0.018) | 15.863 (0.017) | 15.875 (0.024) | 1 | |
| 23/09/04 | 53271.69 | 16.051 (0.017) | 15.925 (0.015) | 15.678 (0.016) | 15.723 (0.021) | 1 | |
| 23/09/04 | 53272.36 | 15.991 (0.018) | 15.874 (0.012) | 15.625 (0.019) | 15.555 (0.025) | 2 | |
| 25/09/04 | 53273.66 | 15.775 (0.020) | 15.651 (0.020) | 15.450 (0.019) | 15.497 (0.034) | 1 | |
| 26/09/04 | 53274.69 | 15.677 (0.021) | 15.555 (0.018) | 15.330 (0.020) | 15.404 (0.035) | 1 | |
| 26/09/04 | 53275.37 | 15.632 (0.017) | 15.558 (0.015) | 15.375 (0.020) | 15.364 (0.026) | 2 | |
| 27/09/04 | 53275.70 | 15.609 (0.022) | 15.471 (0.015) | 15.295 (0.016) | 15.405 (0.021) | 1 | |
| 27/09/04 | 53276.33 | 15.602 (0.017) | 15.478 (0.013) | 15.339 (0.019) | 15.352 (0.025) | 2 | |
| 28/09/04 | 53276.70 | 15.545 (0.026) | 15.444 (0.016) | 15.238 (0.015) | 15.380 (0.023) | 1 | |
| 28/09/04 | 53277.37 | 15.526 (0.019) | 15.447 (0.013) | 15.278 (0.022) | 15.365 (0.025) | 2 | |
| 29/09/04 | 53277.70 | 15.527 (0.019) | 15.388 (0.017) | 15.248 (0.012) | 15.392 (0.021) | 1 | |
| 29/09/04 | 53278.36 | 15.544 (0.017) | 15.454 (0.013) | 15.278 (0.019) | 15.364 (0.025) | 2 | |
| 30/09/04 | 53278.71 | 15.511 (0.020) | 15.368 (0.022) | 15.228 (0.015) | 15.417 (0.018) | 1 | |
| 01/10/04 | 53279.66 | 15.512 (0.024) | 15.356 (0.016) | 15.239 (0.015) | 15.462 (0.021) | 1 | |
| 02/10/04 | 53280.69 | 15.550 (0.019) | 15.345 (0.016) | 15.224 (0.026) | 15.478 (0.024) | 1 | |
| 02/10/04 | 53281.37 | 15.396 (0.014) | 3 | ||||
| 02/10/04 | 53281.38 | 15.484 (0.039) | 15.394 (0.013) | 15.301 (0.013) | 15.567 (0.024) | 3 | |
| 02/10/04 | 53281.39 | 15.498 (0.039) | 15.578 (0.015) | 15.400 (0.013) | 15.289 (0.015) | 15.571 (0.025) | 3 |
| 03/10/04 | 53281.63 | 15.597 (0.021) | 15.353 (0.015) | 15.251 (0.017) | 15.519 (0.025) | 1 | |
| 03/10/04 | 53282.43 | 15.630 (0.016) | 15.359 (0.016) | 15.252 (0.019) | 15.510 (0.025) | 2 | |
| 04/10/04 | 53282.68 | 15.635 (0.056) | 15.350 (0.015) | 15.240 (0.016) | 15.520 (0.017) | 1 | |
| 04/10/04 | 53282.98 | 15.657 (0.022) | 15.417 (0.016) | 15.286 (0.017) | 15.501 (0.038) | 4 | |
| 05/10/04 | 53283.66 | 15.712 (0.016) | 15.397 (0.012) | 15.285 (0.013) | 15.570 (0.021) | 1 | |
| 05/10/04 | 53283.94 | 15.715 (0.016) | 15.431 (0.012) | 15.337 (0.013) | 15.566 (0.017) | 4 | |
| 05/10/04 | 53284.36 | 15.782 (0.021) | 15.337 (0.019) | 15.556 (0.029) | 2 | ||
| 05/10/04 | 53284.39 | 15.779 (0.016) | 15.433 (0.013) | 15.323 (0.017) | 15.583 (0.025) | 2 | |
| 06/10/04 | 53285.33 | 15.896 (0.016) | 15.468 (0.014) | 15.382 (0.019) | 15.655 (0.026) | 2 | |
| 06/10/04 | 53285.34 | 15.496 (0.132) | 5 | ||||
| 07/10/04 | 53286.30 | 15.828 (0.039) | 15.917 (0.023) | 15.468 (0.014) | 15.495 (0.015) | 15.727 (0.039) | 6 |
| 10/10/04 | 53288.63 | 16.174 (0.017) | 15.578 (0.016) | 15.528 (0.021) | 15.784 (0.038) | 1 | |
| 10/10/04 | 53288.92 | 16.232 (0.020) | 15.671 (0.012) | 15.796 (0.018) | 4 | ||
| 11/10/04 | 53290.30 | 16.357 (0.039) | 16.464 (0.025) | 15.693 (0.048) | 15.733 (0.039) | 15.789 (0.043) | 6 |
| 12/10/04 | 53290.63 | 16.424 (0.016) | 15.746 (0.016) | 15.669 (0.014) | 15.838 (0.017) | 1 | |
| 12/10/04 | 53290.92 | 16.487 (0.016) | 15.795 (0.014) | 15.826 (0.017) | 4 | ||
| 14/10/04 | 53292.63 | 16.717 (0.019) | 15.904 (0.016) | 15.754 (0.013) | 15.829 (0.021) | 1 | |
| 14/10/04 | 53293.42 | 17.182 (0.040) | 16.878 (0.025) | 15.925 (0.016) | 15.874 (0.023) | 15.809 (0.039) | 6 |
| 15/10/04 | 53294.42 | 16.948 (0.016) | 16.017 (0.016) | 15.776 (0.018) | 15.839 (0.026) | 2 | |
| 16/10/04 | 53294.62 | 16.940 (0.029) | 16.056 (0.016) | 15.827 (0.016) | 15.783 (0.020) | 1 | |
| 20/10/04 | 53298.61 | 18.047 (0.082) | 17.444 (0.032) | 16.303 (0.018) | 15.869 (0.019) | 15.766 (0.022) | 7 |
| 21/10/04 | 53299.63 | 17.505 (0.235) | 1 | ||||
| 21/10/04 | 53300.32 | 18.022 (0.041) | 17.466 (0.016) | 16.357 (0.015) | 16.025 (0.016) | 15.829 (0.025) | 3 |
| 22/10/04 | 53300.90 | 16.493 (0.012) | 0 | ||||
| 22/10/04 | 53300.92 | 18.076 (0.076) | 17.649 (0.018) | 16.498 (0.012) | 16.079 (0.013) | 15.848 (0.021) | 0 |
| 22/10/04 | 53301.37 | 17.674 (0.043) | 16.474 (0.026) | 16.074 (0.019) | 15.813 (0.027) | 2 | |
| 23/10/04 | 53301.60 | 17.631 (0.071) | 16.509 (0.024) | 16.083 (0.032) | 15.796 (0.038) | 1 | |
| 24/10/04 | 53302.90 | 17.847 (0.033) | 16.615 (0.025) | 16.151 (0.067) | 15.794 (0.089) | 0 | |
| 25/10/04 | 53303.64 | 17.861 (0.067) | 16.657 (0.024) | 16.146 (0.018) | 15.771 (0.029) | 1 | |
| 25/10/04 | 53303.96 | 17.892 (0.043) | 16.651 (0.024) | 16.220 (0.016) | 15.859 (0.019) | 4 | |
| 28/10/04 | 53306.92 | 18.128 (0.073) | 4 | ||||
| 28/10/04 | 53306.94 | 18.114 (0.060) | 16.882 (0.020) | 16.426 (0.022) | 16.016 (0.019) | 4 | |
| 29/10/04 | 53307.93 | 18.190 (0.097) | 16.937 (0.025) | 16.478 (0.032) | 16.058 (0.023) | 4 | |
| 29/10/04 | 53307.95 | 18.202 (0.106) | 4 | ||||
| 30/10/04 | 53308.61 | 18.134 (0.034) | 16.962 (0.020) | 16.453 (0.017) | 16.100 (0.022) | 1 | |
| Date | JD–2,400,000 | Instrument | |||||
| 30/10/04 | 53309.33 | 18.483 (0.042) | 18.242 (0.016) | 16.964 (0.013) | 16.584 (0.013) | 16.212 (0.025) | 3 |
| 31/10/04 | 53309.90 | 17.057 (0.051) | 4 | ||||
| 31/10/04 | 53309.91 | 17.070 (0.019) | 16.642 (0.027) | 4 | |||
| 01/11/04 | 53310.60 | 18.150 (0.026) | 17.112 (0.019) | 16.636 (0.020) | 16.221 (0.033) | 1 | |
| 02/11/04 | 53311.59 | 18.278 (0.111) | 17.080 (0.061) | 16.731 (0.045) | 16.263 (0.116) | 7 | |
| 03/11/04 | 53312.60 | 18.259 (0.027) | 17.178 (0.048) | 16.757 (0.022) | 16.337 (0.037) | 1 | |
| 05/11/04 | 53314.59 | 18.493 (0.032) | 17.223 (0.019) | 16.915 (0.060) | 16.522 (0.032) | 7 | |
| 07/11/04 | 53316.60 | 18.538 (0.061) | 17.393 (0.029) | 17.001 (0.027) | 16.639 (0.031) | 1 | |
| 08/11/04 | 53318.33 | 18.599 (0.071) | 17.424 (0.031) | 17.037 (0.037) | 16.720 (0.038) | 8 | |
| 11/11/04 | 53320.58 | 17.461 (0.023) | 17.137 (0.023) | 16.974 (0.045) | 7 | ||
| 12/11/04 | 53322.36 | 18.681 (0.210) | 2 | ||||
| 15/11/04 | 53325.27 | 18.696 (0.054) | 17.580 (0.022) | 17.288 (0.017) | 17.060 (0.049) | 6 | |
| 15/11/04 | 53325.32 | 18.767 (0.049) | 2 | ||||
| 16/11/04 | 53326.21 | 17.628 (0.031) | 8 | ||||
| 16/11/04 | 53326.23 | 18.728 (0.055) | 17.648 (0.047) | 17.347 (0.050) | 17.062 (0.110) | 8 | |
| 17/11/04 | 53327.24 | 18.734 (0.240) | 17.707 (0.047) | 17.409 (0.019) | 17.152 (0.021) | 8 | |
| 18/11/04 | 53328.32 | 17.716 (0.135) | 17.406 (0.155) | 8 | |||
| 19/11/04 | 53328.59 | 18.736 (0.100) | 17.729 (0.050) | 17.397 (0.021) | 17.194 (0.038) | 1 | |
| 19/11/04 | 53329.31 | 18.788 (0.240) | 17.754 (0.220) | 8 | |||
| 19/11/04 | 53329.32 | 17.763 (0.105) | 17.387 (0.130) | 17.286 (0.130) | 8 | ||
| 22/11/04 | 53331.59 | 18.760 (0.500) | 17.814 (0.300) | 17.412 (0.220) | 17.330 (0.180) | 1 | |
| 25/11/04 | 53334.53 | 19.016 (0.262) | 18.724 (0.275) | 9 | |||
| 25/11/04 | 53334.59 | 18.763 (0.215) | 17.874 (0.065) | 17.551 (0.070) | 17.395 (0.200) | 1 | |
| 25/11/04 | 53335.27 | 19.037 (0.055) | 18.825 (0.026) | 17.871 (0.020) | 17.605 (0.014) | 17.488 (0.043) | 6 |
| 28/11/04 | 53337.59 | 18.897 (0.083) | 17.934 (0.028) | 17.716 (0.025) | 17.631 (0.039) | 1 | |
| 30/11/04 | 53339.58 | 18.947 (0.145) | 17.975 (0.033) | 17.717 (0.055) | 17.751 (0.131) | 7 | |
| 01/12/04 | 53340.56 | 17.985 (0.047) | 7 | ||||
| 06/12/04 | 53346.32 | 18.103 (0.025) | 17.990 (0.016) | 17.916 (0.042) | 8 | ||
| 07/12/04 | 53347.24 | 18.170 (0.019) | 8 | ||||
| 10/12/04 | 53350.19 | 18.249 (0.058) | 8 | ||||
| 10/12/04 | 53350.20 | 19.097 (0.049) | 18.257 (0.025) | 18.098 (0.033) | 18.150 (0.036) | 8 | |
| 13/12/04 | 53353.20 | 19.201 (0.080) | 18.354 (0.018) | 18.184 (0.019) | 18.234 (0.023) | 8 | |
| 14/12/04 | 53353.59 | 19.201 (0.280) | 18.345 (0.080) | 18.189 (0.125) | 18.235 (0.215) | 1 | |
| 04/01/05 | 53375.22 | 18.717 (0.550) | 8 | ||||
| 09/04/05 | 53469.89 | 22.181 (0.210) | 9 | ||||
| 15/04/05 | 53475.88 | 20.835 (0.028) | 21.256 (0.049) | 21.146 (0.136) | 9 | ||
| 18/04/05 | 53478.89 | 20.611 (0.021) | 9 | ||||
| 12/05/05 | 53502.90 | 21.483 (0.017) | 9 | ||||
| 13/05/05 | 53503.91 | 21.565 (0.018) | 21.328 (0.014) | 21.718 (0.020) | 21.210 (0.027) | 10 | |
| 14/05/05 | 53504.65 | 21.786 (0.300) | 21.524 (0.460) | 21.57 | 21.37 | 6 | |
| 16/05/05 | 53506.64 | 21.641 (0.054) | 21.507 (0.061) | 21.978 (0.087) | 21.661 (0.288) | 6 | |
| 29/06/05 | 53551.49 | 22.358 (0.102) | 22.129 (0.093) | 22.586 (0.135) | 22.222 (0.200) | 6 | |
| 02/08/05 | 53584.52 | 24.24 | 22.834 (0.190) | 22.630 (0.045) | 23.413 (0.120) | 22.728 (0.181) | 11 |
| 10/08/05 | 53592.69 | 22.970 (0.094) | 22.737 (0.125) | 23.27 | 22.37 | 9 | |
| 23/08/05 | 53605.53 | 23.239 (0.060) | 10 | ||||
| 11/09/05 | 53624.55 | 23.423 (0.046) | 23.207 (0.045) | 23.620 (0.080) | 22.725 (0.076) | 10 |
0 = SSO2.3-m + imager, 1 = KAIT + CCD, 2 = LT, 3 = NOT+ALFOSC, 4 = SSO1-m + WFI, 5 = Nw41-cm + CCD, 6 = CAHA2.2-m + CAFOS, 7 = Ten0.81-m + CCD, 8 = Ekar1.82-m + AFOSC, 9 = ESO/MPI2.2-m + WFI, 10 = VLT-Antu + FORS1, 11 = TNG + DOLORES
| Date | JD–2,400,000 | Instrument | |||
|---|---|---|---|---|---|
| 29/09/04 | 53278.29 | 15.695 (0.073) | 15.985 (0.097) | 15.681 (0.177) | A |
| 01/10/04 | 53280.27 | – | – | 15.680 (0.191) | A |
| 02/10/04 | 53281.43 | 15.834 (0.065) | 15.991 (0.085) | 15.677 (0.150) | B |
| 03/10/04 | 53282.33 | 15.973 (0.077) | 15.991 (0.098) | 15.682 (0.337) | A |
| 05/10/04 | 53284.31 | 16.185 (0.101) | 16.077 (0.134) | 15.685 (0.523) | A |
| 07/10/04 | 53286.26 | – | – | 15.757 (0.322) | A |
| 19/10/04 | 53298.28 | 16.29 | – | – | A |
| 20/10/04 | 53299.30 | 16.851 (0.145) | 15.847 (0.119) | 15.764 (0.182) | A |
| 22/10/04 | 53300.88 | 16.802 (0.087) | 15.788 (0.072) | 15.674 (0.092) | C |
| 29/10/04 | 53307.93 | 16.545 (0.062) | 16.114 (0.085) | 16.209 (0.177) | C |
| 05/11/04 | 53315.29 | 17.165 (0.192) | – | – | D |
| 05/11/04 | 53315.35 | 17.173 (0.097) | – | – | D |
| 17/11/04 | 53326.93 | 18.313 (0.076) | 17.015 (0.099) | – | C |
| 18/11/04 | 53327.90 | – | – | 17.065 (0.161) | C |
| 19/11/04 | 53329.32 | 18.254 (0.103) | 17.050 (0.091) | 17.226 (0.198) | B |
| 16/04/05 | 53476.89 | – | 19.73 | – | E |
| 18/04/05 | 53478.87 | – | 20.53 | – | E |
| 21/04/05 | 53481.86 | 21.935 (0.102) | – | – | E |
| 22/04/05 | 53483.68 | 21.04 | 20.05 | 19.32 | F |
| 15/05/05 | 53505.83 | 22.206 (0.282) | – | – | E |
| 19/05/05 | 53509.64 | – | – | 19.05 | F |
| 21/05/05 | 53511.83 | – | 20.898 (0.312) | – | E |
A = CI + SWIRCAM, B = TNG + NICS, C = AAT + IRIS2,
D = WHT + LIRIS, E = VLT-Antu + ISAAC,
F = CAHA3.5-m + OMEGA2000
Following the prescription of Hamuy et al. [1993], and using the spectra of SN 2004eo presented in Sect. 4, we computed the K–correction to be applied to the photometric data of SN 2004eo. In order to cover the epochs for which no spectra were available, the corrections were linearly interpolated.
The K–corrections to be added to the SN magnitudes of Tab. LABEL:opt_photometry are reported in Tab. LABEL:K_corr. They are typically below 0.1 mag and are, in general, larger at late phases. Since the nebular spectra evolve very slowly, the K–correction was assumed to be constant at phases later than 200 d.
Due to the lack of adequate spectral coverage in the IR region, no K–correction was applied to the , , and photometry (Tab. 8).
3.3 Optical and Infrared Light Curves
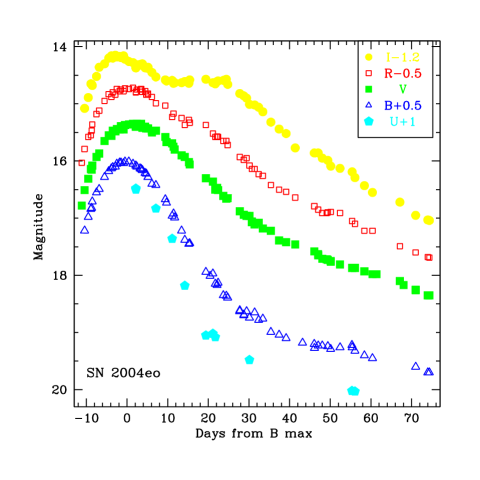
The S– and K–corrected optical magnitudes are reported in Tab. LABEL:SK_opt_photometry. Early–time (up to 3 months post-explosion) S– and K–corrected optical light curves of SN 2004eo are shown in Fig. 2 (left). Phase 0 corresponds to the epoch of maximum in the -band light curve, which was estimated to have occurred on September 30.7 (JD = 2,453,279.2, see Sect. 3.5).
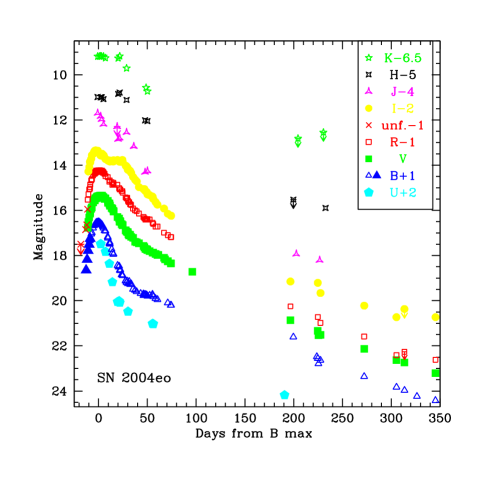
Our early–time photometric coverage adequately samples all the phases of the early light curve (i.e., pre–maximum rise, -band maximum phase, decline, -band secondary peak). In addition, some photometry was obtained during the nebular phase. In Fig. 2(right) the complete through light curves are shown, including some additional data from the literature [2004, 2004]. Unfortunately, the band and IR observations only commenced near maximum light, and so the coverage for these wavelengths is incomplete.
As is characteristic of SNe Ia, the - and -band peaks are delayed with respect to the -band maximum, while the -band maximum occurs few days earlier (Sect. 3.5). A clear secondary peak is visible in the -band light curve, though less prominent than usual (see Fig. 2–left). A hint of a plateau–like feature is detectable in the -band curve at the time of the -band secondary maximum.
The evolution of the -band light curve is similar to that of the band, although the post-maximum decline is steeper ( mag to the minimum). At about 4 weeks, the -band light curve shows evidence of a secondary maximum analogous to that observed in the band. After that, the -band light curve declines very rapidly, fading by about 1.5 mag in 3 weeks. Elias et al. [1981], Meikle [2000], and Phillips et al. [2003] noted that the and -band light curves of SNe Ia show a secondary maximum with brightness similar to that of the early maximum, resulting in relatively flat and light curves during the first month. Thereafter, the IR light curves decline steeply. A few late–time IR observations were also obtained, and the SN was recovered at 230 d, at mag and mag. The SN was not detected in the band at 205 d to a limiting magnitude of 19.3.
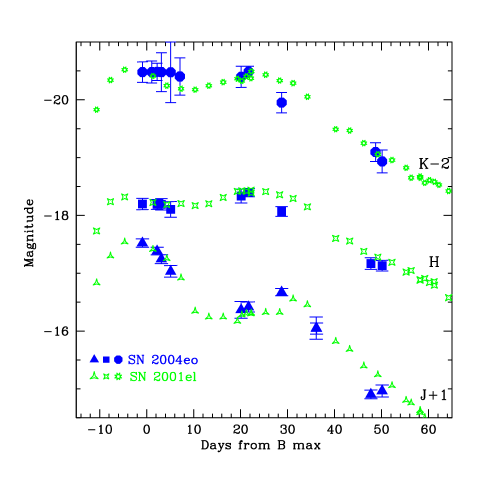
In Fig. 3 the absolute IR light curves of SN 2004eo, computed using the distance to the host galaxy discussed in Sect. 3.4, are compared with those of the well-observed SN 2001el [2003]. Despite different values of for the two SNe (1.15 for SN 2001el and 1.46 for SN 2004eo, see Sect. 3.5), the , , and light curves turn out to be quite similar.
3.4 Colour Evolution and uvoir Light Curve
The excellent photometric coverage of SN 2004eo allows a detailed comparison of the colour and luminosity evolution with those of other well–studied SNe Ia. The distance of NGC 6928 was computed from the recession velocity corrected for Local Group infall into the Virgo cluster (vVir = 4810 km s-1). Assuming = 72 km s-1 Mpc-1, we obtain a distance Mpc, or mag (LEDA).
The total reddening was estimated by taking into account only the Galactic contribution, mag [1998]. The Cardelli, Clayton, Mathis [1989] law was used to estimate the extinction in the different bands. The SN has a peripheral location in the host galaxy and narrow interstellar Na I D lines are not detected. This suggests that the light of SN 2004eo was not significantly extinguished in the host galaxy.
We compared the colour and uvoir light curves of SN 2004eo with those of other normal SNe Ia (SNe 1992A, 1996X, 1994D, 2002bo, 2002er, and 2003du) spanning a range of different values. Comparisons were also made with the more peculiar SN 1991T (Filippenko et al. 1992b; Phillips et al. 1992) and SN 1991bg (Filippenko et al. 1992a; Leibundgut et al. 1993). In Tab. 9 we list the JD of the -band maximum, distance modulus, and extinction for each SN.
| SN | JD() | sources | |||
|---|---|---|---|---|---|
| 2004eo | 2,453,279.2 | 1.46 | 34.12 | 0.109 | 0,1 |
| 1991T | 2,548,374.5 | 0.94 | 30.74 | 0.22 | 2,3,4,5,6,7 |
| 1991bg | 2,448,605.5 | 1.94 | 31.32 | 0.04 | 5,8,9,10,11 |
| 1992A | 2,448,640.5 | 1.45 | 31.41‡ | 0.06 | 6,12,1 |
| 1994D | 2,449,432.5 | 1.31 | 31.14 | 0.03 | 6,11,13,14,15,16 |
| 1996X | 2,450,191.5 | 1.32 | 32.17 | 0.07 | 17,18,1 |
| 2002bo | 2,452,356.5 | 1.17 | 31.45 | 0.38 | 5,19,20,1 |
| 2002er | 2,452,524.16 | 1.33 | 32.87 | 0.36 | 21,1 |
| 2003du | 2,452,766.38 | 1.02 | 32.42 | 0.01 | 22,23,1 |
0 = This paper; 1 = LEDA;
2 = Schmidt et al. [1994];
3 = Lira et al. [1998];
4 = Cappellaro et al. [1997];
5 = Krisciunas et al. [2004];
6 = Altavilla et al. [2004];
7 = Saha et al. [2001];
8 = Filippenko et al. [1992a];
9 = Leibundgut et al. [1993];
10 = Turatto et al. [1996];
11 = Tonry et al. [2001];
12 = Suntzeff [1996];
13 = Richmond et al. [1995];
14 = Tsvetkov Pavlyuk [1995];
15 = Patat et al. [1996];
16 = Meikle et al. [1996];
17 = Riess et al. [1999a];
18 = Salvo et al. [2001];
19 = Benetti et al. [2004];
20 = Stehle et al. [2005];
21 = Pignata et al. [2004];
22 = Stanishev et al. [2007];
23 = Leonard et al. [2005];
‡ = average from different sources.
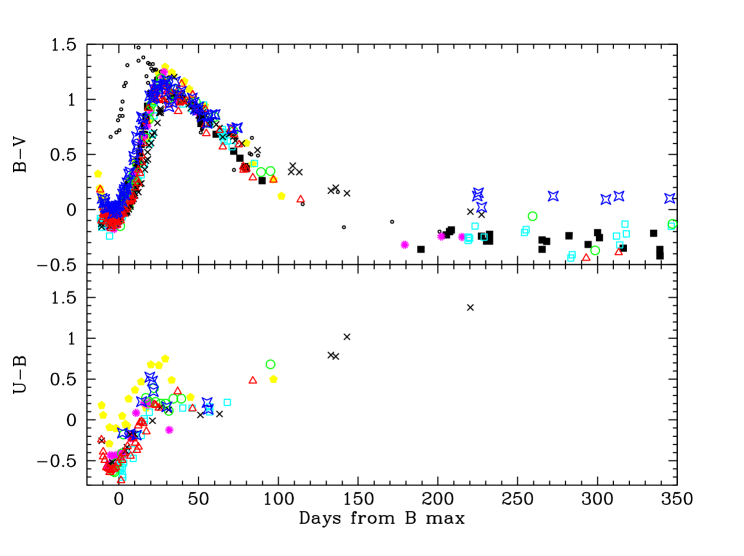
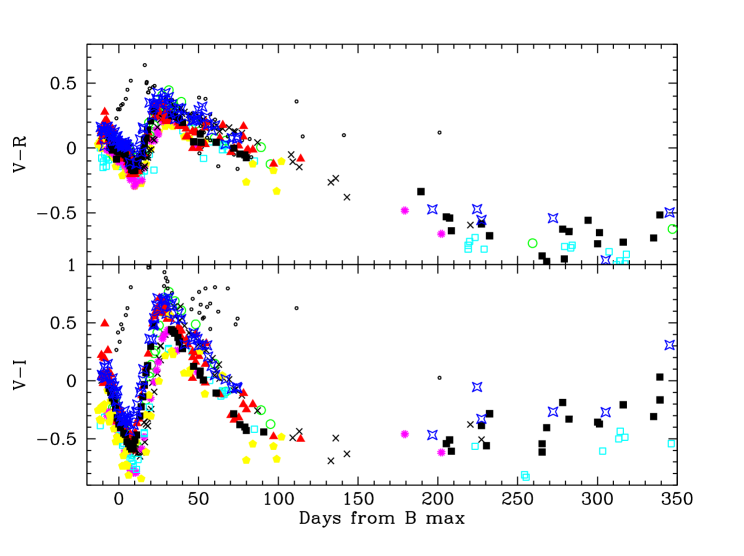
As can be seen, in Fig. 4 the colour curves of SN 2004eo show an evolution similar to that of normal SNe Ia, and different from those of SN 1991bg which are redder until about +3 weeks past maximum. After the initial shift to the blue, the colour of SN 2004eo reddens from 0 at +5 d to 1.2 at about +1 month. Later on (at +30 d, Fig. 4, top), the curve becomes bluer again. At late times ( +200 d) the colour of SN 2004eo is unusually red (0.1 mag). This colour is 0.3–0.4 mag redder than in other SNe Ia at comparable phases. Some of the difference may be attributed to the fact that most of the reference SNe are not S–corrected. S–correction can be fairly large at late phases because of the presence of strong emission lines. However, other more physical reasons may account for this anomalous late–time colour (see Sect. 4.1). Instead, there is no corresponding red excess of the late–epoch and colour curves (see below).
The colour of SN 2004eo (Fig. 4, bottom) increases from at a few days after maximum, to 0.5 at about +20 d. During the subsequent month, it remains almost constant, mag. The colour curve of SN 2004eo (Fig. 4, top) evolves from 0.3 to 0.1 mag during the period week to +1 week. It then reddens from 0.1 to 0.6 mag between +10 and +20 d, before turning blueward again ( in the late nebular phase). A similar evolution is observed in the colour (Fig. 4 bottom).
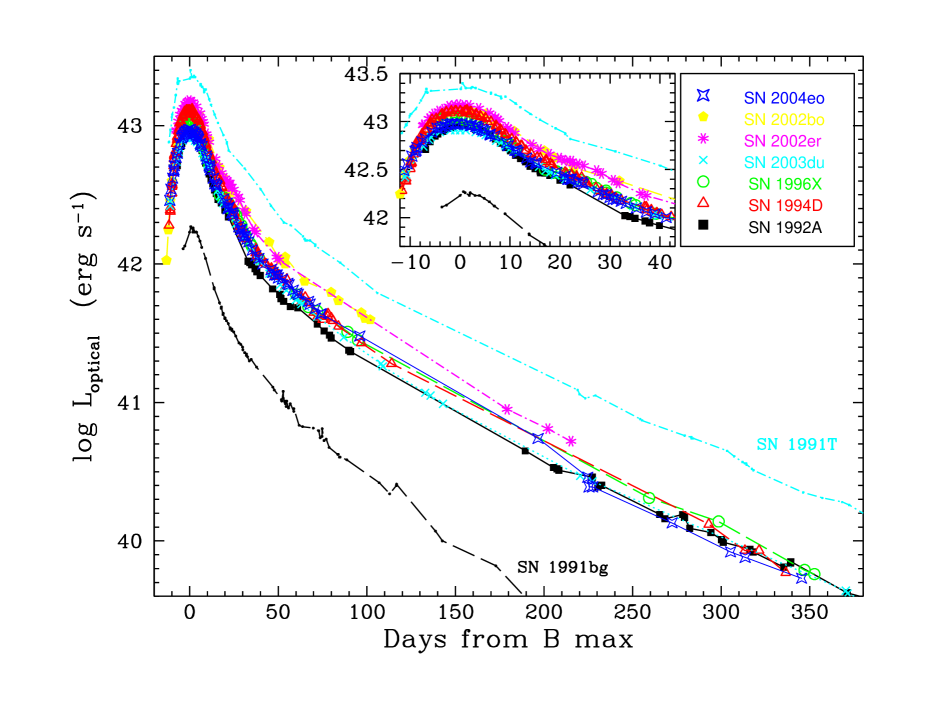
Fig. 5 shows the pseudo–bolometric (uvoir) light curve of SN 2004eo, compared with those of other SNe Ia, including the peculiar SNe 1991T and 1991bg. The uvoir light curve was obtained by integrating the fluxes in the optical region from the band to the band. The J, H and K–band data were not included because most of the comparison SNe do not have well–sampled NIR light curves. The light curve is similar to those of typical SNe Ia, fainter than that of SN 1991T, and definitely brighter than that of SN 1991bg. In particular, SN 2004eo appears to have a luminosity evolution similar to that of SN 1992A (at least up to +1 month).
Finally, using available , , and data, we estimate the IR contribution to the SN bolometric luminosity to be negligible near maximum (2–3), increasing to over 20 by about +50 d.
3.5 Main Parameters of SN 2004eo from the Photometry
| Parameters | ||||
|---|---|---|---|---|
| JDmax | 2,453,279.20.5 | 2,453,280.80.4 | 2,453,280.10.7 | 2,453,276.31.0 |
| JD() JD(B)max | – | |||
| Aλ | 0.468 | 0.360 | 0.290 | 0.211 |
| mλ,max | 15.510.02 | 15.350.02 | 15.220.03 | 15.360.04 |
| Mλ,max | –19.080.10 | –19.130.10 | –19.190.10 | –18.970.11 |
| m | 1.450.04 | 0.740.04 | 0.570.07 | 0.450.10 |
| m(neb) (mag/100d) | 1.530.11 | 1.480.06 | 1.600.26 | 1.250.29 |
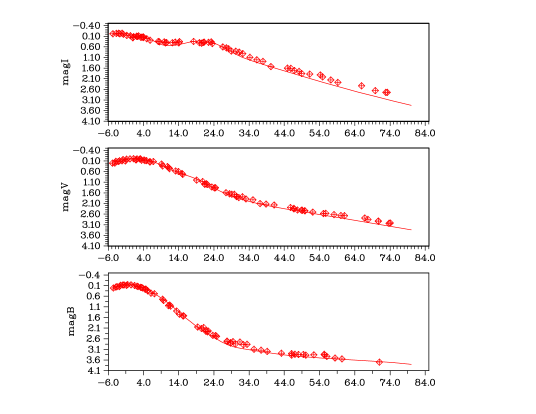
A test shows that the best match to the SN 2004eo light curves in all bands is given by SN 1992A [1996a]. As shown in Fig. 6, the fit is excellent in the and bands, while some difference is seen in the band, such as in the depth of the minimum. This is not surprising, since differences in the light curves of SNe Ia are usually more evident in this band [1996].
The epoch and apparent magnitude of the -band maximum (JD = 2,453,279.2 0.5, mag) were estimated by fitting the observations of the first month with a fifth or sixth–order polynomial. The epochs of the and -band maxima were similarly determined and occur, respectively, at +1.6 and +0.9 d, while the -band maximum is at about d. Fitting the -band light curve with a higher–degree spline, we found the epoch of the -band secondary maximum to be at about +19 d (i.e., 22 d after the main -band maximum).
Given the peak magnitude and adopted distance and reddening (see Sec 3.4), the absolute -band peak magnitude is mag. This is only marginally fainter than the average for normal SNe Ia [2000]. The absolute magnitudes of the , , and -band maxima are, respectively, mag, mag, and mag (the uncertainties include fitting errors plus uncertainty in the distance).
The observed was found to be 1.45 0.04 mag. In Tab. 10 we show the corresponding values for the , , and bands, together with other light–curve parameters. The reddening–corrected [1999] = 1.46; because of the low reddening, the correction was negligible.
It has been established that the luminosity of SNe Ia correlates with the decline rate after maximum light; the slower the SN declines, the brighter the absolute peak magnitude [1977, 1993, 1995, 1996b, 2005]. More recently, other calibrations of the relations between absolute peak magnitudes and light-curve shape have been determined and refined using ever larger samples of well-studied SNe Ia.
The application of these relations reduced the scatter in the Hubble diagram of SNe Ia and significantly improved their effectiveness as distance indicators. As detailed by Pastorello et al. [2007], we make use of some of these relations to determine the peak luminosity of SN 2004eo (see Tab. 11). All relations have been rescaled to = 72 km s-1 Mpc-1.
Wang et al. [2005] recently introduced a new photometric parameter, the intrinsic colour at 12 d after maximum light (). Using the relations reported in their Tab. 1 and Tab. 2 (see also Pastorello et al. 2007), we can derive the absolute magnitudes at maximum for the , , and bands. For SN 2004eo, is found. The predicted magnitudes are given in Tab. 11.
| Method | |||
|---|---|---|---|
| Phillips(1) | –18.830.18 | –18.890.18 | –18.700.18 |
| Altavilla(2) | –18.990.08 | ||
| Reindl(3) | –18.940.07 | –18.940.05 | –18.720.08 |
| Wang(4) | –19.010.16 | –19.000.13 | –18.720.12 |
| Weighted avg. | –18.950.07 | –18.940.04 | –18.720.01 |
The different methods appear to be in good agreement. Only for the magnitude obtained applying the Phillips et al. [1999] relation do we see a non–negligible deviation. Averaging the absolute magnitudes, we obtain , , and mag. Given the uncertainties, these values are consistent with the directly measured magnitudes (cf. Tab. 10), which are marginally brighter.
Another useful photometric parameter is the stretch factor [1997]. The measured value for SN 2004eo is . This value is similar to that derived using a relation between and [2004]: .
Finally, we can estimate the explosion epoch by applying the method proposed by Riess et al. [1999b]. Assuming that the SN luminosity is proportional to the square of the time elapsed since explosion and considering all photometric points starting around d (including -band measurements from Gonzalez et al. 2004), we obtain a rise time d. This is a slightly short time for a relatively fast–declining SN Ia, but surprisingly similar to the rising time determined by Garg et al. [2007] using broad–band observations of a sample of 14 SNe‘Ia at –0.35, behind the Large Magellanic Cloud ((stat) 0.07(sys)).
Consequently, the epoch of the explosion of SN 2004eo is estimated to be JD = 2,453,261.5 0.8.
3.6 Ejected Mass of 56Ni
An important physical parameter of SNe Ia, the mass of 56Ni synthesized, can be estimated by modelling the bolometric light curves. The bolometric light curve of SN 2004eo was derived from the observed uvoir light curve (see Sect. 3.4 and Fig. 5), applying the UV and IR corrections of Suntzeff [1996].
The light–curve model was computed using a grey Monte Carlo code developed by Mazzali et al. [2001]. The code accounts for the propagation and deposition of gamma–ray photons and positrons emitted in the radioactive decay chain 56Ni to 56Co to 56Fe, followed by diffusion through the ejecta of the photons which ultimately constitute the observed SN light.
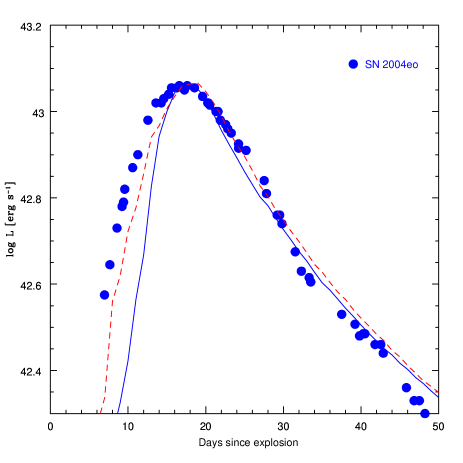
In Fig. 7 we compare the bolometric light curve of SN 2004eo with the model computed for SN 2002bo [2005]. This originally invoked 0.50–0.55 M⊙ of ejected 56Ni mass, but here it has been scaled down to 0.45 M⊙ in order to fit the lower bolometric luminosity of SN 2004eo. The bolometric light curve of SN 2004eo is slightly broader than the model, but is otherwise consistent with it. This mass is close to the lower limit of the 56Ni mass range observed in normal SNe Ia, about 0.4–1.1 M⊙ [1997].
For completeness, we also show in Fig. 7 a synthetic light curve based on the W7 density distribution [1984] scaled to a 56Ni mass of 0.45 M⊙. This yields a rather poorer reproduction of the observed light curve, especially in the rising phase. The better match of the Stehle et al. (2005) model at this time is due to their inclusion of outward mixing of 56Ni.
3.7 Decline Rate During the Nebular Phase
The , , , and decline rates of SN 2004eo during the nebular phase (between +190 d and +350 d) were also computed (see Tab. 10, last line). The slopes of the , , and light curves (about 1.5–1.6 mag/100 d) are in good agreement with the average slope (1.4 mag/100 d) computed by Lair et al. [2006] for normal and luminous SNe Ia (or high–velocity and low–velocity gradient SNe Ia, following the nomenclature introduced by Benetti et al. 2005; see Sect. 5). During this phase, the ejecta become transparent to the gamma rays and the luminosity is increasingly powered by the energy deposition of the trapped positrons. However, a fraction of the positrons may escape, resulting in a steeper light-curve decline than would be expected from the combined effects of just 56Co decay and increasing gamma–ray escape. Indeed, this steeper decline in the , , and light curves is usually observed in SNe Ia at late phases [1997, 1999].
The behaviour of the late-time -band magnitude decline is expected to be slightly different. Lair et al. [2006] indeed found that a slower average decline rate in the late–time -band light curve (0.94 mag/100 d) could be a common characteristic of normal SNe Ia. This is true also for SN 2004eo, although the -band light curve actually declined at a slightly higher rate (1.25 mag/100 d). Lair et al. suggested that the reason for the slow -band decline could be a shift of the late–time flux from optical to IR wavelengths. This is consistent with an almost constant IR luminosity during the nebular phase, as was found for SN 2000cx at 1–1.5 years past the -band maximum [2004].

4 Spectroscopy
Spectroscopic monitoring of SN 2004eo spanned the period 11 d to +72 d. Three spectra were obtained before maximum brightness, and 15 after. In addition, a late-time VLT spectrum was obtained at about 8 months. IR spectroscopic observations were performed at +2, +22, and +36 d. Unfortunately, the resolution and/or the signal–to–noise ratio (S/N) of the IR spectra obtained for SN 2004eo are rather poor.
4.1 Optical Spectra

The optical spectra of SN 2004eo obtained during the first season are shown in Fig. 8. The earliest spectra exhibit the broad P–Cygni lines typical of SNe Ia: the characteristic deep absorption near 6150 Å due to Si II 6347, 6371 (hereafter Si II 6355), the Si II 5958, 5979 Å feature (hereafter Si II 5972), the W–shaped feature near 5400 Å attributed to S II 5454 and S II 5606. Other prominent features at pre–maximum epochs are Ca II HK, Mg II 4481, and several blends due to Fe II, Si II, and Si III. Fe III is also possibly detected below 5000Å. At red wavelengths, particularly strong features are the Ca II near-IR triplet, possibly with a high–velocity component [2005], and Mg II 9218, 9244. Despite contamination from the 7600 Å telluric feature, O I 7774 is clearly visible. However, there is no evidence of C II lines in the early-time spectra.
After maximum light the Ca II near-IR triplet is very prominent, while the strengths of the Si II and S II lines rapidly decline. In particular, Si II 5972 is progressively replaced by the Na I D 5890, 5896 feature. However, Si II 6355 is visible up to about 1 month past maximum. Consistent with normal SN Ia behaviour, the post–maximum spectra show strong line blanketing at blue wavelengths due to Fe II, Ni II, Co II, Ti II and Cr II lines. Apart from the persistent Ca II H&K, Ca II near-IR triplet, and Na I D features, the spectra at 50 d post–maximum are dominated by iron–group lines [2005].
A spectrum of SN 2004eo was obtained in the nebular phase at +227.6 d using the VLT UT2 equipped with FORS1 (Fig. 9). Strong forbidden lines of iron–group elements ([Fe II], [Fe III], [Ni II], [Ni III], and [Co III]) dominate the spectrum, especially in the region 4000–5500 Å. Other well–developed features are also visible: Na I D, [Ca II] 7193, 7324, and the Ca II near-IR triplet. Moreover, the prominent feature at 4000 Å can be tentatively identified as [S II] [1997].
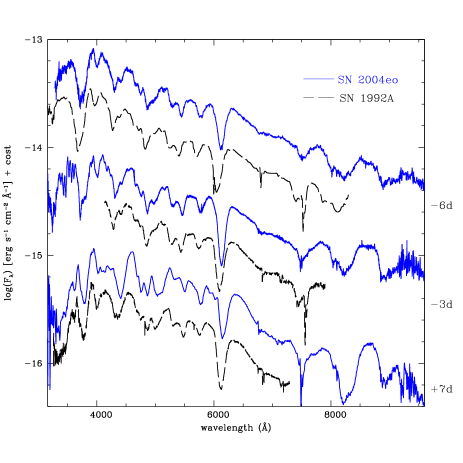
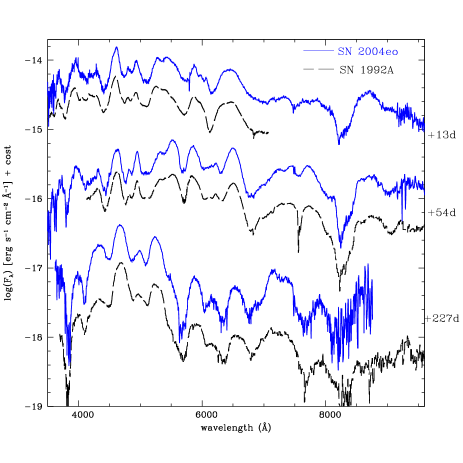
As mentioned in Sect. 3.4 and in Sect. 3.5, there are several photometric similarities between SN 2004eo and SN 1992A (the shape of the light curve, the colour evolution, and the quasi–bolometric luminosity). In Fig. 10 (left) photospheric spectra of SNe 2004eo and 1992A are compared, at 6, 3, and +7 d. At all epochs the spectra of SNe 2004eo and 1992A show comparable line strengths, with some differences in the line velocities, with those of SN 2004eo being significantly lower. In Fig. 10 (right) spectra of the same two SNe are shown, at about +13, +54, and +227 d. At +227 d, there is some difference between the two events in the relative strength of features in the and regions, which may help to explain the anomalously red colour of SN 2004eo after +200 d. Below 5000 Å, the [Fe III] 4700 / [Fe II] 4300 intensity ratio [1997] appears to be lower in SN 2004eo with respect to SN 1992A. This is consistent with a slightly lower 56Ni mass and hence lower temperature in SN 2004eo (Mazzali et al., in preparation). However, despite these minor differences, most of the spectral features confirm the strong similarity of the two SNe, already apparent in their photometric parameters (see, e.g., Sect. 3.5).

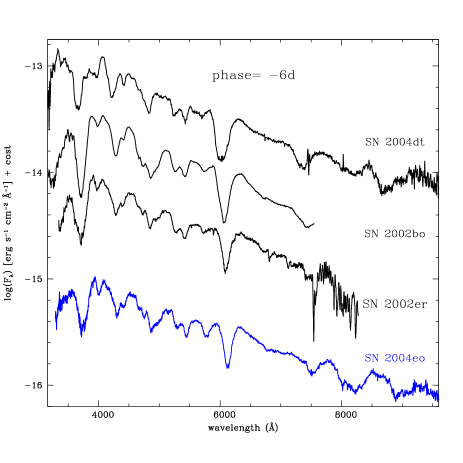
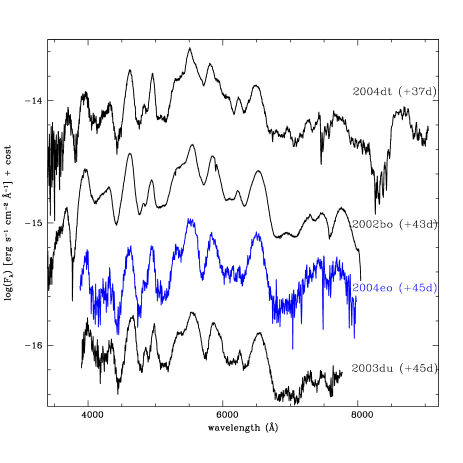
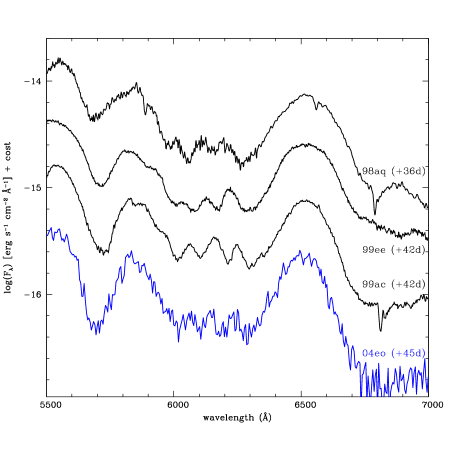
In Fig. 11 pre–maximum spectra (6 d, left) and post–maximum spectra ( +45 d, right) of SN 2004eo are compared with those of normal SNe Ia at similar phases [2007, 2004, 2005, 2007]. At the pre–maximum phase, of particular note is the greater prominence of the Si II 5972 line in SN 2004eo, again suggesting lower temperatures in this event. At +45 d, SN 2004eo shows a curious sequence of faint, narrow features in the 6000–6300 Å region. This has occasionally been observed in other SNe Ia and is probably produced by Fe II lines. An enlargement of this spectral region is shown in Fig. 12, compared with the same region of spectra of SNe 1998aq [2003], 1999ac [2005], and 1999ee [2002] at comparable phases, available in the SUSPECT 666http://bruford.nhn.ou.edu/suspect/index1.html archive of SN spectra.
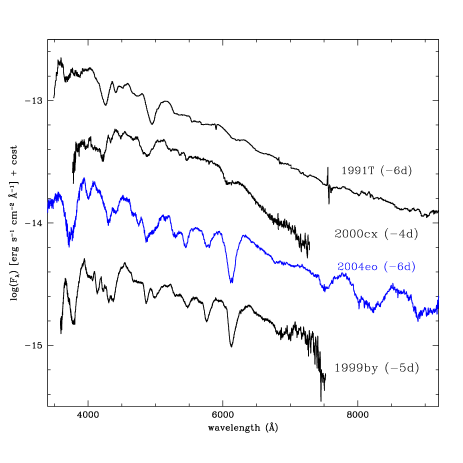
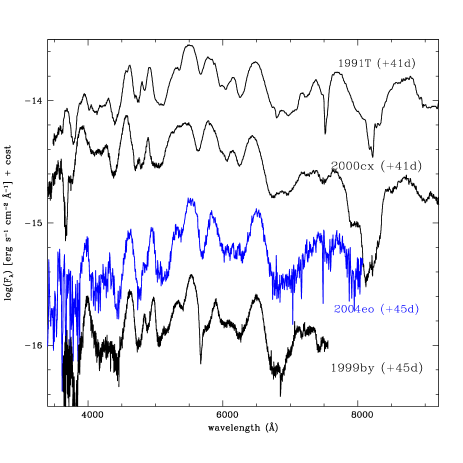
Fig. 13 shows the same two spectra of SN 2004eo as Fig. 11, but now compared with pre-maximum (left panel) and post-maximum (right panel) spectra of three peculiar SNe Ia: SN 1991T [1995, 1998], SN 2000cx [2001], and the underluminous (SN 1991bg–like) SN 1999by [2004]. Both the pre- and post-maximum spectra of SN 2004eo show some similarity to those of SN 1999by, although the line velocities of SN 2004eo are somewhat higher and its Si II lines (especially that at 5972) are slightly less prominent. But the most important difference is the lack of clear evidence, in SN 2004eo, of Ti II lines which characterise the blue spectral region of SN 1999by and other low–luminosity SNe Ia (Filippenko et al. 1992a).
4.2 Infrared Spectra
Fig. 14 shows the optical and IR spectra of SN 2004eo at three epochs: +2 d, +3 weeks, and about +5 weeks. The spectrum at +2 d (see Tab. 2) shows a blue continuum. To the red of the Ca II near-IR triplet, the Mg II doublet is visible at 9230 Å (possibly blended with Mn II at 9440 Å) and the Mg II triplet at 10920 Å. Moreover, a broad absorption feature near 12100 Å may be attributed to a blend of Ca II lines. Si II dominates the broad absorption near 16000 Å, possibly blended with Mg II lines. Despite the low resolution, Fe II and Co II lines are also possibly detected [2003]. As we progress from +2 d to +22 d (see Tab. 2) the spectrum becomes redder. Despite the low S/N in the IR spectrum, the -band shows a prominent Fe II absorption line at 12300 Å, while the -band region is dominated by a very broad emission feature produced by iron–group lines (Fe II, Ni II, Co II). In the +30 d spectrum (Tab. 2), the IR region is characterised by a number of broad, prominent features mainly due to Fe II, Ni II, Co II, and Si II [2002].
5 A Bridge Connecting Different Subgroups of Type Ia Supernovae ?
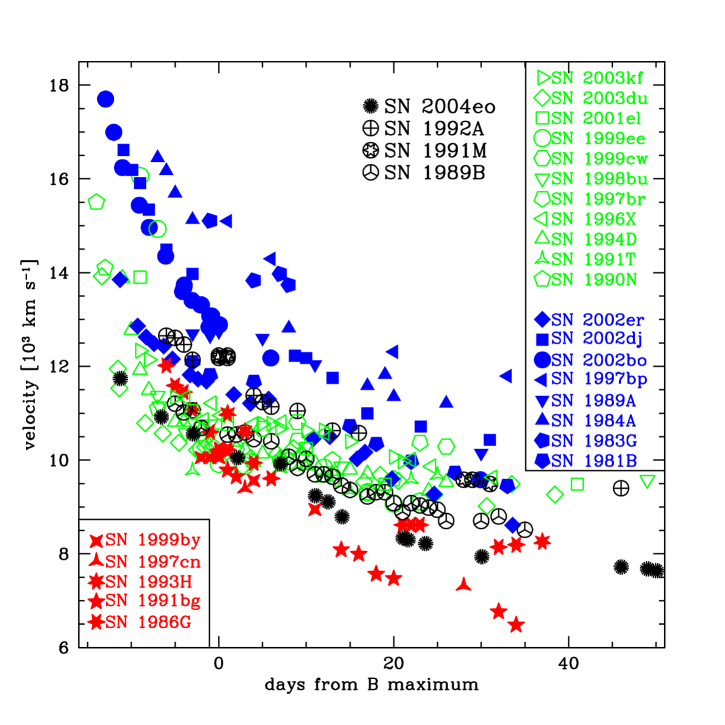
In Sect. 3.5 we found that the best match to SN 2004eo is SN 1992A [1996]. Both these SNe show somewhat lower than normal luminosity at maximum, mag (see Sect. 3.5), and rapidly declining light curves (m = 1.46 and 1.47, respectively). Nevertheless, there is some difference in the colours, SN 2004eo being redder than SN 1992A at late phases. There are also strong similarities in the spectroscopic evolution (Sect. 4.1), but again with some differences, the most significant being in the line velocities (lower in SN 2004eo) and the relative strengths of the most prominent nebular features. This mixture of similarities and differences between the two events supports the important conclusion of Benetti et al. [2004] that a single-parameter characterisation of SNe Ia does not specify the full diversity of their observed behaviour (see also Hatano et al., 2000).
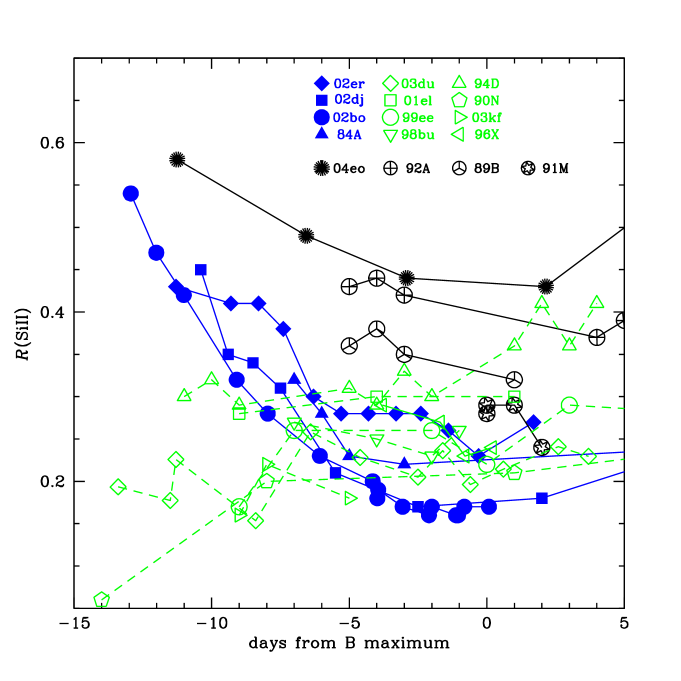
In spite of the fact that SN 2004eo is not particularly underluminous (see also the comparison with the bolometric light curve of the low–luminosity SN 1991bg in Fig. 5, Sect. 3.4), it shows some characteristics of low–luminosity SNe Ia. In general the spectroscopic evolution, the strength of the Si II lines, and the line velocities (as we will see below) are not very different from those of SN 1999by. However, while the m is higher and the colour redder than those of normal SNe Ia, they do not attain the extreme values of faint SNe Ia. These findings suggest that SN 2004eo is a normal SN Ia, but with some properties (especially the line velocities) in common with low–luminosity SNe Ia.
Benetti et al. [2005] analysed the photometric and spectroscopic properties of a sample of well–observed SNe Ia and found that they can be divided into three different subgroups:
-
•
Faint SNe Ia similar to SN 1991bg, showing low expansion velocities, rapid evolution of the Si II 6355 velocity, and low peak luminosity and temperature. The values of these parameters are the result of a low ejected 56Ni mass.
-
•
Normal–luminosity (mean absolute magnitude mag) SNe Ia, also showing a high velocity gradient (HVG), but having higher expansion velocities in the Si II lines than do the faint SNe Ia.
-
•
Normal and overluminous (SN 1991T-like) SNe Ia, showing a low velocity gradient (LVG) in the Si II lines. These events populate a narrow strip in the Si II velocity evolution diagram (cf. Fig. 15).
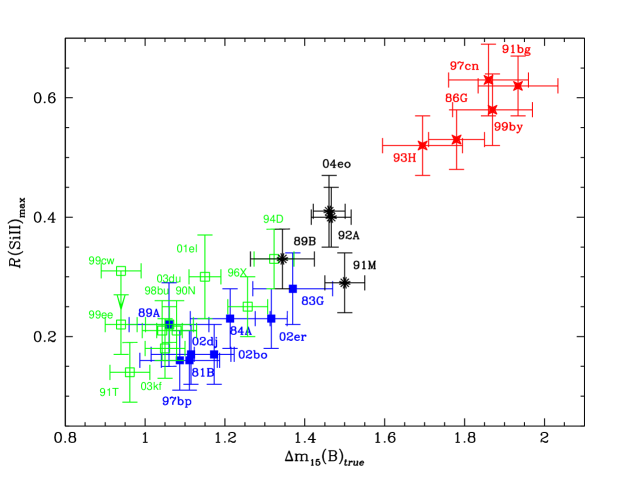
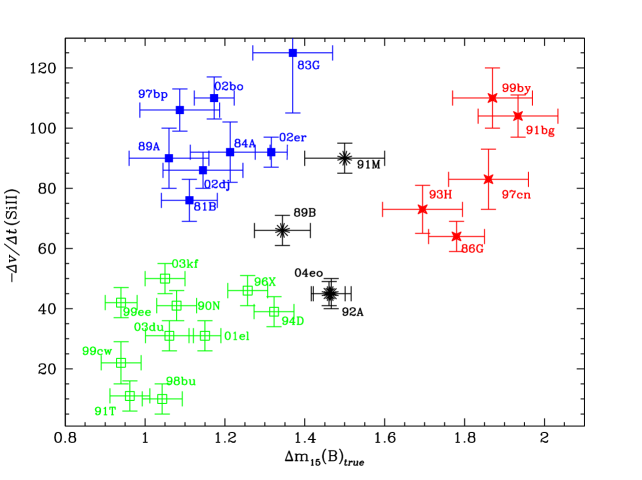
Branch et al. [2006] have presented an alternative classification scheme in which SNe Ia are divided into four subgroups on the basis of spectroscopic properties only:
-
•
Cool SNe Ia, whose spectra show red continua and are rich in metal lines (Ti II, Sc II, Cr II, Mg I, Ca I) that are prominent only when the temperatures are low. They correspond to the faint SNe Ia of Benetti et al. (2005).
-
•
Broad–line SNe Ia, spectroscopically normal, with relatively strong and broad Si II 6355. They coincide roughly with the HVG SNe Ia of Benetti et al.
-
•
Core–normal events, spectroscopically similar to the previous group, but with narrower and less prominent Si II. They form a spectroscopically highly homogeneous group and are included mainly in the LVG group of the Benetti et al. classification.
-
•
Shallow–silicon SNe Ia are spectroscopically peculiar, having a high degree of heterogeneity in observed properties. The only common feature is the weakness of the Si II absorption lines. Some examples (e.g., the high–temperature SN 1991T) show prominent Fe III features. As for the previous subdivision, they are included in the LVG group (Benetti et al. 2005).
However, some SNe Ia (e.g., SNe 1981B, 1989B, 1991M, and 1992A; see Branch et al. 2006) are of uncertain classification. We shall now compare three of these nonstandard events with SN 2004eo. One of the interesting issues is whether these transition events demonstrate that there is actually a continuum of physical properties within the SN Ia class, as already established for other SN types (e.g., SNe II-P; see Hamuy & Pinto [2002], Pastorello [2003]).
Benetti et al. [2005] found that, while the faint and HVG SNe Ia obey a plausible relation between and the depth ratio of the Si II 5972 and Si II 6355 features [hereafter (Si II)], such a relation is weaker or even absent if the LVG SNe Ia are included. Also, the pre-maximum evolution of the (Si II) parameter is strikingly different in LVG SNe Ia compared with HVG events.
In Fig. 15 the evolution of the velocity corresponding to the Si II 6355 absorption minimum is shown for SN 2004eo plus a wide range of SN Ia subtypes. The figure is an updated version of that shown by Benetti et al. [2005]. The symbols are the same as those adopted by Benetti et al. The black symbols show the data for SNe 2004eo together with the nonstandard events SN 1991M (Padova–Asiago Supernova Group777http://web.oapd.inaf.it/supern/ archive), SN 1989B [1990, 1994], and SN 1992A (Padova–Asiago Supernova Group Archive; Kirshner et al. 1993). The latter two events were considered as LVG SNe Ia by Benetti et al. [2005]. It is evident from Fig. 15 that SN 2004eo is a low–velocity event, lying roughly midway between the faint and LVG SNe Ia.
In Fig. 16 the time evolution of the (Si II) parameter is shown for SN 2004eo and a subsample of the SNe Ia in Fig. 15. The faint SNe Ia, which would occupy the upper part of this diagram, are not shown. We note that for SN 2004eo, the overall evolution is similar to that of the HVG SNe Ia, but that it has higher (Si II) values. A similar behaviour is observed for the borderline SN 1992A and (although to a lesser extent) SN 1989B (Fig. 16). These diagrams highlight the considerable heterogeneity in the observed properties of SNe Ia.
SN 2004eo plus the three nonstandard events seem to follow roughly
the relation between (Si II) and for faint
and brighter (either HVG and LVG) events (Fig.
17, top), to some extent filling in the gap
between the three subtypes. Benetti et al. [2005]
found that no clear correlation exists between
(Si II) and , although the three groups of
SNe Ia seem to cluster at three different positions in the diagram
(Fig. 17, bottom).
SN 2004eo plus the three nonstandard events lie roughly in the
middle of the diagram, away from any of the three clusters. In
particular, the position of SN 2004eo is identical to that of
SN 1992A (as measured by Hachinger et al. 2006).
As already seen in Fig. 15, these two SNe Ia seem
to establish a “link” between the faint and the LVG
SNe Ia. SN 1989B also contributes to this bridge. In addition,
SN 1991M links the faint and the HVG SNe Ia, although in
this case, the lack of spectra at phases later than about +30 d
makes the measurement of the velocity gradient of the Si II
6355 line rather uncertain and possibly
overestimated888The value of
(Si II) for SN 1991M reported by Hachinger et
al. [2006] has been updated with new estimates
using the spectra of Gomez et al. [1996]
available in the SUSPECT archive.
We conclude that SN 2004eo should be considered as a member of the group of nonstandard or “transitional” SNe Ia, along with SNe 1989B, 1991M, and 1992A. These relatively rare events are characterised by a moderate velocity gradient, relatively low ejecta velocities, peculiar (Si II) evolution, and moderately high . Branch et al. [2006] have also identified SN 1992A, SN 1989B, and (possibly) the HVG SN 1991M (see Hachinger et al. 2006) as transitional SNe. Several other SNe Ia with in the range 1.4–1.7 presented by Jha et al. [2006] and Reindl et al. [2005] are potential transitional objects (though those of Jha et al. [2006] have other peculiarities as well). This makes it possible that, as the database of well-observed SNe Ia grows, the clustered distribution of SNe Ia in the subgroups of Benetti et al. (2005) will be less evident. Nevertheless, the majority of SNe Ia may still fall within the main subgroups.
6 Conclusions
We have presented optical and infrared photometric and spectroscopic observations of the Type Ia SN 2004eo. The data range from 11 d to about +314 d from the -band maximum light, with a gap of about three months when the SN went behind the Sun.
SN 2004eo has an absolute -band magnitude at maximum () which is close to (or only marginally fainter than) the average for SNe Ia. Consistent with its moderate luminosity, modeling of the bolometric light curve indicates that about 0.45 M⊙ of 56Ni was ejected, which is close to the lower limit of the 56Ni mass range observed in normal SNe Ia. However, its late–time red colour, low line velocity, high value of (1.46), and evolution of the (Si II) parameter are peculiar for a “normal” SN Ia. Its behaviour is very similar to that of SN 1992A and (to a smaller degree) SN 1989B. These three unusual SNe Ia (together with SN 1991M) exhibit observational properties intermediate between the faint and more typical SNe Ia.
We conclude that there may exist a continuous range of physical properties in SNe Ia, rather than the discrete clusters proposed by Benetti et al (2005). However, the resolution of this issue will require larger numbers of well–observed SNe Ia.
Acknowledgments
The paper is based on observations collected at the 2.2-m and 3.5-m
telescopes of the
Centro Astronómico Hispano Alemán (Calar Alto, Spain),
the Asiago 1.82-m telescope, and the AZT–24 Campo Imperatore Telescope
(Pulkovo Observatory, Russia, and INAF Observatories, Italy),
the Telescopio Nazionale Galileo,
the Liverpool telescope, the William Herschel
Telescope, and the Nordic Optical Telascope (La Palma, Spain),
the ESO/MPI 2.2-m telescope (La Silla, Chile),
ESO–VLT (Cerro Paranal, Chile; ESO Program ID: 075.D-0346),
the 0.76-m Katzman Automatic Imaging Telescope and the 3-m Shane telescope
(Lick Observatory, California,
USA), the Anglo–Australian Telescope, the 2.3-m and
1-m telescopes (Siding Spring Observatory, Australia),
and the Tenagra 0.81-m telescope (Arizona, USA).
We thank the support astronomers at the Telescopio Nazionale Galileo,
the Liverpool Telescope, the William Herschel Telescope, the Nordic
Optical Telescope, the 2.2-m and
3.5m telescopes of Calar Alto, and the ESO–VLT and ESO/MPI 2.2-m telescope
for performing the follow–up observations of SN 2004eo.
We also thank R. Viotti for his collaboration during
ToO observations of SN 2004eo with the Asiago 1.82-m telescope.
A.P. thanks Marco Fiaschi for providing a -band observation
using the 0.41-m Newton telescope of the Gruppo Astrofili di Padova.
This work was supported by the European Union’s Human
Potential Programme “The Physics of Type Ia Supernovae,”
under contract HPRN-CT-2002-00303.
A.V.F.’s group at the University of California, Berkeley, is supported
by National Science Foundation (NSF) grant AST-0607485 and by the
TABASGO Foundation. KAIT was made possible by generous donations
from Sun Microsystems, Inc., the Hewlett-Packard Company, AutoScope
Corporation, Lick Observatory, the NSF, the
University of California, and the Sylvia & Jim Katzman
Foundation.
This research used the NASA/IPAC Extragalactic
Database (NED), which is operated by the Jet Propulsion Laboratory,
California Institute of Technology, under contract with the National
Aeronautics and Space Administration. We also made use of the Lyon-Meudon
Extragalactic Database (LEDA), supplied by the LEDA team at
the Centre de Recherche Astronomique de Lyon, Observatoire de Lyon.
References
- [2004] Altavilla, G. et al., 2004, MNRAS, 349, 1344
- [2007] Altavilla, G. et al., 2007, (to be submitted)
- [2004] Arbour, R., Armstrong, M., Boles, T., Itagaki, K., Nakano, S., Moore, M., Li, W., Briggs, D., 2004, IAU Circ. 8406
- [1990] Barbon, R., Benetti, S., Rosino, L., Cappellaro, E., Turatto, M., 1990, A&A, 237, 79
- [2004] Benetti, S. et al., 2004, MNRAS, 348, 261
- [2005] Benetti, S. et al., 2005, ApJ, 623, 1011
- [1990] Bessell, M. S., 1990, PASP, 102, 1181
- [1997] Bowers, E. J. C., Meikle, W. P. S., Geballe, T. R., Walton, N. A., Pinto, P. A., Dhillon, V. S., Howell, S. B., Harrop-Allin, M. K., 1997, MNRAS, 290, 663
- [2003] Branch, D. et al., 2003, AJ, 126, 1489
- [2005] Branch, D., Baron, E., Hall, N., Melakayil, M., Parrent, J., 2005, PASP, 117, 545
- [2006] Branch, D. et al., 2006, PASP, 118, 560
- [1997] Cappellaro, E., Mazzali, P. A., Benetti, S., Danziger, I. J., Turatto, M., Della Valle, M., Patat, F., 1997, A&A, 328, 203
- [1989] Cardelli, J. A., Clayton, G. C., Mathis, J. S., 1989, ApJ, 345, 245
- [2000] Contardo, G., Leibundgut, B., Vacca, W. D., 2000, A&A, 359, 876
- [1981] Elias, J. H., Frogel, J. A., Hackwell, J. A., Persson, S. E., 1981, ApJ, 251, L13
- [2006] Elias-Rosa, N., et al. 2006, MNRAS, 369, 1880
- [2005] Filippenko, A. V., 2005, in White Dwarfs: Cosmological and Galactic Probes, ed. E. M. Sion, S. Vennes, H. L. Shipman (Dordrecht: Springer), 97
- [1992a] Filippenko, A. V. et al., 1992a, AJ, 104, 1543
- [1992b] Filippenko, A. V. et al., 1992b, ApJ, 384, L15
- [2001] Filippenko, A. V., Li, W., Treffers, R. R., Modjaz, M., 2001, in Small-Telescope Astronomy on Global Scales, ed. W. P. Chen, C. Lemme, B. Paczyński (San Francisco: ASP), 121
- [2005] Garavini, G. et al., 2005, AJ, 130, 2278
- [2007] Garg, A. et al., 2007, AJ, 133, 403
- [2004] Garnavich, P. M. et al., 2004, ApJ, 613, 1120
- [2000] Gibson, B. K. et al., 2000, ApJ, 529, 723
- [1996] Gomez, G., Lopez, R., Sanchez, F., 1996, AJ, 112, 2094
- [1998] Gomez, G., Lopez, R., 1998, AJ, 115, 1096
- [2004] Gonzalez, S., Krzeminski, W., Folatelli, G., Hamuy, M., Morrell, N., 2004, IAU Circ. 8409
- [2006] Hachinger, S., Mazzali, P. A., Benetti, S., 2006, MNRAS, 370, 299
- [1993] Hamuy, M., Phillips, M. M., Wells, L. A., Maza, J., 1993, PASP, 105, 787
- [1994] Hamuy, M., Suntzeff, N. B., Heathcote, S. R., Walker, A. R., Gigoux, P., Phillips, M. M., 1994, PASP, 106, 566
- [1995] Hamuy, M., Phillips, M. M., Maza, J., Suntzeff, N. B., Schommer, R. A., Aviles, R., 1995, AJ, 109, 1
- [1996a] Hamuy, M., Phillips, M. M., Suntzeff, N. B., Schommer, R. A., Maza, J., Smith, R. C., Lira, P., Aviles, R., 1996, AJ, 112, 2438
- [1996b] Hamuy, M., Phillips, M. M., Suntzeff, N. B., Schommer, R. A., Maza, J., Aviles, R., 1996, AJ, 112, 2391
- [2002] Hamuy, M. et al., 2002, AJ, 124, 417
- [2002] Hamuy, M., Pinto, P. A., 2002, ApJ, 566, L63
- [1999] Hatano, K., Branch, D., Fisher, A., Baron, E., Filippenko, A. V., 1999, ApJ, 525, 881
- [2000] Hatano K., Branch D., Lentz E. J., Baron E., Filippenko A. V., Garnavich P.M., 2000, ApJ, 543, L49
- [1998] Hunt, L. K., Mannucci, F., Test, L., Migliorini, S., Stanga, R. M., Baffa, C., Lisi, F., Vanzi, L., 1998, AJ, 115, 2594
- [2006] Jha, S. et al., 2006, AJ, 131, 527
- [1996] Kim, A., Goobar, A., Perlmutter, S., 1996, PASP, 108, 190
- [1993] Kirshner, R. P. et al., 1993, ApJ, 415, 589
- [2005] Kotak, R. et al., 2005, AA, 436, 1021
- [2003] Krisciunas, K. et al., 2003, AJ, 125, 166
- [2004] Krisciunas, K. et al., 2004, AJ, 128, 3034
- [2006] Lair, J. C., Leising, M. D., Milne, P. A., Williams, G. G., 2006, AJ, 132, 2024
- [1992] Landolt, A. U., 1992, AJ, 104, 340
- [1990] Leibundgut, B., 1990, A&A, 229, L1
- [1993] Leibundgut, B. et al., 1993, AJ, 105, 301
- [2005] Leonard, D. C., Li, W., Filippenko, A. V., Foley, R. J., Chornock, R., 2005, ApJ, 632, 420L
- [2001] Li, W. et al., 2001, PASP, 113, 1178
- [1998] Lira, P. et al., 1998, AJ, 115, 234
- [1997] Liu, W., Jeffery, D. J., Schultz, D. R., 1997, ApJ, 483, L107
- [2003] Marion, G. H., Höflich, P., Vacca, W. D., Wheeler, J. C., 2003, ApJ, 591, 316
- [1988] Massey et al., 1988, ApJ, 328, 315
- [1995] Mazzali, P. A., Danziger, I. J., Turatto, M., 1995, A&A, 297, 509
- [1998] Mazzali, P. A., Cappellaro, E., Danziger, I. J., Turatto, M., Benetti, S., 1998, ApJ, 499, 49
- [2001] Mazzali, P. A., Nomoto, K., Cappellaro, E., Nakamura, T., Umeda, H., Iwamoto, K., 2001, ApJ, 547, 988
- [2005] Mazzali, P. A. et al., 2005, ApJ, 623, 37
- [1996] Meikle, W. P. S. et al., 1996, MNRAS, 281, 263
- [2000] Meikle, W. P. S., 2000, MNRAS, 314, 782
- [1999] Milne, P. A., The, L.-S., Leising, M. D., 1999, ApJS, 124, 503
- [1984] Nomoto, K., Thielemann, F.-K., Yokoi, K., 1984, ApJ, 286, 644
- [2002] Nugent, P., Kim, A., Perlmutter, S., 2002, PASP, 114, 803
- [2003] Pastorello, A., 2003, PhD Thesis, Univ. di Padova
- [2007] Pastorello, A. et al., 2007, MNRAS, in press
- [1996] Patat, F., 1996, PhD Thesis, Univ. di Padova
- [1996] Patat, F., Benetti, S., Cappellaro, E., Danziger, I. J., Della Valle, M., Mazzali, P. A., Turatto, M., 1996, MNRAS, 278, 111
- [1997] Perlmutter, S. et al., 1997, ApJ, 483, 565
- [1993] Phillips, M. M., 1993, ApJ, 413, L105
- [1999] Phillips, M. M., Lira, P., Suntzeff, N. B., Schommer, R. A., Hamuy, M., Maza, J. 1999, AJ, 118, 1766
- [2003] Phillips, M. M. et al. 2003, in From Twilight to Highlight: The Physics of Supernovae, ed. W. Hillebrandt, B. Leibundgut (Berlin: Springer-Verlag), 193
- [2004] Pignata, G. et al., 2004, MNRAS, 355, 178
- [1977] Pskovskii, Yu. P., 1977, SvA, 21, 675
- [1995] Richmond, M. W. et al., 1995, AJ, 109, 2121
- [2005] Reindl, B., Tammann, G. A., Sandage, A., Saha, A., 2005, ApJ, 624, 532
- [1999a] Riess, A. G. et al., 1999a, AJ, 117, 707
- [1999b] Riess, A. G., Filippenko, A. V., Li, W., Schmidt, B. P., 1999b, AJ, 118, 2668
- [2005] Riess, A. G. et al., 2005, ApJ, 627, 579
- [2001] Saha, A., Sandage, A., Thim, F., Labhardt, L., Tammann, G. A., Christensen, J., Panagia, N., Macchetto, F. D., 2001, ApJ, 551, 973
- [2001] Salvo, M. E., Cappellaro, E., Mazzali, P. A., Benetti, S., Danziger, I. J., Patat, F., Turatto, M., 2001, MNRAS, 321, 254
- [1998] Schlegel, D. J., Finkbeiner, D. P., Davis, M., 1998, ApJ, 500, 525
- [1994] Schmidt, B. P., Kirshner, R. P., Leibundgut, B., Wells, L. A., Porter, A. C., Ruiz-Lapuente, P., Challis, P., Filippenko, A. V., 1994, ApJ, 434, 19
- [2004] Sollerman, J., et al., 2004, A&A, 428, 555
- [2007] Stanishev, V., et al., 2007, A&A, submitted
- [2005] Stehle, M., Mazzali, P. A., Benetti, S., Hillebrandt, W., 2005, MNRAS, 360, 1231
- [2002] Stritzinger, M. et al., 2002, AJ, 124, 2100
- [1996] Suntzeff, N. B., 1996, in Supernovae and Supernova Remnants, ed. R. McCray, Z. Wang (Cambridge: Cambridge University Press), 41
- [2006] Taubenberger, S. et al., 2006, MNRAS, 371, 1459
- [1998] Theureau, G., Bottinelli, L., Coudreau-Durand, N., Gouguenheim, L., Hallet, N., Loulergue, M., Paturel, G., Teerikorpi, P., AAS, 1998, 130, 333
- [2001] Tonry, J. L., Dressler, A., Blakeslee, J. P., Ajhar, E. A., Fletcher, A. B., Luppino, G. A., Metzger, M. R., Moore, C. B., 2001, ApJ, 546, 681
- [1995] Tsvetkov, D. Yu., Pavlyuk, N. N., 1995, AstL, 21, 606
- [1996] Turatto, M., Benetti, S., Cappellaro, E., Danziger, I. J., Della Valle, M., Gouiffes, C., Mazzali, P. A., Patat, F., 1996, MNRAS, 283, 1
- [1992] Wainscoat, R. J., Cowie, L. L., 1992, AJ, 103, 332
- [2005] Wang, X., Wang, L., Zhou, X., Lou, Y.-Q. Li, Z., 2005, ApJ, 620, L87
- [1994] Wells, L. A. et al., 1994, AJ, 108, 2233